 Open Access Article
Creative Commons Attribution 3.0 Unported Licence
Development of effective sequence multi-barrier reactive media for nitrate remediation in groundwater systems
Muntaka Dahiru *ac,
Abu Bakar Nor Kartini
 *a and
Ismail Yusoff
 b
b
aDepartment of Chemistry, University of Malaya, 50603 Kuala Lumpur, Malaysia. E-mail: kartini@um.edu.my; gwanitahir@gmail.com
bDepartment of Geology, University of Malaya, 50603 Kuala Lumpur, Malaysia. E-mail: ismaily70@um.edu.my
cDepartment of Science Lab. Tech., Kano State Polytechnic, Nigeria
First published on 17th May 2019
Abstract
Early depletion of carbon-based electron donors and pollution swapping are among the recalcitrant challenges for in situ remediation technology. There is a pressing need to provide a slow but steady dose of materials for a prolonged period in order to sustain in situ treatments. In an effort to develop effective sequence multi-barrier reactive media that can address these challenges, the present study reports laboratory column experiments using organic (date seed, Moringa oleifera and wood chips) and inorganic (limestone; CaCO3) carbonaceous materials in varying proportions. The substances are supported by paleo sandy beach soil and are sequentially packed in line with the geometric pattern of a hypothetical funnel and gate for nitrate (NO3−) remediation. The optimized reactive media show remarkable efficiency, remediating 94.4% of NO3− as a target pollutant within the system. They also remediate 99.20% of the NO3− down the gradient and 96.4% of its lethal by-product – NO2−. However, with the generation of an 11-fold biomass build-up, the system is only able to eliminate 53% of the total organic carbon generated. Hence, the advective dispersive features of aquifers are required for the complete remediation of the generated secondary biomass. The results also reveal that the efficiency of the sequential media depends on the composition/ratio of the constituents, flow rate and the initial concentration of NO3− in the influent. Surface characterization studies (FESEM-EDX and FTIR) show that compared to wood chips, date seed is less prone to degradation, suggesting a longer life span. A degradation study affirms the findings of the surface studies as it reveals that the half-life of date seed is three times longer than that of wood chips. In addition, the study reveals that the double exponential model is more suitable than the single exponential model in determining the rate of decay of both wood chips and date seed.
1 Introduction
The threat of groundwater nitrate contamination has been raising global concerns as human activities that emit both point and non-point sources of pollution are increasing at an alarming rate. The European Union water framework once directed that, for safety purposes, the increasing anthropogenic groundwater contamination must be reversed by 2015. Anthropogenic inputs to nitrate accumulation in groundwater have been rated as high, with agricultural activities accounting for 45% of nitrate accumulation.1 Considering the effect of nitrates on human health and the reliance of a large number of people on groundwater exploitation, nitrate-polluted water remediation is attracting growing attention. Currently, a biological remediation technique using a permeable reactive barrier (PRB) has been identified as the most cost effective and safe technique.2 However, the technology is facing several challenges, which limit its application for site-specific reasons. Site-specific parameters such as groundwater flow rate, mineral content, uniformity of packing structure (heterogeneity or homogeneity), pH variation pattern,3 dissolved oxygen content and availability of electron donors (such as organic carbon, Fe and Mn) are reported to significantly influence the performance of the reactive barrier.4A PRB is a subsurface structure that can either be in the form of continuous wall or a funnel and gate. The gate is the permeable site, packed with reactive media for remediation. Factors such as the influence of the packing structure,5 composition of the reactive media,3 positioning of the gate in relation to the impermeable wall,6 mechanism of remediation, and nature and state of the reactive media have great influence over the efficiency of remediation at the gate.7
In the biological remediation technique, the use of natural substances (such as carbon sources) in the PRB gate for denitrification is very useful as bacteria in subsurface-saturated zones can obtain energy from both organic and inorganic sources. Examples of carbon sources used in field and laboratory scale remediation include methanol, ethanol, sucrose, glucose,8,9 soft wood, pine bark, sawdust and plant compost.5,10,11
In a natural setting, both heterotrophic and autotrophic denitrifications occur simultaneously.12 Heterotrophic denitrification is observed to be the dominant process. It also facilitates other forms of denitrification by depleting oxygen. However, heterotrophic denitrification is limited by the rapid decline of the carbon source at the gate.13 Therefore, there is a need to develop techniques that will ensure the consistent, slow and stable release of carbon from cellulose-based solid substances.5 A similar paradigm shift of strategy is taking place in remediating chlorocarbon compounds where control release materials are being studied.14
Safety and long-term performance are also major concerns for PRBs. In addition, pollution swapping often occurs in which the by-products from the decomposed reactive media generate other pollutants of concern. These problems have been preventing the smooth application of the technology. While striving to provide solutions, field and laboratory studies (column studies) have been conducted with a number of proposed reactive materials in simulated aquifer conditions. Remediation assessments of petroleum products, nitrate, chlorinated hydrocarbons, metals in acid sulfate terrain and long-term performance have been conducted.5,15
In an effort to simulate the nitrate attenuation pattern, the present study reports a laboratory column experiment designed to fit into the gates of a novel twin-funnel and gate structure (unpublished work) in order to address the problem of early depletion of reactive media (longevity) and pollution swapping. This study, unlike many in the field, pays special attention to the type and nature of the soil, which was investigated to support heterotrophic and autotrophic denitrification. For the fast and steady supply of electron donors, some organic/inorganic substrates (date seed, Moringa oleifera seed and limestone) were utilized in different positions and in different proportions, representing multi-sequence reactive media.
The objective of this laboratory-scale column study was to evaluate the longevity performance of a combined biological and physical system of remediation. The study also tested a designed multi-sequence reactive barrier in line with a funnel structure, and the reliability of the permeable reactive interceptor (PRI) concept by evaluating the influences of the relative positions and proportions of the reactive media on the efficiency of remediation. This was achieved through studying the simultaneous mitigation of the main target pollutant (nitrate) and the released by-product of the organic sources (secondary biomass) within the media (in the first column) and down the gradient (in the second column). To the best of the authors' knowledge, this study is the first of its kind in terms of utilizing paleo-beach soil as the source of the inorganic electron donor (Fe) for autotrophic denitrification. It is also noteworthy that the arrangement of gate simulation in a column followed by downgradient aquifer simulation in a second column is essential for the progressive attainment of remediation goals.
2 Materials and methods
A combination of organic and inorganic electron sources was incorporated into the reactive media. These included date seed, sawdust, wood chips, Moringa oleifera, limestone and iron rich paleo-beach soil. The method of parallel-packing the structures in a series column arrangement was employed.The reagents used included multi-element ion chromatography anion standard solution (certified reference material, Sigma-Aldrich) and, in line with the manufacturer's requirements, eluents consisting of 0.5 M NaCO3 and 0.5 M NaHCO3 as well as AnalaR grade KNO3 (Fisher Scientific). The instruments used included a Dionex 1100 IC, ultrasonic machine, digital multi-use lab shaker (Orbital Shaker), weighing balance, peristaltic pump (Masterflex L/S), desiccator, SSM-5000A Shimadzu total carbon (TOC) analyzer, Field Emission Scanning Microscopy-Energy Dispersive X-ray (FESEM-EDX) analyser (Hitachi, model: SU8220) and Fourier transform-infrared (FTIR) spectrophotometer (Spectrum 400).
2.1 Reactive media (materials) used and rationale
Based on the findings in a published work that led to this research, date seed was chosen because it had the lowest rate of water absorption capacity and least objectionable organic extracts of a range of seeds tested.16 In addition, the thick walled endosperm of the seed consists of over 90% mannan and a small amount of cellulose, serving as a store for carbohydrate.17 Moreover, date seed has been reported to resist decomposition for more than 2000 years.18 Other carbon sources selected for ease of decomposition and specific substrates of interest included humus (in the soil), Moringa oleifera (containing sulfate), sawdust, limestone and wood chips.Moringa oleifera was used because the participation of sulfate reducing bacteria and the possibility of rapid reaction between undissociated protons (in H2S) and iron-derived electrons (for production of hydrogen) is well documented in the subsurface aqueous region. Therefore, the occurrence of hydrogenotrophic denitrification is highly likely.19 Moreover, the presence of metal sulfide in the form of iron sulfide in paleo-beach soil has been reported.20,21 It has also been reported that in coastal regions, H2S might be produced from respiratory reduction of sulfate from seawater (eqn (1)).19
| Fe + H2S → FeS + H2 | (1) |
Lastly, a commercially available activated carbon was used for the adsorption of organic degradation by-products.
2.2 Preliminary treatment of the gate materials
In this work, the seeds of all the carbon sources were crushed to irregular shapes with sizes ranging from 3 mm to 5 mm. They were then washed with deionized water (to remove impurities) and screened for leachable nitrate and excessive organic acid using ion chromatography.16 The soil composite was applied to provide optimum permeability, Fe-based minerals and support. The percentage compositions of the materials were gravimetrically measured after considering the density of each material.2.3 Experimental design and column set-up
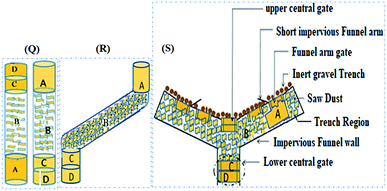
The packing structure of the reactive media in the column was designed to simulate the cross-sectional area of a novel funnel and gate set-up as well as a pristine aquifer region down the gradient. Hence, two opaque PVC columns (first and second) with internal diameters of 4.9 cm were used. The heights of the first and second columns were 100 cm and 50 cm, respectively. The first column was set to simulate the reactive media while the second column simulated the attenuation pattern at the immediate aquifer region after the PRB. Water was pumped through both columns in an up-flow mode using a multiport peristaltic pump. In addition, a separate control column was filled with soil only.As shown in Fig. 1, from bottom up, the first compartment (A) consists of an 18 cm long mixed layer packed with Moringa oleifera, soil, date seeds, and limestone in the ratio of 1.0![[thin space (1/6-em)]](https://www.rsc.org/images/entities/char_2009.gif) :
:![[thin space (1/6-em)]](https://www.rsc.org/images/entities/char_2009.gif) 115.4
115.4![[thin space (1/6-em)]](https://www.rsc.org/images/entities/char_2009.gif) :
:![[thin space (1/6-em)]](https://www.rsc.org/images/entities/char_2009.gif) 50.5
50.5![[thin space (1/6-em)]](https://www.rsc.org/images/entities/char_2009.gif) :
:![[thin space (1/6-em)]](https://www.rsc.org/images/entities/char_2009.gif) 24.3. The second layer (B) is 30.5 cm long, and consists of a mixture of soil, wood chips, sawdust and limestone in the ratio of 32
24.3. The second layer (B) is 30.5 cm long, and consists of a mixture of soil, wood chips, sawdust and limestone in the ratio of 32![[thin space (1/6-em)]](https://www.rsc.org/images/entities/char_2009.gif) :
:![[thin space (1/6-em)]](https://www.rsc.org/images/entities/char_2009.gif)
![[thin space (1/6-em)]](https://www.rsc.org/images/entities/char_2009.gif) 3:
3:![[thin space (1/6-em)]](https://www.rsc.org/images/entities/char_2009.gif) 1
1![[thin space (1/6-em)]](https://www.rsc.org/images/entities/char_2009.gif) :
:![[thin space (1/6-em)]](https://www.rsc.org/images/entities/char_2009.gif) 5.2. The third (C) and fourth (D) compartments constitute 35% of the total column height. The third layer (10 cm long) consists of a mixture of soil, date seed and limestone in the ratio 8.3
5.2. The third (C) and fourth (D) compartments constitute 35% of the total column height. The third layer (10 cm long) consists of a mixture of soil, date seed and limestone in the ratio 8.3![[thin space (1/6-em)]](https://www.rsc.org/images/entities/char_2009.gif) :
:![[thin space (1/6-em)]](https://www.rsc.org/images/entities/char_2009.gif) 1.7
1.7![[thin space (1/6-em)]](https://www.rsc.org/images/entities/char_2009.gif) :
:![[thin space (1/6-em)]](https://www.rsc.org/images/entities/char_2009.gif) 1, while the fourth (13.5 cm long) consists of activated carbon and soil in the ratio 1
1, while the fourth (13.5 cm long) consists of activated carbon and soil in the ratio 1![[thin space (1/6-em)]](https://www.rsc.org/images/entities/char_2009.gif) :
:![[thin space (1/6-em)]](https://www.rsc.org/images/entities/char_2009.gif) 1.6. The pore volume and porosity were measured to be 693 cm−3 and 43.6% respectively. From bottom up, five sampling points (P) were punctured along the column height at 3.25 cm (P1) (influent), 27 cm (1st layer-P2), 62.5 cm (2nd layer-P3), 77.5 cm (3rd layer-P4) and 96.75 cm (4th layer-P5). In both columns, water samples were abstracted from the influent port, three intermediate sampling ports (P2 to P4) and the effluent port (P5) for analysis.
1.6. The pore volume and porosity were measured to be 693 cm−3 and 43.6% respectively. From bottom up, five sampling points (P) were punctured along the column height at 3.25 cm (P1) (influent), 27 cm (1st layer-P2), 62.5 cm (2nd layer-P3), 77.5 cm (3rd layer-P4) and 96.75 cm (4th layer-P5). In both columns, water samples were abstracted from the influent port, three intermediate sampling ports (P2 to P4) and the effluent port (P5) for analysis.
To attain a stable flow and acclimatization, the column administered with distilled water was run for three weeks before nitrate-spiked groundwater was loaded.22 For the same reason, the nitrate-spiked groundwater in all three phases was administered for 2 days to allow for an adequate incubation period before sampling for analysis.23 In addition to the adjusted material composition, the operating flow rates for running the nitrite-spiked distilled water and well water columns were 3.15 mL min−1 for the first, second and third runs and an adjusted flow rate of 2.5 mL min−1 for all of the other runs. The experiments were run at ambient temperature and the average pH values in the final run were 7.1 and 7.6 for the inlet and outlet sampling locations, respectively.
2.4 Analytical methods and instruments
Dynamic parameters such as the concentrations of PO43−, Cl−, SO42−, NO3− and NO22− were measured using ion chromatography while the temperature and pH were measured with a Mettler Toledo pH meter.Instrument validation was done by running intra-day and inter-day analyses in triplicate; the percentage deviation was 2% (i.e. 98% measurements were within the range). Total organic carbon (TOC) was measured using the TOC analyzer. Volumetric and gravimetric methods were employed to measure the pore volume and porosity of the packed columns. Differences in the morphologies and functional group appearances between fresh and used hard carbon sources (date seed and wood chips) were explored for interpreting the FESEM-EDX and FTIR results in order to predict longevity potential and degradation patterns of the reactive media. The analytical weighing balance, ovum and desiccator were used for the gravimetric determination of mass loss using the litter bag technique.
3 Results and discussion
The results of the column analysis, surface characterization and decomposition of the materials proved the efficacy of the gate material and provided an insight into the decomposition pattern of the carbonaceous material used in the experiment.3.1 The column experiment
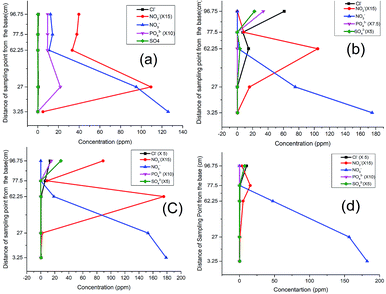
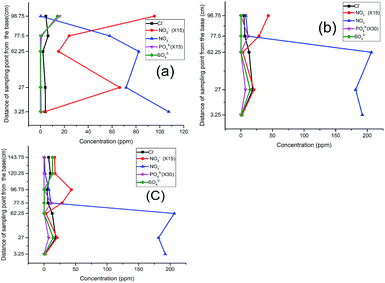
Considering the observed denitrification potential of the soil28,29 used in this experiment, the soil was envisaged to provide the denitrifying species in the system. The column experiment was divided into three phases.As the test continued in the second run (Fig. 2b), a clear shift in the nitrite peak was observed at P3 suggesting the acclimatization of the microbial community and active engagement of the sawdust chamber. A noticeable rise of peak for chloride, sulphate (Fig. 2b) and phosphate (Fig. 2c) at P5 indicated a possible release of the anions and leachable phosphate from compartment C and D within the column.
The same trend was observed in the third run except that while the nitrate was completely depleted, the nitrite began to build up to the fifth sampling point (Fig. 2c). This development indicated the possibility of oxygen infusion, nitrate reduction to ammonia30 and/or incomplete denitrification due to shorter retention times. This informed our decision to lower the flow rate from 3.15 mL min−1 to 2.5 mL min−1 to increase the residence time.
With the adjustment of the flow rate, however, a further shift of the nitrite peak was noticed to P4 instead of P3 (Fig. 2d). This indicates an improvement in remediation because from a maximum concentration of 182 ppm (32 mg L−1 which is greater than three times the maximum permissible limit of 50 mg L−1), the nitrate and nitrite were both successfully remediated to 0.0 and 0.6 mg L−1 respectively. In concordance with previous research, the analysis using distilled water revealed the influence of the flow rate,15 nature of the carbon source and timing of the process on the attenuation pattern.9,31
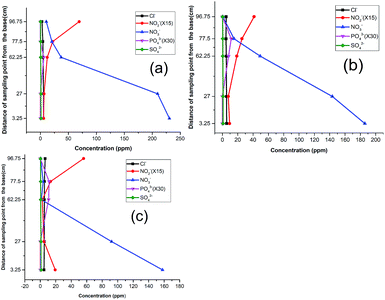
As one of the reasons for the above response, the high concentration of nitrate in the influent (230 ppm) was reduced to 185 ppm (Fig. 3b). However, no significant improvement was recorded because the nitrite still rose at P5. A curious inverse relation between chloride and nitrite suggested that these were favorable conditions for eluting adsorbed chloride from the activated carbon. This was corroborated by the observed decrease in pH around the media, and hence indicated a slowed denitrification process.36 A further reduction of the influent nitrate concentration to 157 ppm in the third run did not yield improved results either. As in the previous run, phosphate emerged at P3 and P4, affirming the release of dissolved organic phosphate from the wood media (Fig. 3c).
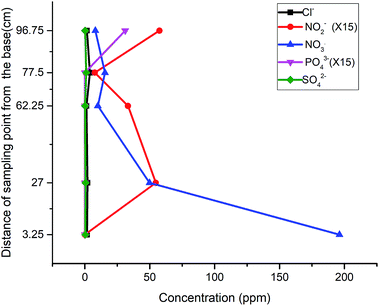
Considering the surge of leachable products in the column, adjustment of column material composition was deemed necessary and hence made to lower the amounts of carbon-based constituents across the compartments with 15%. The concentration of the nitrate was then raised to 196 ppm to observe the trends at that ratio. The result indicated a sharp decline of nitrate concentration with an accompanying surge of nitrite production (Fig. 4). Similar to the previous runs, the nitrite values indicated a build up at P5, signaling the need for further modification.
![[thin space (1/6-em)]](https://www.rsc.org/images/entities/char_2009.gif) :
:![[thin space (1/6-em)]](https://www.rsc.org/images/entities/char_2009.gif) 50.5
50.5![[thin space (1/6-em)]](https://www.rsc.org/images/entities/char_2009.gif) :
:![[thin space (1/6-em)]](https://www.rsc.org/images/entities/char_2009.gif) 1
1![[thin space (1/6-em)]](https://www.rsc.org/images/entities/char_2009.gif) :
:![[thin space (1/6-em)]](https://www.rsc.org/images/entities/char_2009.gif) 24.3 while the second compartment (B) consisted of soil, wood chips, sawdust and limestone in the ratio of 32
24.3 while the second compartment (B) consisted of soil, wood chips, sawdust and limestone in the ratio of 32![[thin space (1/6-em)]](https://www.rsc.org/images/entities/char_2009.gif) :
:![[thin space (1/6-em)]](https://www.rsc.org/images/entities/char_2009.gif) 3
3![[thin space (1/6-em)]](https://www.rsc.org/images/entities/char_2009.gif) :
:![[thin space (1/6-em)]](https://www.rsc.org/images/entities/char_2009.gif) 1
1![[thin space (1/6-em)]](https://www.rsc.org/images/entities/char_2009.gif) :
:![[thin space (1/6-em)]](https://www.rsc.org/images/entities/char_2009.gif) 5.2 (w/w). The third compartment (C) represented the final stage providing a carbon source with the constituents of soil, date seed and limestone in the ratio 8.3
5.2 (w/w). The third compartment (C) represented the final stage providing a carbon source with the constituents of soil, date seed and limestone in the ratio 8.3![[thin space (1/6-em)]](https://www.rsc.org/images/entities/char_2009.gif) :
:![[thin space (1/6-em)]](https://www.rsc.org/images/entities/char_2009.gif) 1.7
1.7![[thin space (1/6-em)]](https://www.rsc.org/images/entities/char_2009.gif) :
:![[thin space (1/6-em)]](https://www.rsc.org/images/entities/char_2009.gif) 1, while the fourth compartment (D) had soil and activated carbon in the ratio of 1
1, while the fourth compartment (D) had soil and activated carbon in the ratio of 1![[thin space (1/6-em)]](https://www.rsc.org/images/entities/char_2009.gif) :
:![[thin space (1/6-em)]](https://www.rsc.org/images/entities/char_2009.gif) 1.6 (w/w).
1.6 (w/w).The first run of the modified column revealed a skewed pattern for both nitrate and nitrite, with nitrate gaining fresh momentum in the sawdust chamber and nitrite rising much higher in the last compartment (Fig. 5a). The former could be attributed to leachable nitrate in the second compartment while the latter was attributed to possible incomplete denitrification or elution of adsorbed nitrite from the activated carbon in the previous run.
The influent concentration was raised to 196 ppm for the second run, and a continuous flow of the influent through the column revealed a much lower concentration of SO42− at P4 and P5 in the third run, justifying the assumption of its elution from the activated carbon (Fig. 5b). The recurrence of an elevated concentration of nitrate at P3 and its subsequent drop at P4 confirmed the leaching property of the sawdust chamber. Nitrate attenuation was inversely matched to that of nitrite but as the time passed by, the amount of nitrite generated at the exit reduced to less than 50% of that generated in the previous test, such that the concentration dropped from 6.36 to 2.89 ppm.
Further tests to determine the impact of the packing structure on the attenuation pattern of the parameters down the gradient attested to the efficiency of the reactive media over a short distance: when the effluent of the above assembly was used as the influent of a whole soil column, the concentrations of nitrite and nitrate were reduced to 98% and 60% respectively (Fig. 5c). This excellent attenuation capacity of the soil was however higher than that observed when a nitrate spiked sample was passed directly through a soil column, suggesting that the attenuation capacity of soils is improved when the process of remediation has begun for the influent.
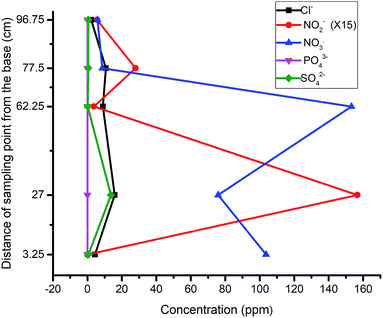
Having observed the trend of descending nitrite concentration within the gate and down the gradient, another run of influent with a lower nitrate concentration of 103 ppm was tested to determine whether the assembly could be applied without further attenuation down the gradient. The result revealed a reduced concentration of nitrate to 5.81 ppm and nitrite to 0.37 ppm (Fig. 6). This final test depicted the threshold limit concentrations of the reactive media, when natural attenuation capacity was ruled out. Also, the results obtained throughout the test indicated that the release or leaching of organic by-products and other inorganic radicals is dependent upon the degradation process taking place, which progresses over time.
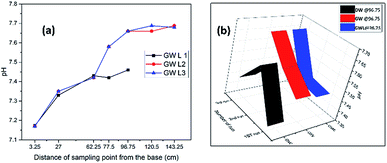
The general pattern of pH attenuation indicated that the pH response in distilled water was higher and the separation was better than those in groundwater. This may be due to the complex chemical matrix in groundwater, which is not present in distilled water. It was also observed that in both groundwater and distilled water, an elongation of the experimental period led to an improvement, shown by the rise in pH which reveals the significance of a microbial incubation and adaptation period.
A plot of pH attenuation at the exit sampling points (97.65 cm and 143.25 cm) (Fig. 7b) for the first, second and third runs using distilled water, groundwater and groundwater with lime indicated a progressive increase in pH and a stabilized pattern for the groundwater with lime. The pattern of increasing pH was observed in the distilled water sample at the latter stage. The groundwater without lime however showed a pattern of descending pH with irregular distribution. This shows the significance of lime in improving and stabilizing the pH, as can be seen in Fig. 7a, where successive runs of the experiment in groundwater with lime gave a rise in pH.
3.2 Effect of carbon source composition
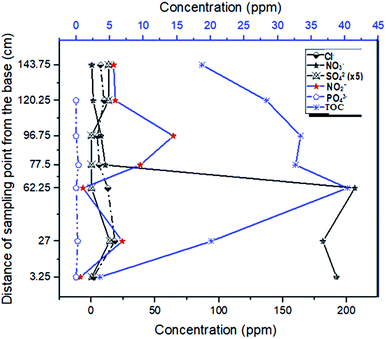
It was observed that the reduction of total organic by-products by the system was best achieved through down gradient attenuation. Starting with the initial TOC value of 3.55 ppm in the influent (at P1) and a maximum TOC concentration of 40.35 ppm at P3, a carbon buildup of 18.77 ppm was recorded at the exit of the soil column. This represents an 11-fold increase in carbon input by the materials and a 53% reduction of the carbon by the system. Because of this, and the fact that the NO3− concentration dropped from 192.14 ppm to 11.09 ppm at the exit of the first column and finally to 1.56 ppm at the exit of the second (soil) column, it is safe to assert that unlike similar remediation alternatives, our laboratory scale sequence multi-barrier reactive media has the advantage of remediating 94.2% and 99.2% of the target pollutant (NO3−) within and outside the system (down the gradient) respectively. Also, the system generated NO2− (within the denitrification process) whose concentration was three times the threshold limit value of 3 ppm (10.4 ppm) (Fig. 6). This concentration was scaled up to 156 ppm (10.4 ppm × 15), but the final NO2− concentration dropped to 5.07 ppm, and so the system is deduced to offer a 96.4% reduction of nitrite.The relatively low attenuation capacity for organic substituents within the set-up was attributed to the low flow rate, various carbonaceous matrixes (labile and recalcitrant) and the short distance in the system (as compared to that of an aquifer). The low flow rate leads to the dissolution of more organic substances out of which the labile fraction is mostly utilized by the bacteria, generating incomplete denitrification with concomitant liberation of nitrite. As the nitrate is exhausted, the rate of degradation slows down, and since denitrification is a major source of organic matter removal,39 this means that the dissolved complex organic components take longer to be completely degraded.9 A further observation of the effluent behavior in the simulated pristine aquifer condition (in a soil column) revealed a gradual, but effective downward trend in attenuation of the organic constituents generated by the media at the gate (Fig. 8).
3.3 Surface characterization techniques
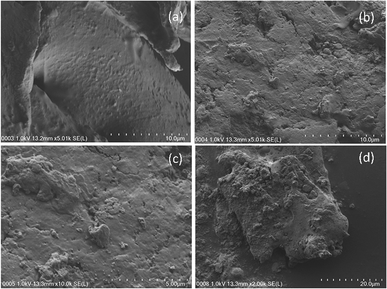 | ||
| Fig. 9 FESEM images of (a) fresh date seed (10 μm), (b) used date seed (10 μm), (c) used date seed (5 μm), (d) used date seed (20 μm). | ||
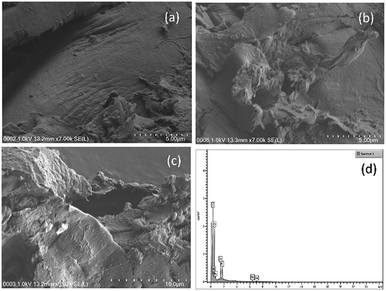 | ||
| Fig. 10 FESEM images of (a) fresh wood chips (5 μm), (b) used wood chips (5 μm), and (c) used wood chips (10 μm). (d) Elemental mapping from EDX of used date seed (25 μm). | ||
The image of the date seed taken at 2000× magnification (20 μm) revealed fragmental deformation of both the size and the surface at a lower scale, depicting an image of cracks associated with the crushing activity rather than the decomposition (Fig. 9d). This may be associated with the composition of date seed, which has been reported to consist of hemicelluloses (23%), lignin (15%) and cellulose (57%).40 It was also observed that the medium magnification image exposed more of the elements for EDX mapping. This was evident from the EDX analysis of the 5000× magnification image of the wood chips (result not shown).
The elemental mapping of the fresh wood chips indicated that carbon was present in the highest % by weight (61.12%) followed by oxygen (31.79%) and then nitrogen (7.09%) (Table 1). After subjecting the wood chips to the column test, however, new elements emerged with a concomitant decrease in the % weight of carbon to 42.96% and increases for nitrogen and oxygen to 7.58% and 33.36%, respectively (Table 1).
| S/N | Element | Wood chips before (10 μm), weight% | Wood chips after (10 μm), weight% |
|---|---|---|---|
| 1 | C | 61.12 | 42.96 |
| 2 | N | 7.09 | 7.58 |
| 3 | O | 31.79 | 33.36 |
| 4 | Al | — | 3.85 |
| 5 | Si | — | 4.13 |
| 6 | Fe | — | 8.12 |
| Total | 100.00 | 100.00 |
While the decline in mass of the carbon (30% depletion) was understandable on the basis of dissolution and decomposition, the rise of nitrogen might indicate possible leaching or some adsorbed portion of the nitrate spiked influent, or both. The elements of Al, Si and Fe emerging post-column accounted for 3.85, 4.13 and 8.12%, respectively. Here, while a possible leaching of aluminum was envisaged, much of the Fe and all of the Si would have been derived from the soil embedded in the column.
In contrast to the wood chips, the elemental mapping of fresh date seed by EDX revealed four elements: carbon, oxygen, potassium and nitrogen, with % weight distributions of 74.36%, 20%, 5.37% and 0.27% respectively (Table 2). After the column test, the weight% values changed to 67.85%, 22.36% and 9.79% for carbon, oxygen and nitrogen respectively (Table 2). This reaffirmed the trend of carbon depletion (with a 6.51% reduction over the given period) and the appreciation of oxygen and nitrogen, as experienced in the wood chips.
| S/N | Element | Fresh date seed (10 μm), weight% | Used date seed (10 μm), weight% |
|---|---|---|---|
| 1 | C | 74.36 | 67.85 |
| 2 | N | 0.27 | 9.79 |
| 3 | O | 20.0 | 22.36 |
| 4 | K | 5.37 | |
| Total | 100.00 | 100.00 |
Upon stretching the area of magnification of the used wood chips to 25 μm scale (Fig. 10d), additional elements were detected. Among them were Ca (at low percentage), Na and Fe. While Ca has been reported in date seed,41 Fe was reported to have been isolated from an extracellular substance with a strong adsorption for iron in a decaying wood.42 Besbes, et al.43 reported only 0.0023% Fe in date seed. The emergence of these elements after the column test implied that some of them were leached or sequestrated as the decomposition progressed.41
Finally, it can be deduced from the FESEM images of the surfaces of the wood chips and date seed that the wood chips were more susceptible to biological decomposition than the date seed. It is also evident from the EDX results that the 30% reduction in carbon in the wood chips was by far more than the 6.51% reduction of carbon in the date seed over the same period. In both cases, nitrogen and oxygen appreciated significantly, indicating the effect of the nitrate-spiked influent water and the redox environment on the degradation processes.
![[double bond, length as m-dash]](https://www.rsc.org/images/entities/char_e001.gif) C
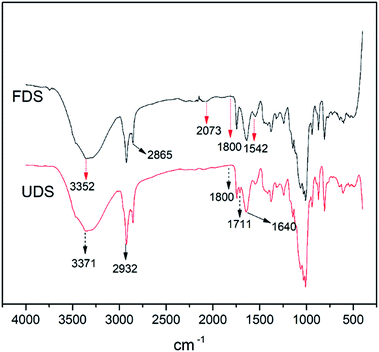
C![[double bond, length as m-dash]](https://www.rsc.org/images/entities/char_e001.gif) S) absorption due to isothiocyanate stretching which was missing in the decomposed date seed. Conversely, the peak at 1711 cm−1 in decomposed date seed, assigned to carbonyl C
S) absorption due to isothiocyanate stretching which was missing in the decomposed date seed. Conversely, the peak at 1711 cm−1 in decomposed date seed, assigned to carbonyl C![[double bond, length as m-dash]](https://www.rsc.org/images/entities/char_e001.gif) O absorption due to carboxylic acid stretching, was missing in the fresh seed (Fig. 11). This indicated a redox situation consisting of bond formation and breakage in the process of decomposition.
O absorption due to carboxylic acid stretching, was missing in the fresh seed (Fig. 11). This indicated a redox situation consisting of bond formation and breakage in the process of decomposition.
In line with a previous research finding on date seed, all the samples manifested weak bands at 1800 cm−1, indicating the presence of aromatic compounds.45 In addition, the strong and broad band for –OH absorption of alcohol stretching (3550–3200 cm−1) was present in both fresh and decomposed seed. In addition to the carboxylic acid group identified in the decomposed date seed, this could explain why decomposed products always recorded a higher oxygen content in the EDX results than the fresh products.
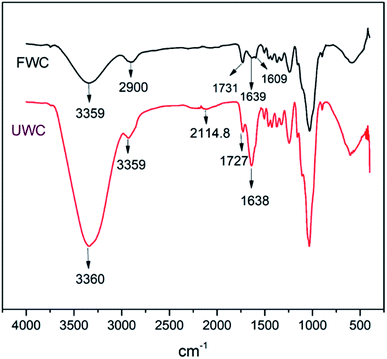
The wood chips spectra manifested distortions in intensities that occurred in the region 2115–1250 cm−1 (Fig. 12) which is a wider region wider than that obtained by Pandey46 using transmission and drift methods of FTIR. However, the manifestation of a C–H stretching absorption around 2900 cm−1 obtained in the research by Pandey coincides better with the results for the fresh wood than for the used wood in this study.
The other signals observed were of the same skeleton, but from different functional groups. Here, the signal at 1727.86 cm−1 denoting the carbonyl C![[double bond, length as m-dash]](https://www.rsc.org/images/entities/char_e001.gif) O absorption of aliphatic ketone stretching was observed in decomposed wood chips while signal at 1731.64 cm−1 for C
O absorption of aliphatic ketone stretching was observed in decomposed wood chips while signal at 1731.64 cm−1 for C![[double bond, length as m-dash]](https://www.rsc.org/images/entities/char_e001.gif) O absorption of β-unsaturated ester stretching was observed in fresh wood chips.
O absorption of β-unsaturated ester stretching was observed in fresh wood chips.
The spectra displayed significant differences in absorption bands between the fresh wood and decomposed wood for alkyne stretching (C![[triple bond, length as m-dash]](https://www.rsc.org/images/entities/char_e002.gif) C absorption, falling within the range of 2140–2100 cm−1). The protruding weak signals within the vicinity of the stretching range of monosubstituted alkynes at 2114.89 cm−1 in the decomposed wood attested to that.
C absorption, falling within the range of 2140–2100 cm−1). The protruding weak signals within the vicinity of the stretching range of monosubstituted alkynes at 2114.89 cm−1 in the decomposed wood attested to that.
In the same vein, the aromatic skeletal vibration band at 1609 cm−1 for the fresh wood chips diminished for the used wood chips, indicating a possible ring opening reaction during the decomposition. However, the intensity of the band at 1638 cm−1 (C![[double bond, length as m-dash]](https://www.rsc.org/images/entities/char_e001.gif) C absorption due to alkene stretching) in used wood chips was higher than the corresponding signal for fresh wood chips, supporting the argument that bond breakage was promoted in the decomposition process. These changes indicated the occurrence of reduction at that particular site. Finally, the strong and broad band for –OH absorption of alcohol stretching (3550–3200 cm−1) was present in both samples but it was more prominent in the decomposed wood chips than in the fresh woodchips. In summary, the process of decomposition entailed multiple redox reactions at different sites and, depending on which bond or functional group was affected in the process, different transformations were evident in this study.
C absorption due to alkene stretching) in used wood chips was higher than the corresponding signal for fresh wood chips, supporting the argument that bond breakage was promoted in the decomposition process. These changes indicated the occurrence of reduction at that particular site. Finally, the strong and broad band for –OH absorption of alcohol stretching (3550–3200 cm−1) was present in both samples but it was more prominent in the decomposed wood chips than in the fresh woodchips. In summary, the process of decomposition entailed multiple redox reactions at different sites and, depending on which bond or functional group was affected in the process, different transformations were evident in this study.
3.4 Rates of decomposition
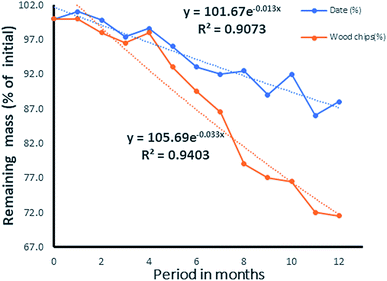
The commonly used single-exponential model (eqn (2)) was considered first in this study and the relative decomposition rates, are expressed as percentages. In line with previous findings,47 readings obtained from the observation of the decomposition process revealed that the initial rate and the late stage decomposition for both date seed and wood chips were very slow, indicating a preliminary acclimatization period. Also, an inverse relation emerged between the date seed and wood chip on the seventh month of the study but the rate of degradation was faster in wood chips than in date seed.| X = Xoe−kt | (2) |
While the decomposition of wood chips (Fig. 14) indicated a possible steady rate at the eleventh month, that of the date seed appeared slower and inconsistent. In the latter, the observation was attributed to the varying decomposition rates of the endosperm and the hard wall cover of the date seed, as shown in Fig. 13. From the values of R2 for both the date seed and the wood chips, it could be deduced that the exponential rate model fitted the decay pattern of the materials. The interpolated degradation pattern of the date endosperm (Xe) had an R2 value of 0.8805, but the date seed, date hard cover and wood chips had good R2 values of 0.9073, and 0.9148 and 0.9403, respectively. While the k values depicted the degree of the rate of degradation, the distribution patterns showed the differences in degradation potential. The degradation pattern of the endosperm (interpolated values) dictated the degradation pattern of the entire seed and hence, a similar distribution was observed for the date seen (Xd) and endosperm (Xe) (Fig. 13).
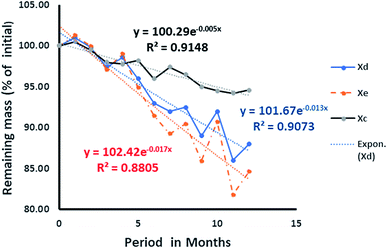 | ||
| Fig. 13 Rate of degradation of date seed: Xd is the entire date, Xc is the cover wall of the seed, and Xe is the deduced degradation pattern of the endosperm. | ||
The initial surge in mass observed in the first month for the date seed could be attributed to the binding capacity of the soft endosperm surface to dissolved organic debris from sawdust within the column. It is pertinent to observe that the sharp decline in the date seed plot began at the fourth month of the column operation and at that moment, the degradation rate of the date cover began to decline.
The same observation could be made from the sixth month through to the eighth month, where every slight loss of mass of the date seed was accompanied by slower degradation of the date cover and vice versa. In the same vein, from the seventh month onwards, whenever the date seed cover mass declined, the percentage mass loss of the interpolated endosperm matched more closely with that of the entire date seed and vice versa. We might infer that this is the period in which the date cover started to affect the degradation rate of the entire seed and hence becomes the rate determining substrate.
This differential influence of the date cover on the degradation potential might explain why the date cover tended to indicate a stabilising pattern from the ninth month onward while the date seed was yet to show any signs of stability one year after the beginning of the experiment. This also clearly indicated the presence of a recalcitrant component within the seed. Hence, we considered the double exponential model (eqn (3)):
| X = Ae−k1t + (1 − A)e−k2t | (3) |
Single exponential
| X = Xoe−kt, X = 1.1035 |
Double exponential function
| X = Ae−k1t + (1 − A)e−k2t, X = 1.099 |
With a differential margin of 8.05% and a 7.64% deviation from the experimental value of 1.02 for the single exponential and double exponential results respectively, it could be deduced that the double exponential model gave a better fit than the single exponential model as it was closer to the experimental value.
Moreover, judging from the value of the rate constants alone, a comparative analogy of differential life spans could be drawn for the wood chips and date seed. Using the rate constant to determine the half-life t(0.5), it follows that;
| t(0.5) = −ln(0.5)/k = (0.693)/k |
Given the respective values of k for the date seed and woodchips, the half-lives would be
These suggest a life time stretching to 9 years for 1 g of date seed and a life time of 4 years for 1 g of wood. The life time obtained here is similar to that for the low density woods reported by Mackensen et al.26 Depending on the quantity and quality of the carbonaceous material used, the lifetime could be several times higher than that obtained here. The advantage of the date seed is due to the slow degradation rate of the cover wall, which contains mannan. Since the above half-life was calculated based on exhausting 95% of the material, the 5% that would remain after 9 years would be the cover wall. Going by its “k” value, the half-life of the cover would be 138.6 months, which is equivalent to 12 years. The lifetime of the date seed could then be deduced to be 24 years under such weathering conditions. With this, it could be deduced that the date seed would last as much as six times longer than a wood chip before complete degradation. Though the process could be slow in the date seed, it would assure a constant supply of carbon for a longer period, serving the most pressing need of current in situ remediation technology.
4 Conclusions
The laboratory column analysis designed and arranged in line with the hypothetical packing structure of gate materials indicated a clear variation of response to denitrification due to a matrix effect: groundwater proved more complex to deal with than distilled water. The efficiency of the column set-up was found to be dependent upon the ratio, composition, flow rate and initial concentration of NO3− in the influent. The introduction of limestone into the first, second and third compartments in the column was found to be useful in stabilizing the pH and lowering the NO2− build-up in the system.The two surface characterization techniques employed for the carbonaceous substances (FESEM-EDX and FTIR) indicated a variation in morphological responses between the materials (date seed and wood chips) and within each material before and after the decomposition process. By considering the differences between the holes and cracks on the surface of the materials before and after decomposition, it was deduced that wood chips were more susceptible to decomposition than date seeds. The EDX results and FESEM analysis suggested that the percentage of carbon loss in wood chips after decomposition was three times higher than that lost in date seed decomposition. The FTIR analysis of the used wood chips indicated more reduction changes, affirming the susceptibility of the wood to consumption by microbes, and hence, it was more prone to decomposition than date seed.
The above observations tallied with the results of the study on the rate of decomposition, as the respective half-lives of 2, 4.5 and 12 years were deduced for 1 g of wood chips, 1 g of date seed and 0.37 g of date cover, respectively. The lifetime of the date seed could then be deduced to be 24 years. Under weathering conditions, date seeds assure a constant supply of carbon for a longer period, serving the most pressing need of current in situ remediation technology. It could be further deduced that the date seeds would last as much as six times as long as wood chips before complete degradation. Finally, the double exponential model was found to fit the degradation of date seeds better than the single exponential model in expressing the decay rate.
It could therefore be concluded that in addition to the successful remediation capacity of the multi-layered sequential treatment barrier, the physical and morphological analysis obtained from the surface characterization techniques revealed a preferential consumption of one carbon source over another. This preferential consumption by the degrading microorganisms would surely cause delay in the degradation process and hence increase the lifespan of the gate materials. With a lifespan that is as much as six times longer than that of the wood chips, date seed has the potential to replace the preferred wood chip in the remediation industry.
It is recommended that more effort be put into the utilization of biodegradable seeds with higher carbon content in PRB gate materials. This is because the seeds with high lignin content are an environmental liability, consuming energy and resources for their disposal. It is also recommended that the described composition and order of placement be utilized in the field for the long-term treatment of pollutants.
Conflicts of interest
There are no conflicts to declare.Acknowledgements
This work was supported by the University of Malaya under Postgraduate Research Fund PPP Grant PG083-2015A.References
- F. Bouraoui and B. Grizzetti, Sci. Total Environ., 2014, 468, 1267–1277 CrossRef PubMed.
- D. H. Phillips, Desalination, 2009, 248, 352–359 CrossRef CAS.
- T. C. Z. Z. W. Zhen, Chin. J. Environ. Eng., 2010, 11, 005 Search PubMed.
- P. Hatzinger and J. Diebold, In situ bioremediation of perchlorate in groundwater, Environmental Security Technology Programm, Shaw Environmental, Inc., Lawrenceville, NJ 08648, 2009 Search PubMed.
- G. X. Huang, Y. Y. Huang, H. Y. Hu, F. Liu, Y. Zhang and R. W. Deng, Chemosphere, 2015, 130, 8–16 CrossRef CAS PubMed.
- R. A. Sedivy, J. M. Shafer and L. C. Bilbrey, Ground Water Monit. Rem., 1999, 19, 125–133 CrossRef.
- M. M. Scherer, S. Richter, R. L. Valentine and P. J. Alvarez, Crit. Rev. Microbiol., 2000, 26, 221–264 CrossRef CAS PubMed.
- X. Yang, S. Wang and L. Zhou, Bioresour. Technol., 2012, 104, 65–72 CrossRef CAS PubMed.
- M. Gomez, J. González-López and E. Hontoria-Garcıa, J. Hazard. Mater., 2000, 80, 69–80 CrossRef CAS PubMed.
- L. A. Schipper and M. Vojvodić-Vuković, Ecol. Eng., 2000, 14, 269–278 CrossRef.
- W. Robertson, D. Blowes, C. Ptacek and J. Cherry, Groundwater, 2000, 38, 689–695 CrossRef CAS.
- S. F. Korom, Water Resour. Res., 1992, 28(6), 1657–1668 CrossRef CAS.
- L. A. Schipper, W. D. Robertson, A. J. Gold, D. B. Jaynes and S. C. Cameron, Ecol. Eng., 2010, 36, 1532–1543 CrossRef.
- D. O'Connor, D. Hou, Y. S. Ok, Y. Song, A. Sarmah, X. Li and F. M. Tack, J. Controlled Release, 2018, 283, 200–213 CrossRef PubMed.
- R. W. Gillham and S. F. O'Hannesin, Groundwater, 1994, 32, 958–967 CrossRef CAS.
- M. Dahiru, N. K. A. Bakar, I. Yusoff and M. Ladan, Mal. J. Fund. Appl. Sci., 2017, 13, 732–736 CrossRef.
- D. A. DeMason, R. Sexton, M. Gorman and J. Reid, Protoplasma, 1985, 126, 159–167 CrossRef CAS.
- S. Sallon, E. Solowey, Y. Cohen, R. Korchinsky, M. Egli, I. Woodhatch, O. Simchoni and M. Kislev, Science, 2008, 320, 1464 CrossRef CAS PubMed.
- D. Enning, H. Venzlaff, J. Garrelfs, H. T. Dinh, V. Meyer, K. Mayrhofer, A. W. Hassel, M. Stratmann and F. Widdel, Environ. Microbiol., 2012, 14, 1772–1787 CrossRef CAS PubMed.
- M. Enio, J. Shamshuddin, C. Fauziah and M. Husni, Am. J. Agric. Biol. Sci., 2011, 6, 393–402 CrossRef.
- I. Roslan, J. Shamshuddin, C. Fauziah and A. Anuar, Catena, 2010, 83, 55–63 CrossRef CAS.
- Z. Feleke, K. Araki, Y. Sakakibara, T. Watanabe and M. Kuroda, Water Res., 1998, 32, 2728–2734 CrossRef CAS.
- M. ŠImek and J. Cooper, Eur. J. Soil Sci., 2002, 53, 345–354 CrossRef.
- R. K. Wider and G. E. Lang, Ecology, 1982, 63, 1636–1642 CrossRef.
- R. H. Fisher, D. C. Coleman, D. A. Crossley and P. F. Hendrix, Fundamentals of Soil Ecology, Elsevier Academic Press, 200 Wheeler Road, Burlington, MA 01803, USA; 525 B Street, Suite 1900, San Diego, CA 92101-4495, USA, 2004 Search PubMed.
- J. Mackensen, J. Bauhus and E. Webber, Aust. J. Bot., 2003, 51, 27–37 CrossRef.
- C. Kurz-Besson, M.-M. Coûteaux, J. M. Thiéry, B. Berg and J. Remacle, Soil Biol. Biochem., 2005, 37, 2315–2318 CrossRef CAS.
- T. G. Ibrahim, A. Goutelle, M. G. Healy, R. Brennan, P. Tuohy, J. Humphreys, G. Lanigan, J. Brechignac and O. Fenton, Water, Air, Soil Pollut., 2015, 226, 1–11 CAS.
- N. Jamaludin, S. M. Sham and S. N. S. Ismail, Am. J. Appl. Sci., 2013, 10, 442 CrossRef CAS.
- J. Van Rijn, Y. Tal and H. J. Schreier, Aquacult. Eng., 2006, 34(3), 364–376 CrossRef.
- G. X. Huang, F. Liu, Y. Z. Yang, W. Deng, S. P. Li, Y. Y. Huang and X. K. Kong, J. Environ. Manage., 2015, 154, 1–7 CrossRef CAS PubMed.
- C. A. J. Appelo and D. Postma, Geochemistry, groundwater and pollution, CRC press, Singapore, 2nd edn, 2004 Search PubMed.
- C. Glass and J. Silverstein, Water Res., 1998, 32, 831–839 CrossRef CAS.
- E. M. Baggs, C. L. Smales and E. J. Bateman, Biol. Fertil. Soils, 2010, 46, 793–805 CrossRef CAS.
- J. M. Tiedje, Biology of anaerobic microorganisms, 1988, vol. 717, pp. 179–244 Search PubMed.
- G. Ruiz, D. Jeison, O. Rubilar, G. Ciudad and R. Chamy, Bioresour. Technol., 2006, 97(2), 330–335 CrossRef CAS PubMed.
- A. Koenig and L. Liu, J. Biotechnol., 2002, 99, 161–171 CrossRef CAS PubMed.
- T. C. Zhang and D. G. Lampe, Water Res., 1999, 33, 599–608 CrossRef CAS.
- G. Ruiz, D. Jeison and R. Chamy, Water Res., 2003, 37, 1371–1377 CrossRef CAS PubMed.
- M. Danish, R. Hashim, M. M. Ibrahim and O. Sulaiman, Biomass Bioenergy, 2014, 61, 167–178 CrossRef CAS.
- S. Devshony, E. Eteshola and A. Shani, J. Am. Oil Chem. Soc., 1992, 69, 595–597 CrossRef CAS.
- A. Enoki, S. Itakura and H. Tanaka, J. Biotechnol., 1997, 53, 265–272 CrossRef CAS.
- S. Besbes, C. Blecker, C. Deroanne, N.-E. Drira and H. Attia, Food Chem., 2004, 84, 577–584 CrossRef CAS.
- A. Özcan, A. S. Özcan, S. Tunali, T. Akar and I. Kiran, J. Hazard. Mater., 2005, 124, 200–208 CrossRef PubMed.
- H. H. Sait, A. Hussain, A. A. Salema and F. N. Ani, Bioresour. Technol., 2012, 118, 382–389 CrossRef CAS PubMed.
- K. Pandey, J. Appl. Polym. Sci., 1999, 71, 1969–1975 CrossRef CAS.
- F. Ximenes, W. Gardner and A. Cowie, Waste Manage., 2008, 28, 2344–2354 CrossRef CAS PubMed.
| This journal is © The Royal Society of Chemistry 2019 |

