 Open Access Article
Electrocatalytic reduction of low concentration CO2†
Hiromu
Kumagai‡
 ,
Tetsuya
Nishikawa‡
,
Hiroki
Koizumi
,
Taiki
Yatsu
,
Go
Sahara
,
Yasuomi
Yamazaki§
,
Tetsuya
Nishikawa‡
,
Hiroki
Koizumi
,
Taiki
Yatsu
,
Go
Sahara
,
Yasuomi
Yamazaki§
 ,
Yusuke
Tamaki
and
Osamu
Ishitani
 *
*
Department of Chemistry, School of Science, Tokyo Institute of Technology, O-okayama 2-12-1-NE-1, Meguro-ku, Tokyo 152-8550, Japan. E-mail: ishitani@chem.titech.ac.jp
First published on 12th November 2018
Abstract
Utilization of low concentration CO2 contained in the exhaust gases from various industries and thermal power stations without the need for energy-consuming concentration processes should be an important technology for solving global warming and the shortage of fossil resources. Here we report the direct electrocatalytic reduction of low concentration CO2 by a Re(I)-complex catalyst that possesses CO2-capturing ability in the presence of triethanolamine. The reaction rate and faradaic efficiency of CO2 reduction were almost the same when using Ar gas containing 10% CO2 or when using pure CO2 gas, and the selectivity of CO formation was very high (98% at 10% CO2). At a concentration of 1% CO2, the Re(I) complex still behaved as a good electrocatalyst; 94% selectivity of CO formation and 85% faradaic efficiency were achieved, and the rate of CO formation was 67% compared to that when using pure CO2 gas. The electrocatalysis was due to the efficient insertion of CO2 into the Re(I)–O bond in fac-[Re(dmb)(CO)3{OC2H4N(C2H4OH)2}] (dmb = 4,4′-dimethyl-2,2′-bipyridine).
Introduction
Efforts to solve global warming problems caused by the increasing CO2 concentration in the atmosphere have focused on carbon capture and storage (CCS). However, the depletion of fossil resources as energy sources and as chemical raw materials is another extended problem. Both of these serious problems have the same origin; there are no practical methods to utilize the large volumes of CO2 produced in daily life and industrially, as a main carbon source. However, in nature, photosynthesis uses the low concentration of CO2 in the atmosphere as the carbon source to produce high-energy organic materials using sunlight as an energy source. The electrocatalytic reduction of CO2 has been widely investigated,1–5 but most of these reports targeted pure CO2 despite the fact that exhaust gases from heavy industries only contain low concentrations of CO2; for example, 3–13% in the case of fire power plants.6 Although condensation technologies of low concentration CO2 can be achieved by using amines,7,8 MOFs,9–13 and filters,14 these processes consume extra energy. To the best of our knowledge, the electrocatalytic reduction of CO2 at low concentration has not been reported yet.There are several reports of metal complexes being used to fix low concentration CO2. Orchin et al. determined that CO2 insertion into the Mn–O bond of fac-[Mn(CO)3(P–P)(OEt)] (P–P: diphenylphosphino ethane) to generate fac-[Mn(CO)3(P–P){OC(O)OEt}] was possible using pure CO2 gas as well as air.15 Umakoshi et al. reported the formation of a methyl carbonate complex from [Ru(CNC)(bpy)(OMe)](PF6) (CNC: 2,6-bis(tert-butylimidazol-2-ylidene)pyridine) in ambient air.16
Recently, we reported the CO2-capturing ability of a Re(I) complex with deprotonated triethanolamine as a monodentate ligand, i.e., fac-[Re(bpy)(CO)3{OC2H4N(C2H4OH)2}] (bpy = 2,2′-bipyridine), to react with CO2, giving the aminoethylcarbonato complex fac-[Re(bpy) (CO)3{OC(O)OC2H4N(C2H4OH)2}] (Scheme 1).17 Since this equilibrium reaction has a large equilibrium constant (K = 1.7 × 10³ M−1), fac-[Re(bpy)(CO)3{OC2H4N(C2H4OH)2}] can efficiently capture low concentration CO2. 93% of the Re complex can be converted to the aminoethylcarbonato complex by bubbling Ar gas containing only 10% CO2 through the solution containing the Re complex.
In addition, Re(I) diimine carbonyl complexes having a fac-[Re(N^N) (CO)3X] structure are well-known catalysts for CO2 reduction in electrochemical systems.18–24 By combining these catalytic and CO2-capturing properties, the construction of a catalytic system, which can directly utilize low concentration CO2 as a substrate for CO2 reduction could be expected.
Herein, we report the electrochemical reduction of low concentration CO2 with high selectivity, high faradaic efficiency, and good durability using a Re(I) mononuclear complex with CO2-capturing ability.
Results and discussion
First, we confirmed the ability of the Re(I) complex to capture CO2 to form the aminoethylcarbonato complex in co-existence with a supporting electrolyte (Et4NBF4) for electrochemical reactions (Scheme 2). The fac-[Re(dmb)(CO)3(MeCN)]+ (Re-MeCN+: dmb = 4,4′-dimethyl-bpy) complex was selected as a starting complex, which can be converted to the ligand substituted complex fac-[Re(dmb)(CO)3(DMF)]+ (Re-DMF+: DMF = N,N′-dimethylformamide) by dissolving in a DMF solution containing Et4NBF4 (0.1 M), due to the lower stability of the isolated Re-DMF+. Part of this DMF complex was converted into a complex with a deprotonated triethanolamine ligand, i.e., fac-[Re(dmb)(CO)3{OC2H4N(C2H4OH)2}] (Re-TEOA) by adding triethanolamine (TEOA) to the DMF solution (DMF![[thin space (1/6-em)]](https://www.rsc.org/images/entities/char_2009.gif) :
:![[thin space (1/6-em)]](https://www.rsc.org/images/entities/char_2009.gif) TEOA = 5
TEOA = 5![[thin space (1/6-em)]](https://www.rsc.org/images/entities/char_2009.gif) :
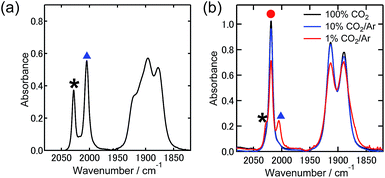
:![[thin space (1/6-em)]](https://www.rsc.org/images/entities/char_2009.gif) 1 v/v). Fig. 1(a) shows the stretching vibrational bands of the CO ligands of Re-DMF+ (νCO = 2028 cm−1, 1921 cm−1, and 1910 cm−1) and Re-TEOA (νCO = 2005 cm−1, 1895 cm−1, and 1878 cm−1) in the mixed solution under an Ar atmosphere. The ratio of Re-DMF+ and Re-TEOA was calculated to be 1
1 v/v). Fig. 1(a) shows the stretching vibrational bands of the CO ligands of Re-DMF+ (νCO = 2028 cm−1, 1921 cm−1, and 1910 cm−1) and Re-TEOA (νCO = 2005 cm−1, 1895 cm−1, and 1878 cm−1) in the mixed solution under an Ar atmosphere. The ratio of Re-DMF+ and Re-TEOA was calculated to be 1![[thin space (1/6-em)]](https://www.rsc.org/images/entities/char_2009.gif) :
:![[thin space (1/6-em)]](https://www.rsc.org/images/entities/char_2009.gif) 2.4 by curve fitting and changed according to the concentration of TEOA; therefore, this ligand substitution reaction is in equilibrium (eqn (1)).
2.4 by curve fitting and changed according to the concentration of TEOA; therefore, this ligand substitution reaction is in equilibrium (eqn (1)).| Re-DMF+ + 2TEOA ⇄ Re-TEOA + TEOA-H+ + DMF | (1) |
On introducing pure CO2 into the solution (bubbling for 1 min), all the νCO bands of Re-DMF+ and Re-TEOA disappeared and a set of three new peaks appeared at νCO = 2019 cm−1, 1913 cm−1, and 1890 cm−1. Fig. 1(b) shows the νCO bands in Ar containing various concentrations of CO2. This clearly indicates that CO2 insertion into the Re–O bond is also in equilibrium (eqn (2)).
| Re-TEOA + CO2 ⇄ Re-CO2TEOA | (2) |
Analysis of these data using eqn (1) and (2) supplied the equilibrium constants of both reactions as K1 = (6.4 ± 0.2) × 10−2 in eqn 1 and K2 = (1.6 ± 0.1) × 103 M−1 in eqn (2). This clearly shows that Re-TEOA has high CO2 capturing ability even in the presence of 0.1 M Et4NBF4. We note that a similar value (K2= (1.8 ± 0.1) × 103 M−1) was obtained in the absence of the electrolyte. Table 1 summarizes the distribution of the proportions of these complexes under 1% and 10% CO2 atmospheres. Notably, 67% of the Re(I) complex existed as Re-CO2TEOA even under a 1% CO2 atmosphere (curve-fittings are shown in Fig. S1†), where the solution contains only 2.2 mM CO2 while the saturating concentration of CO2 is 0.14 M.25 Thus, we can assume that the CO2 capturing property of Re-TEOA is applicable to the electrochemical reduction of low concentration CO2.
![[thin space (1/6-em)]](https://www.rsc.org/images/entities/char_2009.gif) :
:![[thin space (1/6-em)]](https://www.rsc.org/images/entities/char_2009.gif) 1 v/v) solution containing 0.1 M Et4NBF4 after purging with Ar containing various concentrations of CO2
1 v/v) solution containing 0.1 M Et4NBF4 after purging with Ar containing various concentrations of CO2
| Re-DMF+ | Re-TEOA | Re-CO2TEOA | |
|---|---|---|---|
| 100% CO2 | Trace | Trace | >99% |
| 10% CO2 | 3% | 3% | 94% |
| 1% CO2 | 15% | 18% | 67% |
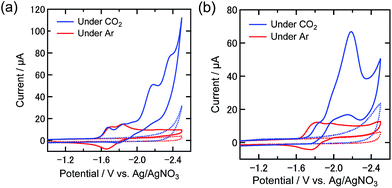
Fig. 2 shows the cyclic voltammograms (CVs) of the Re(I) complex(es) in DMF and in a DMF–TEOA (5![[thin space (1/6-em)]](https://www.rsc.org/images/entities/char_2009.gif) :
:![[thin space (1/6-em)]](https://www.rsc.org/images/entities/char_2009.gif) 1 v/v) mixed solution containing the electrolyte, which were measured both under an Ar and a CO2 atmosphere. Under an Ar atmosphere, the CV of Re-DMF+ in DMF shows a chemically quasi-reversible reduction wave (E1/2 = −1.66 V) attributed to an electron injection into the π* orbital of the diimine ligand of Re-DMF+, and a subsequent irreversible reduction wave at Ep = −1.8 V, which is attributed to the reduction of the metal center Re(+/0)19 (Fig. 2(a), further details in the ESI (Fig. S2(a)†). Under a CO2 atmosphere, Re-DMF+ shows a catalytic current at a more negative potential than the second reduction wave.
1 v/v) mixed solution containing the electrolyte, which were measured both under an Ar and a CO2 atmosphere. Under an Ar atmosphere, the CV of Re-DMF+ in DMF shows a chemically quasi-reversible reduction wave (E1/2 = −1.66 V) attributed to an electron injection into the π* orbital of the diimine ligand of Re-DMF+, and a subsequent irreversible reduction wave at Ep = −1.8 V, which is attributed to the reduction of the metal center Re(+/0)19 (Fig. 2(a), further details in the ESI (Fig. S2(a)†). Under a CO2 atmosphere, Re-DMF+ shows a catalytic current at a more negative potential than the second reduction wave.
In the DMF–TEOA mixed solution, both Re-DMF+ and Re-TEOA are present under an Ar atmosphere, as described above. Certainly, the CV of this solution showed a broader “first” reduction wave at E = −1.6 to −1.9 V (Fig. 2(b), and a detailed CV in Fig. S2(b)†), which should contain two reduction waves, one from each Re complex; the reduction potential of Re-TEOA should be more negative than that of Re-DMF+ because of the charge difference. Conversely, under a CO2 atmosphere, the onset potential of the first reduction wave was shifted by about 70 mV to a more negative value (Ep = −1.8 V) because the Re complexes should be converted to Re-CO2TEOA which has no charge. The cathodic catalytic wave was obtained when the sweeping potential was slightly negative of the first reduction wave. It should be noted that the onset potential of this catalytic wave (E ∼ −1.82 V) was almost the same as in the case for Re-DMF+ in the CO2-purged DMF solution (Fig. 2(a)).
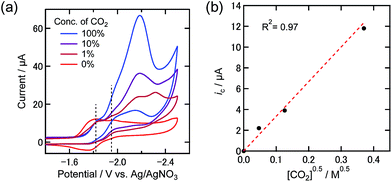
The catalytic current decreased at lower concentrations of CO2 as shown in Fig. 3(a). In the case of 1% CO2, the “first” reduction wave was slightly different compared to the other two cases. This reduction could also be caused by the presence of Re-DMF+ in addition to Re-CO2TEOA and Re-TEOA. Fig. 3(b) shows the relationship between the catalytic current at −1.95 V and the square root of the dissolved CO2 concentration. This good linearity suggests that the diffusion of CO2 as a substrate is a rate-determining step in the electrochemical reaction at −1.95 V.26 In contrast, the current at −1.82 V was almost independent of the concentration of CO2. This suggests that the rate-determining step of the electrochemical reaction occurring at this potential is not dependent on the concentration of CO2. From these results we decided to quantitate the products from bulk electrolysis at −1.82 V under 100%, 10%, and 1% CO2 atmospheres.
An H-shaped electrolytic cell, in which the reduction and oxidation chambers are partitioned by a proton exchange membrane, was used for the electrocatalytic reaction (Fig. S3†). A DMF–TEOA (5![[thin space (1/6-em)]](https://www.rsc.org/images/entities/char_2009.gif) :
:![[thin space (1/6-em)]](https://www.rsc.org/images/entities/char_2009.gif) 1 v/v) solution containing a 0.5 mM Re(I) complex and Et4NBF4 (0.1 M) as an electrolyte was added to the cathodic chamber, while the solution for the anodic chamber contained the electrolyte and tetrabutylammonium acetate (TBAOAc) as an electron donor. A potential of −1.82 V vs. the Ag/AgNO3 (10 mM) reference electrode was applied to a carbon mesh working electrode for 24 h, while bubbling with Ar gas containing various concentrations of CO2. Fig. 4(a) shows the time courses of the electrolysis products under 100% CO2 in a solution in which most of the Re(I) complex was converted to Re-CO2TEOA. A substantially stable reductive current of about 1.3 mA was observed for 24 h (Fig. S4(a)†), and CO was produced as the main reduction product with very small amounts of H2 and HCOOH as byproducts. The faradaic efficiency (η) of each product was ηCO = 87%, ηH2 = 2% and ηHCOOH = 1%. The turnover number for the formation of CO (TONCO) was 12.4 after the 24 h electrolysis and the speed of CO formation did not slow down during the electrolysis.
1 v/v) solution containing a 0.5 mM Re(I) complex and Et4NBF4 (0.1 M) as an electrolyte was added to the cathodic chamber, while the solution for the anodic chamber contained the electrolyte and tetrabutylammonium acetate (TBAOAc) as an electron donor. A potential of −1.82 V vs. the Ag/AgNO3 (10 mM) reference electrode was applied to a carbon mesh working electrode for 24 h, while bubbling with Ar gas containing various concentrations of CO2. Fig. 4(a) shows the time courses of the electrolysis products under 100% CO2 in a solution in which most of the Re(I) complex was converted to Re-CO2TEOA. A substantially stable reductive current of about 1.3 mA was observed for 24 h (Fig. S4(a)†), and CO was produced as the main reduction product with very small amounts of H2 and HCOOH as byproducts. The faradaic efficiency (η) of each product was ηCO = 87%, ηH2 = 2% and ηHCOOH = 1%. The turnover number for the formation of CO (TONCO) was 12.4 after the 24 h electrolysis and the speed of CO formation did not slow down during the electrolysis.
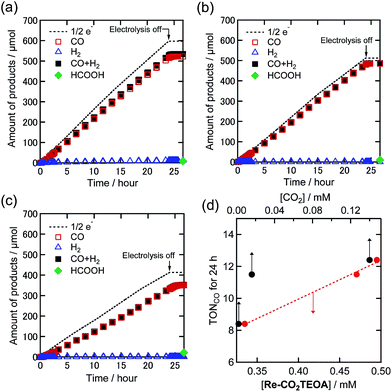 | ||
| Fig. 4 Time courses of the generation of CO (red square), H2 (blue triangle), and formic acid (green diamond) with half of the electrons flowing (dotted line) during bulk electrolysis using the Re(I) catalyst (0.5 mM) at −1.82 V in a DMF–TEOA solution containing Et4NBF4 (0.1 M) under (a) 100%, (b) 10%, and (c) 1% CO2 atmospheres (10 mL min−1). Total amounts of CO and H2 are also indicated by black squares. (d) The relationships of TONCO for a 24 h reaction with the concentrations of Re-CO2TEOA in the solution (red circle) and CO2 (black circle). Corresponding time courses of the current during bulk electrolysis are shown in Fig. S4.† | ||
Fig. 4(b) and (c) show the time courses of the electrolysis products under 10% and 1% CO2, respectively. Under 10% CO2 where 91% of the Re(I) complex exists as Re-CO2TEOA, the Re(I) complex still maintained excellent catalytic activity similar to that under 100% CO2 (ηCO = 95%, TONCO = 11.5, and selectivity of CO formation = 98% after 24 h electrolysis). Even when the concentration of CO2 was lowered to only 1%, a stable reduction current and the corresponding catalytic CO generation were observed with a high faradaic efficiency (ηCO = 85%). The TONCO was 8.4 after 24 h electrolysis, which was lower than under 10% and 100% CO2 atmospheres. Notably, the dissolved CO2 concentrations in the DMF–TEOA mixed solution using 10% and 1% CO2 were 16 mM and 2.2 mM, respectively, which are much lower than under a 100% CO2 atmosphere (140 mM).17,25 It is noteworthy that TEOA cannot accumulate CO2 although diethanolamine and ethanolamine can capture CO2 giving carbamate (R1R2NCOOH).8 However, the electrocatalytic CO2 reduction by using the Re(I) complex proceeded to generate CO selectively, and the generation rate was maintained at 93% for 10% CO2 and at 67% for 1% CO2 compared to that for 100% CO2. Fig. 4(d) shows the relationship between the TONCO after 24 h electrolysis and the concentration of Re-CO2TEOA (red) and the concentration of CO2 (black) in the reaction solution. The concentration of Re-CO2TEOA indicates a good linearity with the TONCO, while the concentration of dissolved CO2 did not show such a good correlation. These results strongly suggest that Re-CO2TEOA electrocatalyzed the CO2 reduction through the reduction of CO2 captured by the complex.
Additionally, the electrolysis at −1.76 V under 10% CO2 was conducted to confirm the onset of the reduction of low concentration CO2. Fig. 5(a) and (b) display the magnified CV of the Re complex under 10% CO2 in the DMF–TEOA mixed solution and the time courses of the electrolysis products at −1.76 V under 10% CO2, respectively. Even at a more positive potential in the first reduction wave, a highly selective and catalytic reaction proceeded (ηCO = 84%, TONCO = 4.1, and selectivity of CO formation = 98% after 24 h electrolysis). This concludes that Re-CO2TEOA efficiently electrocatalyzes CO2 reduction to produce CO with high selectivity even at its first reduction potential under low concentration of CO2.
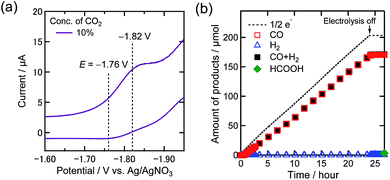 | ||
Fig. 5 (a) CV of the Re(I) complex (0.5 mM) in a DMF–TEOA mixed solution (5![[thin space (1/6-em)]](https://www.rsc.org/images/entities/char_2009.gif) : :![[thin space (1/6-em)]](https://www.rsc.org/images/entities/char_2009.gif) 1 v/v) containing Et4NBF4 (0.1 M) under a 10% CO2 atmosphere. Measurement conditions were the same as those in Fig. 3. (b) Time courses of the generation of CO (red square), H2 (blue triangle), and formic acid (green diamond) with half of the electrons flowing (dotted line) during bulk electrolysis using the Re(I) catalyst (0.5 mM) at −1.76 V in a DMF–TEOA solution containing Et4NBF4 (0.1 M) under a 10% CO2 atmosphere (10 mL min−1). 1 v/v) containing Et4NBF4 (0.1 M) under a 10% CO2 atmosphere. Measurement conditions were the same as those in Fig. 3. (b) Time courses of the generation of CO (red square), H2 (blue triangle), and formic acid (green diamond) with half of the electrons flowing (dotted line) during bulk electrolysis using the Re(I) catalyst (0.5 mM) at −1.76 V in a DMF–TEOA solution containing Et4NBF4 (0.1 M) under a 10% CO2 atmosphere (10 mL min−1). | ||
To investigate the role of TEOA, electrocatalytic CO2 reduction was carried out in a DMF solution containing Re-DMF+ and Et4NBF4 as the electrolyte in the absence of TEOA under 100% CO2 and 1% CO2 atmospheres. The applied potential was −1.82 V vs. Ag/AgNO3 which corresponds to the second reduction wave of Re-DMF+ (Fig. 2(a)). Fig. 6 shows the time courses of the generation of the products. Under the 100% CO2 atmosphere, the observed current in the initial stage was greater than that in the presence of TEOA; 4.6 mA was observed (1.5 mA in the presence of TEOA) because the two-electron reduction of Re-DMF+ proceeded (Fig. S5(a)†). However, it drastically decreased during the first 60 min, and became 0.27 mA after 24 h electrolysis with the corresponding selective CO production (Fig. 6(a)). The faradaic efficiency of CO was 51%, which was much lower than that in the presence of TEOA. Although the Re-DMF+ has three CO ligands, the TON of the CO formation was less than three. It is noteworthy that the saturated concentration of CO2 in DMF (0.20 M) was higher than that in the DMF–TEOA (5![[thin space (1/6-em)]](https://www.rsc.org/images/entities/char_2009.gif) :
:![[thin space (1/6-em)]](https://www.rsc.org/images/entities/char_2009.gif) 1 v/v) mixed solution.27 Under the 1% CO2 atmosphere, the faradaic efficiency of CO formation was very low even in the initial stage of the electrolysis (Fig. 6(b) and S5(b)†). The TON for CO formation was 0.6 after electrolysis for 24 h. The CV and FT-IR spectrum measured after the electrolysis (Fig. S6†) clearly indicate that most of the Re complex had decomposed to electrochemically inactive species. In a nutshell, Re-DMF+ did not work as an electrocatalyst under these reaction conditions. From these results, we can conclude that the electrocatalytic reduction of low concentration CO2 does not proceed in DMF in the absence of TEOA.
1 v/v) mixed solution.27 Under the 1% CO2 atmosphere, the faradaic efficiency of CO formation was very low even in the initial stage of the electrolysis (Fig. 6(b) and S5(b)†). The TON for CO formation was 0.6 after electrolysis for 24 h. The CV and FT-IR spectrum measured after the electrolysis (Fig. S6†) clearly indicate that most of the Re complex had decomposed to electrochemically inactive species. In a nutshell, Re-DMF+ did not work as an electrocatalyst under these reaction conditions. From these results, we can conclude that the electrocatalytic reduction of low concentration CO2 does not proceed in DMF in the absence of TEOA.
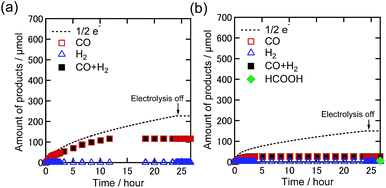 | ||
| Fig. 6 Time courses of the generation of CO (red square), H2 (blue triangle), sum of CO and H2 (black-filled square), and formic acid (green diamond) with half of the electrons flowing (dotted line) during bulk electrolysis using Re-DMF+ (0.5 mM) at −1.82 V in a DMF solution containing Et4NBF4 (0.1 M) under (a) 100% and (b) 1% CO2 atmospheres (10 mL min−1). Corresponding time courses of the current during bulk electrolysis are shown in Fig. S5.† | ||
It has been reported that the addition of a proton source to the reaction solution sometimes accelerates the electrocatalytic CO2 reduction because the protons work as O2− receptors from the two-electron reduced CO2 (eqn (3)).28,29
| 2CO2 + 2e− + H+→ CO + HCO3− | (3) |
Since in the current system there is a possibility that the reduction of low concentration CO2 could proceed due to the effect of the hydroxy protons of TEOA, the addition of tri(n-propyl) ammonium tetrafluoroborate (TPAHBF4) as a proton source into the reaction solution instead of TEOA was investigated. Since alcohols possibly form a corresponding CO2 adduct complex by coordinating to the Re complex, TPAHBF4 which itself and the deprotonated form of which have low coordinating ability to the Re center was used as a proton source. The IR spectrum did not change on adding TPAHBF4 (25 mM) to a DMF solution containing Re-DMF+ (5.0 mM) and Et4NBF4 (0.1 M) under an Ar atmosphere (Fig. S7†), suggesting that the Re(I) complex does not undergo a ligand substitution reaction with TPAHBF4.
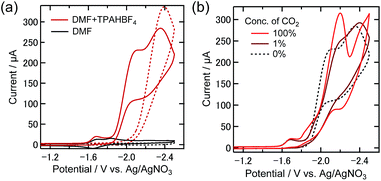
From the CV of the DMF solution containing TPAHBF4 (25 mM) and 0.5 mM Re-DMF+ under an Ar atmosphere, an irreversible reduction wave around −1.6 V and a following large catalytic reduction wave starting from around −1.9 V were observed (Fig. 7(a)). The reduction current near −1.9 V could be assigned to the catalytic generation of H2 catalyzed by the reductive derivatives from Re-DMF+. Two-electron reduction of Re-DMF+ should eliminate the DMF ligand, and it would react with a proton to generate fac-[Re(dmb)(CO)3H] (Re-H), which reacts with another proton producing H2. Fig. 7(b) shows the CVs of the same solution in the presence of 1% and 100% CO2, where the CV measured under the Ar atmosphere is also shown. Under the 100% CO2 atmosphere, the first reduction wave around −1.6 V showed no obvious change regardless of the existence of CO2, while a new reduction wave was observed between −1.8 V and −2 V. Under the 1% CO2 atmosphere, on the other hand, the CV was similar to that measured under the Ar atmosphere, especially at potentials more positive than −1.9 V.
We conducted bulk electrolysis experiments of the DMF solutions containing TPAHBF4 (25 mM) and 0.5 mM Re-DMF+ at EBE = −1.82 V vs. Ag/AgNO3 under 100% CO2 and 1% CO2 atmospheres. Fig. 8 shows the time courses of product generation during electrolysis. In the case of the 100% CO2 atmosphere, CO was mainly produced with ηCO = 64% and TONCO = 16.3 after 24 h electrolysis (Fig. 8(a)), indicating the progress of the electrocatalytic reduction of CO2. The faradaic efficiencies of H2 and HCOOH were ηH2 = 1% and ηHCOOH = 17%, respectively (TONH2 = 0.2, TONHCOOH = 4.4). Under the 1% CO2 atmosphere, on the other hand, no CO production was observed, while catalytic amounts of H2 (TONH2 = 6.1, ηH2 = 35%) and HCOOH (TONHCOOH = 6.1, ηHCOOH = 27%) were produced (Fig. 8(b)). These results clearly indicate that although the proton source accelerates CO2 reduction at a high concentration of CO2, it does not assist CO formation via reduction of low concentration CO2. It is interesting that formate was catalytically produced even by using the Re complex as a catalyst because most of the reported electrocatalytic systems using Re(I) complexes as catalysts selectively produced CO but not the formate species even in the presence of proton sources.30–32 It should be considered that only pure CO2 was used in these reports.
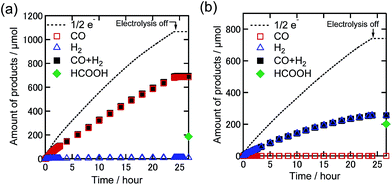 | ||
| Fig. 8 Time courses of the generated CO (red square), H2 (blue triangle), sum of CO and H2 (black-filled square), and formic acid (green diamond) with half of the electrons flowing (dotted line) during bulk electrolysis using Re-DMF+ (0.5 mM) at −1.82 V in the DMF solution containing Et4NBF4 (0.1 M) and TPAHBF4 (25 mM) under (a) 100% and (b) 1% CO2 atmospheres (10 mL min−1). Corresponding time courses of the current during bulk electrolysis are shown in Fig. S8.† | ||
Table 2 summarizes the bulk electrolysis results. The electrocatalysis of the Re complexes strongly depended on the reaction conditions as described above. Under 100% CO2, the catalytic formation of CO was the main reaction (entries 1, 5 and 7), and the co-existence of the proton source, i.e., TEOA or TPAHBF4, accelerated the rates of CO formation (entries 1 and 7). At low concentrations of CO2 (entries 3, 6 and 8), the presence of TEOA in the reaction solution was essential for CO formation. Even at a more positive potential (E = −1.76 V) in the first reduction wave, a highly selective catalytic reaction proceeded (entry 4). It should be noted that the proton source did not positively affect the CO formation in the 1% CO2 atmosphere. These results also clearly indicate that the CO2 capturing ability of Re-TEOA to yield Re-CO2TEOA is essential for the reduction of low concentration CO2.
| Additive | Conc. of CO2/% | Consumed electrons/μmol | Products/μmol (TON based on the Re complex) | Faradaic efficiency/% | |||||
|---|---|---|---|---|---|---|---|---|---|
| CO | H2 | HCOOH | CO | H2 | HCOOH | ||||
| a Solutions containing the Re complex (0.5 mM) and Et4NBF4 (0.1 M) under EBE = −1.82 V vs. Ag/AgNO3 for 24 h. b Electrolysis under EBE = −1.76 V vs. Ag/AgNO3 for 24 h. n.d.: not detected. | |||||||||
| 1 | TEOA | 100 | 1195 | 522 (12.4) | 11.9 (0.28) | 8 (0.2) | 87 | 2.0 | 1 |
| 2 | TEOA | 10 | 1025 | 485 (11.5) | 1.2 (0.03) | 10 (0.2) | 95 | 0.2 | 2 |
| 3 | TEOA | 1 | 826 | 351 (8.4) | 0.8 (0.02) | 21 (0.5) | 85 | 0.2 | 5 |
| 4b | TEOA | 10 | 203 | 170 (4.1) | 0.5 (0.01) | 3 (0.1) | 84 | 0.3 | 2 |
| 5 | — | 100 | 454 | 116 (2.8) | 0.4 (0.01) | n.d. | 51 | 0.2 | ∼0 |
| 6 | — | 1 | 300 | 25 (0.6) | 1.7 (0.04) | 6 (0.1) | 17 | 1.2 | 4 |
| 7 | TPAHBF4 | 100 | 2132 | 685 (16.3) | 9 (0.2) | 186 (4.4) | 64 | 1 | 17 |
| 8 | TPAHBF4 | 1 | 1482 | n.d. | 256 (6.1) | 201 (4.8) | ∼0 | 35 | 27 |
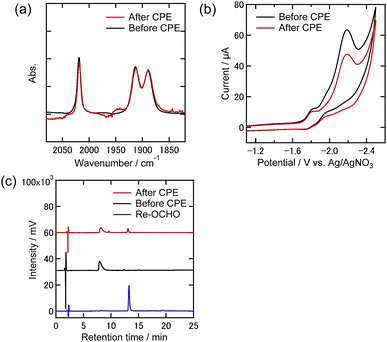
To clarify any changes in the Re complexes during electrolysis, IR spectra, CVs, and liquid chromatograms of the reaction solutions using an ODS column (UHPLC) were recorded before and after the electrolysis. In the case of the DMF–TEOA mixed solution under the 100% CO2 atmosphere, i.e., only Re-CO2TEOA was in solution before electrolysis, no obvious change of the νCO bands in the IR spectrum was observed even after the electrolysis for 24 h (Fig. 9(a)). In the CV, the shape was unchanged and the reduction current attributed to the Re complexes was slightly reduced after electrolysis (Fig. 9(b)). In UHPLC, the main peak attributed to the starting Re complexes was observed, where the axial ligands of Re-CO2TEOA should be substituted by MeOH and/or H2O in the mobile phase of the liquid chromatography (Fig. 9(c)). In addition, a smaller peak attributable to the formate complex (fac-[Re(dmb)(CO)3{OC(O)H}], Re-OCHO) was observed, in 13% conversion yield. 0.9% of the total electrons were consumed in the formation of Re-OCHO, i.e., ηFE = 0.9% since formation of formate from CO2 requires two electrons. Notably, since the νCO bands and the CV of Re-OCHO are very similar to those of Re-CO2TEOA, the UHPLC analyses were required for the detection of Re-OCHO. The same analyses were carried out in the case using 10% CO2 and showed similar results. The starting Re complexes were detected as the main component by UHPLC and Re-OCHO was produced in a 4% yield (ηFE = 0.3%, Fig. S9(c)†). In the case using 1% CO2, on the other hand, the yield of Re-OCHO increased to 24% (ηFE = 2.4%, Fig. 10). It has been reported that formate complexes are formed through electrochemical CO2 reduction using fac-[Re(N^N)(CO)3L] type complexes as catalysts by CO2 insertion into the hydride complexes (fac-[Re(N^N)(CO)3H]) which are two-electron reduction products of the starting Re complexes.33,34 In the present system, the coordinatively unsaturated complex might be generated through the reduction of Re-DMF+ and/or Re-TEOA and might react with a proton to produce Re-H. Since it has also been reported that desorption of HCO2− from the formate complexes via their one-electron reduction proceeded,35 the production of formate in the present electrocatalytic systems may be produced via similar processes. It should be noted that the formation reactions of Re-OCHO and HCOOH are very minor processes in the whole electrolysis. These results clearly show that during electrolysis the Re complexes acted as stable catalysts even under the 1% CO2 atmosphere.
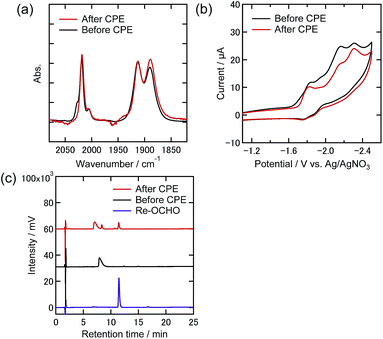 | ||
| Fig. 10 (a) FT-IR spectra, (b) CVs, and (c) UHPLCs of the Re(I) complexes before and after electrolysis at −1.82 V under a 1% CO2 atmosphere in DMF–TEOA containing Et4NBF4 (0.1 M) as the supporting electrolyte (black lines: before electrolysis, red lines: after electrolysis). Measurement conditions were the same as those in Fig. 9. | ||
In the IR spectra recorded just after electrolysis under the 10% CO2 and 1% CO2 atmospheres, Re-TEOA was observed in the ratio of 6% and 18% in all complexes (Fig. S9(a)† and 10(a)), while Re-DMF+ was not. This was also confirmed from their CVs (Fig. S9(b)† and 10(b)). These observations can be explained because the reaction solution should become more basic during electrolysis because the reductive conversion of CO2 to CO leads to the formation of bicarbonate species as well (eqn (3)). This should move the equilibrium between Re-DMF+ and Re-TEOA to the Re-TEOA side. Thus, these results reveal that most of the Re(I) complexes were maintained even after electrolysis at low concentrations of CO2 for 24 h except for the formation of Re-OCHO.
Similar analyses of the electrolyzed solutions containing TPAHBF4 instead of TEOA were conducted (Fig. 11 and 12). Although the CO formation rates were very different between the 100% and 1% CO2 atmospheres as described above (entries 7 and 8 in Table 2), the UHPLC and FT-IR spectra after the electrolysis were similar to each other. In the UHPLC, the peak attributed to Re-OCHO was mainly observed (Fig. 11(b) and 12(b)). The conversion yields based on the Re-DMF+ used were 73% (100% CO2) and 64% (1% CO2), respectively. The FT-IR results also supported that most of the Re-DMF+ was converted to Re-OCHO; only the peaks attributed to Re-OCHO were observed at vCO = 2017 cm−1, 1912 cm−1, and 1888 cm−1. Therefore, it was concluded that Re-DMF+ was converted to Re-OCHO during electrolysis in the presence of TPAHBF4. These results also suggest that Re-H was generated as an intermediate during electrolysis and insertion of CO2 into the Re-H bond gave Re-OCHO. It is noteworthy that, even under the 1% CO2 atmosphere, the Re-DMF+ was converted in good yield and HCOOH was catalytically produced (TONHCOOH = 4.8 after 24 h electrolysis). Therefore, the electrochemical formation of formate from a low concentration of CO2 by the Re complexes is possible.
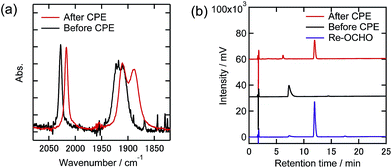 | ||
| Fig. 11 (a) FT-IR spectra and (b) UHPLCs of the Re(I) complexes before and after electrolysis at −1.82 V with the existence of TPAHBF4 (25 mM) under a 100% CO2 atmosphere in DMF–TEOA containing Et4NBF4 (0.1 M) as the supporting electrolyte (black lines: before electrolysis, red lines: after electrolysis). Measurement conditions were the same as those in Fig. 9. | ||
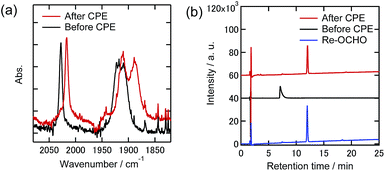 | ||
| Fig. 12 (a) FT-IR spectra and (b) UHPLCs of the Re(I) complexes before and after electrolysis at −1.82 V with the existence of TPAHBF4 (25 mM) under a 1% CO2 atmosphere in DMF–TEOA containing Et4NBF4 (0.1 M) as the supporting electrolyte (black lines: before electrolysis, red lines: after electrolysis). Measurement conditions were the same as those in Fig. 9. | ||
Experimental
Materials
DMF was dried with 4 Å molecular sieves for several days and then distilled under reduced pressure. TEOA was distilled under vacuum. These compounds were stored under an Ar atmosphere before use. The electrolyte, Et4NBF4 was recrystallized from MeCN/ethyl acetate, and then dried under vacuum at 373 K overnight before use. Other reagents and solvents were of commercial grade quality and were used without further purification.Synthesis
fac-Re(dmb)(CO)3Br was synthesized according to a previously reported method.36![[thin space (1/6-em)]](https://www.rsc.org/images/entities/char_2009.gif) :
:![[thin space (1/6-em)]](https://www.rsc.org/images/entities/char_2009.gif) 1 v/v). MeCN was evaporated slowly to precipitate the product as a yellow powder. Yield: 0.771 g (95%). FT-IR (in MeCN) vCO/cm−1: 2040, 1935. ESI-MS (in MeCN): m/z: 496 [M − PF6−]+. Anal. calcd for C17H15N3F6O3PRe: C, 31.88; H, 2.36; N, 6.56. Found: C, 31.60; H, 2.24; N, 6.73. 1H NMR (400 MHz, CD3CN, ppm) δ = 8.83 (d, 2H, J = 5.5 Hz, H6, 6′), 8.33 (br, 2H, H3, 3′), 7.54 (dd, 2H, J = 5.5, 1.0 Hz, H5, 5′), 2.05 (s, 6H, CH3).
1 v/v). MeCN was evaporated slowly to precipitate the product as a yellow powder. Yield: 0.771 g (95%). FT-IR (in MeCN) vCO/cm−1: 2040, 1935. ESI-MS (in MeCN): m/z: 496 [M − PF6−]+. Anal. calcd for C17H15N3F6O3PRe: C, 31.88; H, 2.36; N, 6.56. Found: C, 31.60; H, 2.24; N, 6.73. 1H NMR (400 MHz, CD3CN, ppm) δ = 8.83 (d, 2H, J = 5.5 Hz, H6, 6′), 8.33 (br, 2H, H3, 3′), 7.54 (dd, 2H, J = 5.5, 1.0 Hz, H5, 5′), 2.05 (s, 6H, CH3).
![[thin space (1/6-em)]](https://www.rsc.org/images/entities/char_2009.gif) :
:![[thin space (1/6-em)]](https://www.rsc.org/images/entities/char_2009.gif) 1 v/v, 50 mL) containing fac-[Re(CO)3(dmb)Br] (0.320 g, 0.599 mmol) and NaOCHO (4.01 g, 60.0 mmol) was refluxed overnight under dim light. The solution was slowly evaporated under reduced pressure until all of the EtOH was removed. Extraction with dichloromethane was performed three times. The organic phase was evaporated under reduced pressure. The residual yellow solid was recrystallized from water–acetone, and then dried overnight under vacuum at 333 K. Yield: 0.182 g (61%). FT-IR (in CH2Cl2): vCO/cm−1: 2017, 1912, 1888. 1H NMR (400 MHz, CDCl3, ppm) δ = 8.97 (d, 2H, J = 5.6 Hz, H6, 6′), 8.10 (d, 1H, CHO), 7.95 (br, 2H, H3, 3′), 7.33 (dd, 2H, J = 5.6, 1.2 Hz, H5, 5′), 2.57 (s, 6H, CH3).
1 v/v, 50 mL) containing fac-[Re(CO)3(dmb)Br] (0.320 g, 0.599 mmol) and NaOCHO (4.01 g, 60.0 mmol) was refluxed overnight under dim light. The solution was slowly evaporated under reduced pressure until all of the EtOH was removed. Extraction with dichloromethane was performed three times. The organic phase was evaporated under reduced pressure. The residual yellow solid was recrystallized from water–acetone, and then dried overnight under vacuum at 333 K. Yield: 0.182 g (61%). FT-IR (in CH2Cl2): vCO/cm−1: 2017, 1912, 1888. 1H NMR (400 MHz, CDCl3, ppm) δ = 8.97 (d, 2H, J = 5.6 Hz, H6, 6′), 8.10 (d, 1H, CHO), 7.95 (br, 2H, H3, 3′), 7.33 (dd, 2H, J = 5.6, 1.2 Hz, H5, 5′), 2.57 (s, 6H, CH3).
General procedure
1H NMR spectra were recorded in CDCl3 or CD3CN on a JEOL ECA400-II system at 400 MHz. Transmission IR spectra in CH2Cl2 or the reaction solution were recorded on a JASCO FT/IR-610 or FT/IR-6600 spectrometer at 1 cm−1. Electrospray ionization-mass spectroscopy (ESI-MS) was performed using a Shimadzu LC-MS-2010 A system with MeCN as the mobile phase. Solutions containing 5 mM complexes and 0.1 M Et4NBF4 were prepared for the FT-IR measurements, and a solution containing only 0.1 M Et4NBF4 was used for the background measurements. Ultra high performance chromatograms (UHPLC) of the Re complexes were recorded on a SHIMADZU UHPLC Nexera X2 with an ODS column (Waters Acquity: 150 mm × 2.1 mm i.d.), a Shimadzu DGU-20A degasser, an LC-30AD pump, an SPD-M30A UV-vis photodiode-array detector, and a Rheodyne 7125 injector. The eluent was a 1![[thin space (1/6-em)]](https://www.rsc.org/images/entities/char_2009.gif) :
:![[thin space (1/6-em)]](https://www.rsc.org/images/entities/char_2009.gif) 1 (v/v) mixture of methanol and water containing 0.05 M KH2PO4 (pH 5.9), and the flow rate was 0.2 mL min−1.
1 (v/v) mixture of methanol and water containing 0.05 M KH2PO4 (pH 5.9), and the flow rate was 0.2 mL min−1.
Calculation of equilibrium constants
We conducted preparation procedures of the solutions for the measurements in a glove box (UNICO, UN-650F) combined with a gas circulation dehydration device (DGE-05) under Ar (water content was less than 376 ppm). We obtained concentrations of the complexes in solution, using the peak areas of νCO at the highest wavenumber (2000–2060 cm−1) in the IR spectra. The peak areas for each complex were obtained by curve-fitting using a linear combination of the Gaussian and the Lorentzian functions using the bundled software (JASCO Spectra Manager II Software).25 For the calculation of K1 in eqn (1) (ligand substitution reaction), Re-MeCN+ (10.0 mM) was dissolved in DMF (0.5 mL) and this solution was kept at room temperature in the dark for several hours (>3 h) to convert Re-MeCN+ into Re-DMF+ completely. After adding a DMF solution (0.5 mL) containing TEOA (2.48 M) and Et4NBF4 (0.2 M) to this solution, the mixed solution was kept at room temperature in the dark for 2 h (the concentration of the total Re complex, TEOA and Et4NBF4 is 5.0 mM, 1.26 M and 0.1 M, respectively) and the IR spectra of the equilibrium mixtures Re-MeCN+ and Re-TEOA were measured. The K1 value was calculated using eqn (4) and the obtained concentrations of each Re(I) complex. This experiment was repeated three times, and the average value and the standard deviation were obtained.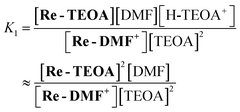 | (4) |
For the calculation of K2 in eqn (2) (CO2-capture reaction), Re-MeCN+ (6.0 mM) was dissolved in DMF (1.0 mL) and this solution was kept at room temperature in the dark for several hours (>3 h). After adding 1.0 mL of a DMF solution containing TEOA (2.52 M) and Et4NBF4 (0.2 M) to this solution, the mixed solution was kept at room temperature in the dark for 2 h (the concentration of the total Re complex, TEOA and Et4NBF4 is 3.0 mM, 1.26 M and 0.1 M respectively at this time). Then, a CO2-saturated DMF solution (30 μL, the CO2 concentration is 0.20 M)27 was added to this mixed solution in a shielded tube (the volume of this tube is 2.0 mL) by using a micro-syringe in a glove box. After keeping at room temperature in the dark for 2 h, the IR spectra were measured. The K2 value was calculated using eqn (5) and the obtained concentrations of each Re(I) complex. This experiment was also repeated three times, and the average value and the standard deviation were obtained.
 | (5) |
Cyclic voltammetry
CV measurements were performed using a typical three electrode configuration with an ALS CHI-760e potentiostat. The experiments were carried out in a vessel containing ca. 5 mL of a sample solution using a glassy carbon disk (diameter = 3 mm) as the working electrode. An Ag/AgNO3 electrode (Ag wire immersed in DMF containing 0.01 M AgNO3 and 0.1 M Et4NBF4, separated from the chamber by vycol® glass) was used as a reference electrode. The platinum wire was employed as a counter electrode.Bulk electrolysis
Bulk electrolysis was carried out in an H-shaped electrochemical cell (Fig. S3†) with a Hokuto Denko HZ-7000 potentiostat using a reticulated vitreous carbon mesh (RVC®, 20 PPI, 2.0 × 2.5 × 0.64 cm3 volume immersed in the solution) as the working electrode. An Ag/AgNO3 electrode (Ag wire immersed in DMF containing 0.01 M AgNO3 and 0.1 M Et4NBF4, separated from the chamber by vycol® glass) was used as a reference electrode. The platinum grid was employed as a counter electrode, which was divided from the cathodic chamber by a Nafion® perfluorinated membrane (Nafion® 324, Aldrich). The reference electrode was placed close to the working electrode so as to minimize the ohmic drop. The working electrode was washed with acetone and dried for 3 h in a vacuum, and then electrochemically pre-reduced at −1.82 V over 3 h in DMF solution containing only the Et4NBF4 electrolyte in the same atmosphere as the desired reaction. The cathodic chamber was filled with an 84 mL portion of the complex solution. The anodic chamber was filled with 84 mL of the DMF–TEOA solution (5![[thin space (1/6-em)]](https://www.rsc.org/images/entities/char_2009.gif) :
:![[thin space (1/6-em)]](https://www.rsc.org/images/entities/char_2009.gif) 1 v/v) which contained the electrolyte and tetrabutylammonium acetate (TBAOAc) as an electron donor. Before measurement, the cathodic chamber had been purged with the gas containing a specific concentration of CO2, while the anodic chamber had been purged with Ar over 1 h. The cathodic chamber of the electrochemical cell was attached to the gas flow system. The gas flow was controlled by a mass flow controller, and the possibility of the effect of back pressure can be negligible since the gas pressure in the upstream was only 0.2 MPa and that in the downstream should be 1 atm, which was released to the ambient pressure. The solution had been continuously bubbled with Ar gas containing various concentrations of CO2 (100%, 10%, 1%, and 0%), and the headspace of the reaction space had been continuously exchanged by the steady rate of the conveyer gas. The gas products (CO and H2) from the reaction space in the vented conveyer gas were detected by using a gas chromatograph (Agilent 490 micro-GC) equipped with a thermal conductivity detector. HCOOH in the liquid phase was detected by Photal CAPI-3300I capillary electrophoresis after each reaction. The amount of the produced HCOOH by the electrolysis was calculated by subtracting the HCOOH amount produced in the control solution from that in the electrolyzed solution. The control solution was kept at room temperature for the same period as the bulk electrolysis. The amounts of formic acid produced in the control solution were much less than those produced by the electrolysis, for example, the produced amount of formic acid by the electrolysis with TPAHBF4 was 186 μmol under 100% CO2 and 201 μmol under 1% CO2 while 0.82 μmol under 100% CO2, and 2.72 μmol under 1% CO2 in the reference solution.
1 v/v) which contained the electrolyte and tetrabutylammonium acetate (TBAOAc) as an electron donor. Before measurement, the cathodic chamber had been purged with the gas containing a specific concentration of CO2, while the anodic chamber had been purged with Ar over 1 h. The cathodic chamber of the electrochemical cell was attached to the gas flow system. The gas flow was controlled by a mass flow controller, and the possibility of the effect of back pressure can be negligible since the gas pressure in the upstream was only 0.2 MPa and that in the downstream should be 1 atm, which was released to the ambient pressure. The solution had been continuously bubbled with Ar gas containing various concentrations of CO2 (100%, 10%, 1%, and 0%), and the headspace of the reaction space had been continuously exchanged by the steady rate of the conveyer gas. The gas products (CO and H2) from the reaction space in the vented conveyer gas were detected by using a gas chromatograph (Agilent 490 micro-GC) equipped with a thermal conductivity detector. HCOOH in the liquid phase was detected by Photal CAPI-3300I capillary electrophoresis after each reaction. The amount of the produced HCOOH by the electrolysis was calculated by subtracting the HCOOH amount produced in the control solution from that in the electrolyzed solution. The control solution was kept at room temperature for the same period as the bulk electrolysis. The amounts of formic acid produced in the control solution were much less than those produced by the electrolysis, for example, the produced amount of formic acid by the electrolysis with TPAHBF4 was 186 μmol under 100% CO2 and 201 μmol under 1% CO2 while 0.82 μmol under 100% CO2, and 2.72 μmol under 1% CO2 in the reference solution.
Conclusions
The electrochemical reduction of low concentration CO2 by using Re(I) complexes as catalysts was systematically investigated. The results clearly show that the CO2 capturing ability of Re-TEOA is very useful for CO formation via the reduction of low concentration CO2, such as 1%. In the absence of TEOA, on the other hand, the Re(I) complexes cannot reduce low concentration CO2 to CO. In the presence of a proton donor which is not an alcohol, the Re(I) complexes cannot work as electrocatalysts for CO formation under low concentration CO2. Under these conditions, however, Re-DMF+ was converted to Re-OCHOvia CO2 insertion into the electrochemically produced Re-H, and formate was catalytically produced even at low concentrations of CO2.Conflicts of interest
There are no conflicts to declare.Acknowledgements
This work was supported by JST CREST Grant Number JPMJCR13L1 in “Molecular Technology”. We acknowledge Prof. Marc Robert (Université Paris Diderot) and Prof. Alain Deronzier (Universite Joseph Fourier) for useful discussion.Notes and references
- E. E. Benson, C. P. Kubiak, A. J. Sathrum and J. M. Smieja, Chem. Soc. Rev., 2009, 38, 89–99 RSC.
- C. D. Windle and R. N. Perutz, Coord. Chem. Rev., 2012, 256, 2562–2570 CrossRef CAS.
- C. Finn, S. Schnittger, L. J. Yellowlees and J. B. Love, Chem. Commun., 2012, 48, 1392–1399 RSC.
- C. Costentin, M. Robert and J. M. Saveant, Chem. Soc. Rev., 2013, 42, 2423–2436 RSC.
- K. A. Grice and C. P. Kubiak, in CO2 Chemistry, eds.M. Aresta and R. van Eldik, Academic Press, 2014, vol. 66, pp. 163–188 Search PubMed.
- G. V. Last and M. T. Schmick, Environ. Earth Sci., 2015, 74, 1189–1198 CrossRef CAS.
- A. B. Rao and E. S. Rubin, Environ. Sci. Technol., 2002, 36, 4467–4475 CrossRef CAS PubMed.
- B. Dutcher, M. Fan and A. G. Russell, ACS Appl. Mater. Interfaces, 2015, 7, 2137–2148 CrossRef CAS PubMed.
- R. Banerjee, A. Phan, B. Wang, C. Knobler, H. Furukawa, M. O'Keeffe and O. M. Yaghi, Science, 2008, 319, 939–943 CrossRef CAS PubMed.
- J. An and N. L. Rosi, J. Am. Chem. Soc., 2010, 132, 5578–5579 CrossRef CAS PubMed.
- G.-P. Hao, W.-C. Li, D. Qian, G.-H. Wang, W.-P. Zhang, T. Zhang, A.-Q. Wang, F. Schüth, H.-J. Bongard and A.-H. Lu, J. Am. Chem. Soc., 2011, 133, 11378–11388 CrossRef CAS PubMed.
- Q. Wang, J. Luo, Z. Zhong and A. Borgna, Energy Environ. Sci., 2011, 4, 42–55 RSC.
- S. Horike, K. Kishida, Y. Watanabe, Y. Inubushi, D. Umeyama, M. Sugimoto, T. Fukushima, M. Inukai and S. Kitagawa, J. Am. Chem. Soc., 2012, 134, 9852–9855 CrossRef CAS PubMed.
- S. D. Kenarsari, D. Yang, G. Jiang, S. Zhang, J. Wang, A. G. Russell, Q. Wei and M. Fan, RSC Adv., 2013, 3, 22739–22773 RSC.
- S. K. Mandal, D. M. Ho and M. Orchin, Organometallics, 1993, 12, 1714–1719 CrossRef CAS.
- Y. Arikawa, T. Nakamura, S. Ogushi, K. Eguchi and K. Umakoshi, Dalton Trans., 2015, 44, 5303–5305 RSC.
- T. Morimoto, T. Nakajima, S. Sawa, R. Nakanishi, D. Imori and O. Ishitani, J. Am. Chem. Soc., 2013, 135, 16825–16828 CrossRef CAS PubMed.
- J. Hawecker, J.-M. Lehn and R. Ziessel, J. Chem. Soc., Chem. Commun., 1984, 328–330 RSC.
- B. P. Sullivan, C. M. Bolinger, D. Conrad, W. J. Vining and T. J. Meyer, J. Chem. Soc., Chem. Commun., 1985, 1414–1416 RSC.
- J. M. Smieja and C. P. Kubiak, Inorg. Chem., 2010, 49, 9283–9289 CrossRef CAS PubMed.
- J. Hawecker, J.-M. Lehn and R. Ziessel, Helv. Chim. Acta, 1986, 69, 1990–2012 CrossRef CAS.
- J. Agarwal, E. Fujita, H. F. Schaefer and J. T. Muckerman, J. Am. Chem. Soc., 2012, 134, 5180–5186 CrossRef CAS PubMed.
- M. D. Sampson, J. D. Froehlich, J. M. Smieja, E. E. Benson, I. D. Sharp and C. P. Kubiak, Energy Environ. Sci., 2013, 6, 3748–3755 RSC.
- A. Nakada and O. Ishitani, ACS Catal., 2017, 8, 354–363 CrossRef.
- T. Nakajima, Y. Tamaki, K. Ueno, E. Kato, T. Nishikawa, K. Ohkubo, Y. Yamazaki, T. Morimoto and O. Ishitani, J. Am. Chem. Soc., 2016, 138, 13818–13821 CrossRef CAS PubMed.
- J. M. Smieja and C. P. Kubiak, Inorg. Chem., 2010, 49, 9283–9289 CrossRef CAS PubMed.
- H. Konno, A. Kobayashi, K. Sakamoto, F. Fagalde, N. E. Katz, H. Saitoh and O. Ishitani, Inorg. Chim. Acta, 2000, 299, 155–163 CrossRef CAS.
- K. Y. Wong, W. H. Chung and C. P. Lau, J. Electroanal. Chem., 1998, 453, 161–169 CrossRef CAS.
- N. P. Liyanage, H. A. Dulaney, A. J. Huckaba, J. W. Jurss and J. H. Delcamp, Inorg. Chem., 2016, 55, 6085–6094 CrossRef CAS PubMed.
- K.-Y. Wong, W.-H. Chung and C.-P. Lau, J. Electroanal. Chem., 1998, 453, 161–170 CrossRef CAS.
- J. M. Smieja, E. E. Benson, B. Kumar, K. A. Grice, C. S. Seu, A. J. M. Miller, J. M. Mayer and C. P. Kubiak, Proc. Natl. Acad. Sci. U. S. A., 2012, 109, 15646–15650 CrossRef CAS PubMed.
- J. A. Keith, K. A. Grice, C. P. Kubiak and E. A. Carter, J. Am. Chem. Soc., 2013, 135, 15823–15829 CrossRef CAS PubMed.
- B. P. Sullivan and T. J. Meyer, J. Chem. Soc., Chem. Commun., 1984, 1244–1245 RSC.
- B. P. Sullivan and T. J. Meyer, Organometallics, 1986, 5, 1500–1502 CrossRef CAS.
- F. P. A. Johnson, M. W. George, F. Hartl and J. J. Turner, Organometallics, 1996, 15, 3374–3387 CrossRef CAS.
- C. Bruckmeier, M. W. Lehenmeier, R. Reithmeier, B. Rieger, J. Herranz and C. Kavakli, Dalton Trans., 2012, 41, 5026–5037 RSC.
Footnotes |
| † Electronic supplementary information (ESI) available: Curve fitting of the FT-IR spectrum under 1% CO2 in DMF–TEOA, detailed cyclic voltammograms of the Re(I) complex, picture of the setup for the bulk electrolysis, time courses of current in the bulk electrolysis, results of the analysis (FT-IR, CVs, and UHPLCs) after electrolysis for experiments under 1% CO2 in DMF and under 10% CO2 in DMF–TEOA, and FT-IR spectra of the Re complex before and after adding TPAHBF4. See DOI: 10.1039/c8sc04124e |
| ‡ These authors contributed equally to this work. |
| § Present address: Faculty of Science and Technology, Department of Materials and Life Science, Seikei University, 3-3-1 Kichijojikitamachi, Musashino, Tokyo, 180-8633, Japan. |
| This journal is © The Royal Society of Chemistry 2019 |


