 Open Access Article
Creative Commons Attribution 3.0 Unported Licence
Developing design tools for introducing and tuning structural order in ionic liquids†
Olivier
Renier
 a,
Guillaume
Bousrez
 a,
Mei
Yang
b,
Milena
Hölter
b,
Bert
Mallick
b,
Volodymyr
Smetana
 a and
Anja-Verena
Mudring
 *ab
*ab
aPhysical Materials Chemistry, Department of Materials and Environmental Chemistry, Stockholm University, Svante Arrhenius väg 16c, 10691 Stockholm, Sweden. E-mail: anja-verena.mudring@mmk.su.se
bAnorganische Chemie III – Materials Engineering and Characterization, Fakultät für Chemie and Biochemie, Ruhr-Universität Bochum, 44780, Bochum, Germany
First published on 13th January 2021
Abstract
Ionic liquids (ILs) are receiving growing interest as highly tunable, multifunctional materials. Remarkably for liquids, they tend to display a high level of structural order. This structural order may even lead to the formation of mesophases such as liquid crystals (LCs). Imidazolium compounds are by far the most popular ILs, because they offer a widely versatile platform for property tuning. To investigate what is driving structural order in imidazolium-based ILs a series of asymmetrical 1-dodecyl-2-methyl-3-alkylimidazolium bromides, [C12C1Cnim][Br] with n = 0–12 have been synthesized, fully characterized and their structures and properties compared with the analogous 1-dodecyl-3-alkylimidazolium as well as the 1,2,3-triazolium bromides. The aim is to examine the influence of the replacement of the most acidic 2-H proton on the imidazolium head group by methylation on the properties and structure of ILs. For all compounds, except for compounds with butyl- and hexyl-chains as well as the protonated species, mesophase formation can be observed. Obviously, the simple presence of long alkyl chains such as dodecyl (a design concept frequently put forward in the literature) is not sufficient to support mesophase formation alone. Rather, for the formation of a liquid crystalline phase, a balance between attractive van der Waals forces, hydrogen bonds, and electrostatic interactions is required. Data from temperature-dependent small-angle X-ray scattering (SAXS) and polarizing optical microscopy (POM) suggest three different cation conformations for the studied [C12C1Cnim][Br]: cations with 0 ≤ n ≤ 4 exhibit a near-linear conformation; for 5 ≤ n ≤ 10 a V-shape is adopted, and for n = 11 or 12 a U-shape is found. We demonstrated that the structural possibility for an interdigitation of the long chains is an influential factor for the formation of a mesophase.
Introduction
Imidazolium-based ionic liquids (ILs) have become an extremely popular class of compounds over the past decade due to their unique properties and large number of applications.1–8 ILs are generally defined as salts exhibiting a melting point below 100 °C.9,10 Hydrogen-bonding interactions in these ILs mainly involving the hydrogen atom located on the C2 position of the imidazolium head group, have been found to play an important role in the order of the IL.11–15 They lead to the formation of supramolecular structures, which can be beneficially used in the designed synthesis of new materials. For example, they can be used for templating open-framework materials,16 to allow the morphological control of nanoparticles17 and even for phase control of polymorphic materials.18 These effects rely both on the interaction of the IL ions with each other, leading to the formation of a highly structured solvent where clear segregation of domains occurs,19,20 but also on the interaction of the IL ions with the solutes and nuclei of materials formed in them during synthesis. It is believed that hydrogen-bonding plays an important role in both interactions.21,22 Indeed, it has been observed that altering or blocking possible hydrogen-bonding sites significantly affects the physicochemical properties of the corresponding ILs by inducing drastic changes in the interactions and structures.14,23 In imidazolium ILs, the proton at the C2 position is known to interact strongly with the IL anion through hydrogen bonds.24 The introduction of a methyl group on the C2 position is therefore thought to cause significant property changes of these ILs,23,25 such as an increase in the melting points,26–28 viscosities29 and thermal- or chemical stabilities,26,29,30 along with a decrease in densities31 and polarities.32 Even the chemical reactivity can be affected after C2 methylation.33Mesophase formation was observed for 1-alkyl-3-methylimidazolium bromides when the substituted alkyl chains contained twelve carbon atoms or more.34 A mesophase, like a liquid crystalline phase, is an intermediate between state the perfectly ordered crystalline and the disordered liquid state.35 ILs which are able to form a liquid crystalline phase are also addressed as ionic liquid crystals (ILCs). ILCs combine the self-organization features of liquid crystals and the solvent properties of ILs.36 The importance of ILCs has been realized in diverse applications such as ion-conductive materials, organized media or self-assembled nanostructured materials.36–43 Thus, it is of strong interest to understand how structural order can be introduced into ILs and learn which kind of secondary bonding forces evoke it. It was proposed that van-der-Waals interactions become so strong in 1-alkyl-3-methylimidazolium salts when the alkyl chain reaches twelve carbon atoms that LC formation induced.32 However, aside from van der Waals interactions, hydrogen-bonds have been found to be involved in the formation of liquid crystalline phases.7,44 There is experimental evidence that methylation of the C2 position of an imidazolium cation can decrease or even eliminate the liquid crystallinity.45 However, for 1-hexadecyl-2,3-dimethylimidazolium bromide, a mesophase formation has been reported.46 Thus, increasing the lengths of the alkyl-tails and enhancing van der Waals interactions between the IL cations can outbalance the effect of C2 methylation in imidazolium bromides. So far, no understanding between mesophase formation, i.e. liquid crystallinity, hydrogen-bond ability as well as the influence of van der Waals forces has been reached for ILs,47 and the effect of a change in the H-donor site on the imidazolium ring on the liquid crystalline behaviour is yet to be determined. For this reason, we have prepared a series of 1-dodecyl-2-methyl-3-alkylimidazolium bromides ([C12C1Cnim][Br], n = 0–12) (Scheme 1). The thermal and structural properties are investigated via differential scanning calorimetry (DSC), polarizing optical microscopy (POM), thermogravimetric analysis (TGA), and small angle X-ray scattering (SAXS). The influence of C2 methylation on the physicochemical properties is studied by comparison with their protonated C2 (ref. 44) and triazolium counterparts.48
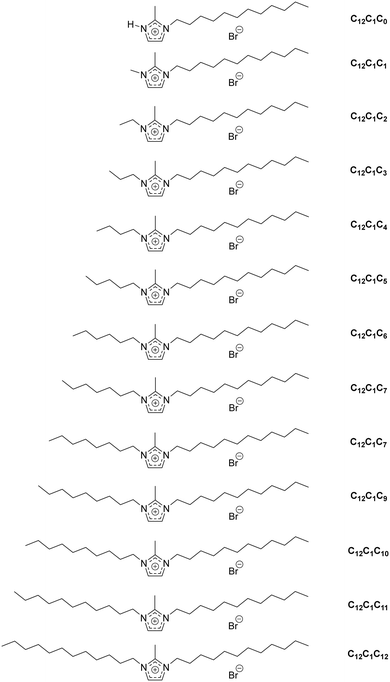 | ||
| Scheme 1 Different types of ionic liquid cations (and acronyms used for identification) under investigation. | ||
For convenience, the same compound naming conventions as in previous reports has been used.7,44 The compounds are named by the number of carbon atoms in the three alkyl chains at the first, second and third positions of the imidazolium ring. For example, [C12C1C5im][Br], 1-dodecyl-2-methyl-3-pentylimidazolium bromide, as C12C1C5 and [C12C1C6im][Br], 1-dodecyl-2-methyl-3-hexylimidazolium bromide, as C12C1C6.
Results and discussion
Synthesis
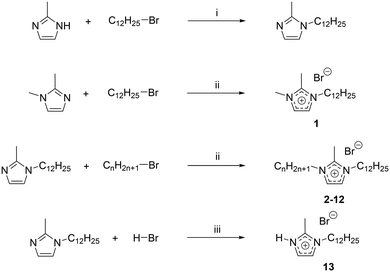
To obtain the different 1-dodecyl-2-methyl-3-alkylimidazolium salts, the respective 2-methylimidazole was reacted with a small excess of dodecylbromide to yield 1-dodecyl-2-methylimidazole (Scheme 2). Because of the lack of commercial availability of methyl bromide, the 1,2-dimethylimidazole has been alkylated at the N-3 position with a small excess of dodecylbromide to obtain 1-dodecyl-2,3-dimethylimidazolium (C12C1C1). Compounds C12C1C2–C12C1C12 were synthesized by alkylation at the N-3 position with the corresponding alkyl bromide. For the synthesis of compound C12C1C0, the protonation of the nitrogen has been realized by addition of hydrobromic acid (HBr) at low temperature.All compounds could be obtained as white crystalline solids apart from C12C1C5 and C12C1C7 which were isolated as extremely viscous oils.
Thermal investigations
To study their thermal behaviour in TGA, DSC, and POM were undertaken. Table 1 lists the decomposition temperatures as recorded by TGA. The decomposition temperatures of all compounds are similar within the error limits of measurement and occur around 265 ± 10 °C. It is remarkable that this series of compounds appears to have a low tendency to take up water, despite having the most hydrogen-bond acceptor and donor sites (due to experimental limitations, it was not possible to transfer the compounds under strictly inert conditions into the thermal analyser. While all samples were handled the same, for some water uptake was observed whilst for others none. See ESI† on the thermal traces). This is an interesting observation as one would expect the hydrophobic character to increase with increasing length of the alkyl chain. Generally speaking, 1,3-dialkylimidazolium ILs exhibit a decomposition temperature higher than that of their analogous triazolium ILs.49| Compound | T decomposition (°C) |
|---|---|
| C 12 C 1 C 0 | 262 |
| C 12 C 1 C 1 | 273 |
| C 12 C 1 C 2 | 266 |
| C 12 C 1 C 3 | 268 |
| C 12 C 1 C 4 | 271 |
| C 12 C 1 C 5 | 269 |
| C 12 C 1 C 6 | 269 |
| C 12 C 1 C 7 | 270 |
| C 12 C 1 C 8 | 266 |
| C 12 C 1 C 9 | 259 |
| C 12 C 1 C 10 | 266 |
| C 12 C 1 C 11 | 264 |
| C 12 C 1 C 12 | 263 |
Phase transitions were studied in greater detail by employing DSC, POM, SAXS and SXRD (for the latter two, vide infra). Initial phase assignments were made based upon characteristic textures observed in the POM micrographs and confirmed by SAXS and SXRD. The complexity and the different sensitivity to water (which changes the phase behaviour by altering the transition temperatures and observed phases including the formation of lyotropic LC phases) does make it difficult to determine the phase behaviour of the studied compounds from one method alone. However, it is the combination of different methods supports the phase assignments made. The transition temperatures (in °C), enthalpies (in J g−1) and phase transition assignments as obtained from DSC measurements are listed in Table S3.† The samples were first cooled at a thermal ramp of 5 °C min−1 to −60 °C without recording thermal data. During sample preparation contact with the atmosphere and some water uptake could not be completely avoided. Both the first full thermal cycle and the second, showing the anhydrous compounds, are reported. All further thermal cycles were identical with the second unless otherwise stated.
For C12C1C1 the first heating from −60 °C reveals four irreversible phase transitions. First, two solid–solid transitions at 53.1 °C (Cr → Cr′) and 67.2 °C (Cr′ → Cr′′) were observed, followed by a crystalline solid–liquid crystalline (Cr′′ → SmA) transition at 77.4 °C. The liquid crystalline phase was assigned to a smectic A phase (ESI† Fig. S89d). The clearing point (SmA → Liso) lies at 148.2 °C. Upon cooling, the transition from isotropic liquid to liquid crystalline (Liso → SmA) is revealed in the cooling scan at 120.5 °C and a liquid crystalline to crystalline phase (SmA → Cr′) at 36.2 °C. It appears that under the given cooling rate only a fraction of the sample crystallized. Upon subsequent heating, cold crystallization can be observed at 27.7 °C (Cr′ → Cr). A comparison of the associated enthalpies shows that indeed cold crystallization at 27.7 °C lead to a full crystallization of the sample before it melts to a LC state at 81.9 °C (Cr → SmA). The clearing point (SmA → Liso) is observed at 120.0 °C. The reverse transition (Liso → SmA) occurs at 120.0 °C upon cooling. At 36.2 °C partial crystallization is observed (SmA → Cr). With more thermal cycles the fraction of material that recrystallizes is increased as becomes evident from the phase transition enthalpies, which are −49.5 J g−1 for the first cooling vs. −54.7 J g−1 for the fifth cooling. At the same time, the crystallization peaks, on cooling become more pronounced and sharp revealing a solid–solid transition close to the point of crystallization. The associated cold crystallization peak observed on heating also shows a split into two. All thermal transitions were fully reproducible from the second cooling cycle onwards. A reason why the first heating deviates from all the subsequent cycles is that there is water uptake during sample preparation in ambient air. Similar thermal behaviour has been observed for [Cnmim]Br·xH2O, (n = 10, 12; x = 0, 1).2 There it was observed that water enlarges the mesophase window by pushing the clearing point to higher temperatures. Evaluation of TG data (ESI†) reveals the presence of ∼1 molecule of H2O per formula unit.
The DSC trace of C12C1C2 reveals a sharp endothermic phase transition at 63.1 °C during the first heating scan. This can be identified as a melting transition (Cr′ → Liso). It is preceded by a solid–solid transition (Cr → Cr′) at −13.6 °C. Upon cooling crystallization can be observed, but via the transition to a metastable LC phase at −3.4 °C. Vitrification (transition from liquid to glass) and devitrification (transition from glass to liquid) occur around −28 °C. The subsequent cycles all exhibit the same transitions. Upon heating, a solid–liquid crystalline transition is observed at 10.5 °C (Cr → SmA) followed by a liquid crystalline–isotropic liquid transition at 65.0 °C (Sm → Liso). It is important to note that several liquid crystalline phases can be seen to compete under the polarizing optical microscope, rendering the identification impossible (ESI,† Fig. S88).
The first heating trace of C12C1C3 reveals that, aside from a glass transition at −35.5 °C, there are two non-reversible transitions around −40 °C and 10 °C. The second transition was in fact identified to be two overlapping transitions of which the first is the transition to a smectic A phase and the second was the clearing point (28.9 °C). The existence of the mesophase was proven by POM measurements at 25 °C, where smectic A phase characteristic texture could be seen. Upon cooling from the isotropic liquid, only a glass transition around −35 °C is observed, which is reversed upon heating at 30.7 °C.
The first heating DSC trace of C12C1C4 exhibits only one endothermic transition. It is observed at 34.6 °C and can be attributed to a solid–liquid transition (Cr → Liso). The cooling trace shows a glass transition at −33.7 °C. Upon subsequent heating devitrification (Tg → Liso) and cold crystallization (Liso → Cr) occur at −27.2 °C and 8.2 °C respectively. The clearing point (Cr → Liso) can then be observed at 35.3 °C. All subsequent thermal cycles are fully reproducible.
Compound C12C1C5 exhibits a cold crystallization from a smectic A phase at −30.1 °C during the first heating, followed by a solid–liquid crystalline transition (Cr → SmA) occurs at 4.8 °C. POM allows identification of the LC phase as a smectic A phase. The clearing point can be found at 51.7 °C. Upon cooling, only a glass transition can be observed at −37.9 °C. All further cycle only exhibited devitrification and vitrification at −27.1 °C and −37.9 °C respectively. From this, it can be concluded that crystallization is kinetically hindered.
Compound C12C1C6 exhibits only one solid–solid transition at −13.1 °C before melting into an isotropic liquid at 38.9 °C. The following thermal cycles reveal, similarly to the previous sample, only a glass transition around −33.0 °C upon cooling and −30.5 °C upon heating.
For compound C12C1C7, a cold recrystallization can be observed upon the first heating at −12.6 °C, followed by melting to a LC phase at −1.0 °C. This transition was then later identified by POM to be a smectic C phase. The final transition is then attributed to a liquid crystalline–isotropic liquid (clearing point) transition. Upon cooling a transition from the isotropic liquid to a smectic C phase is observed at 53.5 °C. A vitrification can then be observed at −33.7 °C which is then reversed upon heating at −28.6 °C. This is then followed by a liquid crystalline–isotropic liquid transition at 52.6 °C, which is reversed upon cooling at 52.2 °C. These processes are then reproducible in all subsequent cycles. Like for C12C1C1 TG analysis shows the presence of about one molecule of water per formula unit. Thus, it is expected that the first heating cycle will look different from the following. Like for C12C1C1, the presence of water moves the clearing point to higher temperatures and enlarges the mesophase window.
Compound C12C1C8 exhibits two processes of which only one was found to be reversible. The first, non-reversible process, is found at 22.3 °C and is attributed to the melting point (Cr → SmC). The reversible transition from liquid crystal to liquid (Sm ![[left over right harpoons]](https://www.rsc.org/images/entities/char_21cb.gif) Liso) can be found at 106.4 °C and the reverse process at 109.0 °C. POM observations confirmed the formation of a liquid crystalline phase which was identified as smectic C phase. This transition is followed by a glass transition at −39.8 °C. The following cycles all exhibit the same behaviour; a glass transition upon heating at −36.0 °C followed by the clearing point (SmC → Liso) at 98.6 °C. The cooling traces then reverse this transition (Liso → Sm) at 100.9 °C and the vitrification occurs at −39.8 °C.
Liso) can be found at 106.4 °C and the reverse process at 109.0 °C. POM observations confirmed the formation of a liquid crystalline phase which was identified as smectic C phase. This transition is followed by a glass transition at −39.8 °C. The following cycles all exhibit the same behaviour; a glass transition upon heating at −36.0 °C followed by the clearing point (SmC → Liso) at 98.6 °C. The cooling traces then reverse this transition (Liso → Sm) at 100.9 °C and the vitrification occurs at −39.8 °C.
The DSC trace for compound C12C1C9 is very similar to the previous compound's trace. The first process can be found at 33.6 °C and comprises two overlapping events, of which the latter was identified by POM as a solid to liquid crystalline transition (Cr → SmC) into a smectic C phase. The clearing point was observed at 122.9 °C. Its reverse transition is observed at 127.9 °C. Vitrification of the smectic C phase can then be observed at −33.3 °C. As for the previous compound, the next traces only exhibit a clearing point at 129.1 °C which is reversed at 127.7 °C, as well as glass transitions around −33 °C. These processes are highly reproducible.
Compound C12C1C10 exhibits a particular thermal behaviour due to being hydrated, as confirmed by TGA and IR-spectroscopy. In fact, during the first heating cycle, four transitions can be observed. The first event can be observed at −41.2 °C and is attributed to a solid–solid transition (Cr → Cr′). A second transition of this type (Cr′ → Cr′′) can then be observed at −16.4 °C. A solid–liquid crystalline phase transition can then be observed at 22.4 °C. The phase was confirmed to be a smectic C phase by POM. The clearing point is observed at 132.9 °C. Upon cooling from the isotropic liquid a smectic C phase forms at 147.7 °C. A glass transition can also be seen at −32.9 °C. The ensuing traces exhibit two transitions that are both reversible. Devitrification and vitrification occur at −31.0 °C and −33.9 °C, respectively. The clearing point (SmC → Liso) is observed at 140.7 °C upon heating and is reversed at 145.7 °C upon cooling.
The first heating cycle for C12C1C11 and C12C1C12 display similar behaviour. In fact, for both compounds, solid–solid transitions (Cr → Cr′) which involve at least for C12C1C11 two solid forms, can be observed preceding a solid–liquid crystalline transition (Cr′ → SmC) involving two LC states which could not be resolved (as indicated by the peak shape) (Fig. S65†) and a clearing point. The first transition is observed at −19.4 °C (C12C1C11) and −24.0 °C (C12C1C12). The next events can be found at 33.2 °C (C12C1C11) and 37.9 °C (C12C1C12). Both compounds exhibit clearing points at 127.6 °C (C12C1C11) and 140.3 °C (C12C1C12). In fact, C12C1C11 exhibits a reversal of its clearing point at 158.4 °C followed by a partial recrystallization at −16.4 °C. C12C1C12 displays a similar behaviour as it reverses its clearing point at 166.6 °C and recrystallizes at −11.8 °C.
The second heating traces of the two compounds differ slightly. C12C1C11 does not display its solid–solid transition any longer and only shows two reversible processes identified as a melting transition at −27.4 °C and a clearing point at 152.8 °C. The transitions are then reversed upon cooling at 158.4 °C and −18.4 °C respectively. These process are then highly reproducible.
C 12 C 1 C 12 on the other hand displays a very similar behaviour as in its first trace, albeit with a lower enthalpy content, pointing to kinetically hindered effects. A solid–solid transition (Cr → Cr′) is found at −18.5 °C followed by a solid–liquid crystalline transition (Cr′ → SmC) at 39.2 °C and a clearing point at 161.5 °C. All transitions are reversible and appear at 165.9 °C (Liso → SmC) and −11.8 °C (SmC → Cr). These processes are then highly reproducible.
Compound C12C1C0 exhibits four events in its first heating cycle. The first at −10.1 °C is attributed to a solid–solid transition (Cr → Cr′), and two additional solid–solid transitions (Cr → Cr′′) at 22.3 °C and (Cr′′ → Cr′′′) at 28.8 °C can be distinguished. The final event at 84.0 °C was identified as a solid–liquid transition (Cr′′′ → Liso). Upon cooling, at 67.0 °C, the clearing point is reversed (Liso → Cr′′′) followed by two solid–solid transitions at 59.7 °C (Cr′′′ → Cr′′) and 41.7 °C (Cr′′ → Cr′). Upon subsequent heating cold crystallization occurs at 24.7 °C before melting at 85.3 °C. Upon cooling the trace follows the first trace.
Compounds C12C1C4, C12C1C6 and C12C1C0 do not form liquid crystalline phases. A similar observation for the 1-dodecyl-3-alkylimidazolium based bromide salts with ethyl- and hexyl-unit was reported.44
For C12C1C0 the melting point is almost the same as for its non-methylated counterpart. However, for a chain length of Cn (n ≥ 8), the opposite is observed. The reason for this increase has previously been attributed to a reduction in entropy.11,23,50 The triazolium analogues seem to exhibit a lower melting point when the chain length is Cn (n ≤ 7) with the exception of C1. Longer chain lengths usually exhibit the highest melting point of all the compounds.
In general, the Sm ⇄ Liso transitions are reversible and can be observed with similar enthalpy values in the cooling scans of each liquid crystalline sample except C12C1C5. In contrast, the Cr → Sm transitions could almost only be observed in the first heating scans and could not be considered reversible. Some materials show a cold crystallization process in the second heating scan preceding the melting transitions (e.g.C12C1C4), whereas in others, no crystallization is observed (e.g.C12C1C3 and C12C1C5). In addition, the enthalpy values of the Cr → Sm transitions in the further heating cycles are significantly lower than the enthalpy values from the first heating cycles, while the enthalpy values for Sm → Liso phase transition do not vary. The previously mentioned observations indicate that the crystallization kinetics are relatively slow and inhibited by the rapid cooling rate. Furthermore, the enthalpy values of Sm → Liso transitions for the liquid crystalline compounds in this series are very similar to those of the liquid crystalline 1-dodecyl-3-alkylimidazolium bromides. In contrast, the enthalpy values of Cr → Sm transitions for the liquid crystalline compounds are significantly higher than for the liquid crystalline 1-dodecyl-3-alkylimidazolium compounds. For example, [C12C12im][Br] undergoes a Cr → Sm transition with an enthalpy ΔH = 26.3 J g−1, whereas C12C1C12 undergoes a Cr → Sm transition with an enthalpy ΔH = 72.31 J g−1. Therein, according to the results obtained from quantum chemical calculations by Hunt,11 the methylation on C2 position inhibits the rotation of the alkyl side chains, which leads to a decreased entropy. In the case of ILs with bromide anions and short alkyl side chains (n = 2–4), no decrease in the enthalpy was observed in the previous report. As already mentioned, for the long-chain containing ILs in the present study, a significant increase in transition enthalpies after the C2 methylation was found. The phase transition temperature is described by the quotient of transition enthalpy and entropy. Therefore, the reduction in the entropy values and the increasing enthalpy values lead to the increase of melting point.10,51
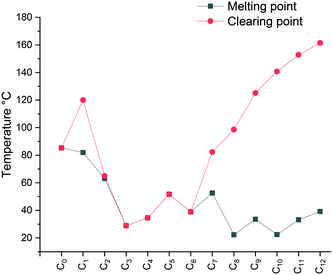
The specific changes in the melting points displayed in Fig. 1 show an inverse relation with the non-methylated compounds. In fact, the melting points are alternating from high to low depending on the parity of the number of carbons within the chain. For the non-methylated compounds, the melting point follows the trend discovered for alkanedicarboxylic acids in which an even number of carbon atoms would always result in a slightly higher melting point.52 The opposite is observed for the methylated compounds. The characteristic changes in the clearing point follow the same trend for our observations of C2 protonated 1-dodecyl-3-alkylimidazolium bromides44 and triazolium bromides.48 The clearing points decrease with increasing n for n = 1–3. For n = 4–6, a slight increase of clearing points can be observed. For n ≥ 7, the clearing points increase rapidly with rising n. Interestingly, 1-dodecyl-2-methyl-3-alkylimidazolium salts have much higher clearing points and therefore wider mesophase temperature ranges than their 1-dodecyl-3-alkylimidazolium bromides and triazolium counterparts (Fig. 2). In fact, for compound C12C1C12, the triazolium bromide and 1,3-didodecylimidazolium exhibit an almost identical clearing point. In general, it is noted that the removal of the most acidic proton on the imidazole (proton on the C2 position) dramatically increases both the melting and clearing point of the salt.
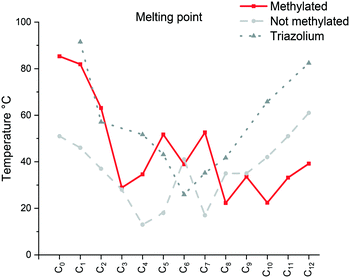 | ||
| Fig. 1 Comparison of the melting point (Cr → Sm/Liso) of the [C12C1CnIm][Br] (methylated), [C12CnIm][Br] (not methylated)42 and [C12CnTr][Br] (1,2,3-triazolium).46 | ||
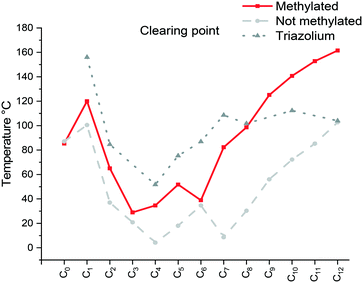 | ||
| Fig. 2 Comparison of the clearing point taken from the 2nd heating (Cr/Sm → Liso) of the [C12C1CnIm][Br] (methylated), [C12CnIm][Br] (non-methylated)42 and [C12CnTr][Br] (Tr = triazolium)46 compounds C12C1C5 and C12C1C6 a problem as only glass transitions observed. | ||
The falling trend indicates structural disorganization by insertion of short alkyl chains into well-ordered dodecyl chains. The short alkyl chain (n ≤ 3) hinders the close packing of molecules, whereas parallel chain packing maximizes the van der Waals forces between the dodecyl chains for C12C1C12. It is well-known that the melting point can also be affected by the degree of interdigitation in the solid-state. A smaller d value in the crystalline state indicates a high extent of alkyl chain interdigitation, which leads to a high melting point. The trend in the melting transitions for 4 ≤ n ≤ 12 confirms this statement. In addition, it has been reported that odd length chains are more likely to adopt an all-trans configuration,53 resulting in a higher melting point for compound C12C1C9 than its immediate neighbours with even lengths of n (Fig. 3).
Crystal structures
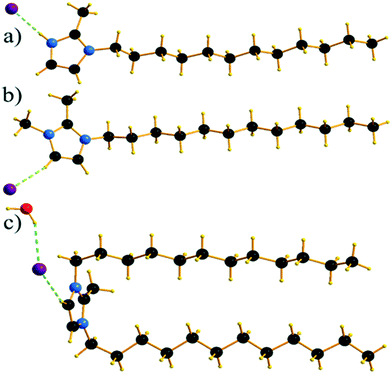
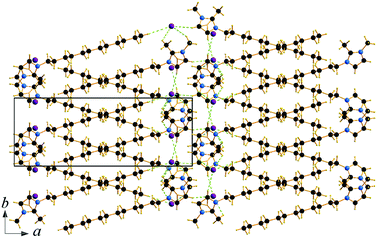
Single crystals of C12C1C1 and C12C1C0 were obtained by recrystallization from ethyl acetate. The monohydrate of C12C1C12, could be crystallized from a dichloromethane solution of the anhydrous compound by isothermal evaporation in air at room temperature. All crystals, as a rule, appeared in the form of thin plates.Compound C12C1C0 crystallizes triclinic (P![[1 with combining macron]](https://www.rsc.org/images/entities/char_0031_0304.gif) , No. 2) and contains two asymmetric units in the unit cell (Fig. 4a). The dodecylalkyl chain of the imidazolium cation adopts an all-trans conformation and forms an angle with the methylimidazolium core plane (defined as the angle between the imidazolium ring centroid and the terminal C atom of alkyl chain) of 152.2°. The chain is not completely straight and shows a slight bow originating from a dihedral angle of 172.0° along C6–C10–C16. The dodecyl tails form parallel hydrophobic stacks with end-to-end packing (i.e. no alkyl chain interdigitation is observed) resulting in bilayer lamellar structure. The imidazolium head groups are parallel to each other, adopting a direct face-to-face conformation (Fig. 4). They tilt with respect to the ab plane, forming a 51.8° angle, while the alkyl chains form a 67.4° angle with the ab plane. The amphiphilic character of the cation results in a separation of polar and non-polar regions in the crystalline packing. The non-polar regions are formed by the alkyl tail groups, held together by van der Waals interactions. The polar parts are constituted of charged methylimidazolium head groups and bromide anions exhibiting rather strong π–π (dCg–Cg = 3.79 Å, offset 1.63 Å) and Br⋯H interactions (Fig. 5). Both of them are responsible for strong intralayer bonding. Each methylimidazolium cation is further linked to bromide anions through non-classical hydrogen bonds. The latter are also observed between the bromide anions and practically all hydrogen atoms on the alkyl chain, though involving different molecules leading to a 3D network. The hydrogen bonds show a distance range of 2.4–3.1 Å (Table 2) where 2.4 Å stands solely for the Br⋯H–N pairs and all others are significantly longer (Fig. 6).
, No. 2) and contains two asymmetric units in the unit cell (Fig. 4a). The dodecylalkyl chain of the imidazolium cation adopts an all-trans conformation and forms an angle with the methylimidazolium core plane (defined as the angle between the imidazolium ring centroid and the terminal C atom of alkyl chain) of 152.2°. The chain is not completely straight and shows a slight bow originating from a dihedral angle of 172.0° along C6–C10–C16. The dodecyl tails form parallel hydrophobic stacks with end-to-end packing (i.e. no alkyl chain interdigitation is observed) resulting in bilayer lamellar structure. The imidazolium head groups are parallel to each other, adopting a direct face-to-face conformation (Fig. 4). They tilt with respect to the ab plane, forming a 51.8° angle, while the alkyl chains form a 67.4° angle with the ab plane. The amphiphilic character of the cation results in a separation of polar and non-polar regions in the crystalline packing. The non-polar regions are formed by the alkyl tail groups, held together by van der Waals interactions. The polar parts are constituted of charged methylimidazolium head groups and bromide anions exhibiting rather strong π–π (dCg–Cg = 3.79 Å, offset 1.63 Å) and Br⋯H interactions (Fig. 5). Both of them are responsible for strong intralayer bonding. Each methylimidazolium cation is further linked to bromide anions through non-classical hydrogen bonds. The latter are also observed between the bromide anions and practically all hydrogen atoms on the alkyl chain, though involving different molecules leading to a 3D network. The hydrogen bonds show a distance range of 2.4–3.1 Å (Table 2) where 2.4 Å stands solely for the Br⋯H–N pairs and all others are significantly longer (Fig. 6).
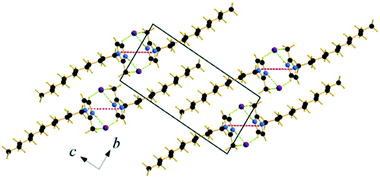 | ||
| Fig. 5 Packing diagram of C12C1C0. Projection on the bc plane. Cg–Cg contacts are shown by red and Br⋯H bonds by green dashed lines. | ||
| D–A/Å | D–H/Å | H⋯A/Å | D–H⋯A/° | |
|---|---|---|---|---|
| C 12 C 1 C 0 | ||||
| N1–H⋯Br | 3.232 | 0.84 | 2.393 | 174.2 |
| C1–H⋯Br | 3.703 | 0.93 | 2.880 | 148.2 |
| C4–H⋯Br | 3.768 | 0.96 | 2.820 | 169.5 |
| C5–H⋯Br | 3.739 | 0.97 | 3.001 | 133.9 |
| C11–H⋯Br | 3.950 | 0.97 | 2.995 | 169.1 |
| C 12 C 1 C 1 | ||||
| C17–H⋯Br | 3.676 | 0.93 | 2.769 | 165.1 |
| C16–H⋯Br | 3.646 | 0.93 | 2.771 | 157.3 |
| C14–H⋯Br | 3.791 | 0.96 | 2.948 | 147.1 |
| C 12 C 1 C 12 ·H2O | ||||
| Ow–H⋯Br | 3.332 | 0.90 | 2.438 | 169.7 |
| Ow–H⋯Br | 3.387 | 0.90 | 2.559 | 154.1 |
| C4–H⋯Br | 3.790 | 0.93 | 2.937 | 153.2 |
| C5–H⋯Br | 3.916 | 0.93 | 2.960 | 168.4 |
| C1–H⋯Br | 3.907 | 0.97 | 2.970 | 165.5 |
| C1–H⋯Br | 3.918 | 0.97 | 2.972 | 169.1 |
| C3–H⋯O | 3.223 | 0.93 | 2.327 | 161.6 |
Compound C12C1C1 crystallizes in the monoclinic space group P21/c (No. 14) with four formula units in the unit cell. The asymmetric unit contains a [C12C1C1im]+ cation and a bromide anion (Fig. 4b). Both the C atoms from the methyl groups and the starting C atom in the dodecyl chain are located in the imidazolium core plane. In contrast to C12C1C0, the dodecyl chains are straight and form interdigitated stacks, while the angle between the dodecyl chain and methylimidazolium plane is slightly reduced – from 152.2° to 144.5°. Interdigitation of the alkyl chains is observed in the (101) plane. The cations stack in such a way that their dodecyl chains alternate orientation in neighbouring layers, hence forming a bilayer structure. When viewed along the crystallographic c-axis, the polar head groups line up in a row, with adjacent alkyl tails tilted in different directions, forming a herringbone-like structure (Fig. 7). The angle between the adjacent alkyl chain planes is ∼32°. Instead of classic π–π interactions between the imidazole cores observed in C12C1C0, C12C1C1 exhibits solely CH–π interactions (dCH–Cg = 3.49, dCg–Cg = 4.47 Å, offset 3.05 Å). Hydrogen bonds are observed between the bromide ion and hydrogen atoms of four neighbouring methylimidazolium head groups as well as a C–H⋯Br interaction at the terminal CH3 group of a dodecyl chain. In contrast to C12C1C0 and perhaps due to the absence of N–H⋯Br interactions, the bonds length distribution is more regular, starting from 2.77 Å, and the role of hydrogen-bonding in this structure is less significant. Non-classical hydrogen-bonds with still reasonable distances can be observed solely with the methyl/methylene groups of the carbon chains. Presumably, hydrogen-bonding could be the main reason why C12C1C1 does not crystallize isostructurally with the analogous 1-dodecyl-3-methyl-1,2,3-triazolium bromide.48 The most distinct difference is that the packing of the alkyl-chains is missing the herringbone structure, but exhibit a packing more similar to 1-dodecyl-3-methylimidazolium bromide monohydrate.1,2 In addition, the steric hindrance caused by the addition of the methyl group hinders the packing into the same arrangements as the triazolium analogue. Both of these structural differences also help in explaining the dissimilarities in their thermal properties. In fact, the triazolium exhibits more interdigitation which promotes a larger liquid crystalline window.
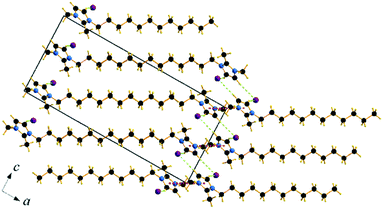 | ||
| Fig. 7 Packing diagram of C12C1C1. Projection on the ac plane. Br⋯H bonds are shown by green dashed lines. | ||
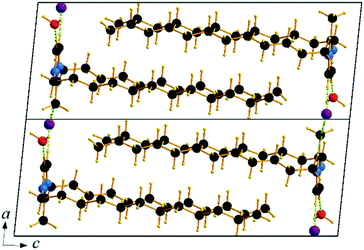
Though the attempts to obtain sufficient quality crystals of the anhydrous C12C1C12 have so far been unsuccessful, both anhydrous and monohydrate [C12C1C12im][Br]·H2O (C12C1C12·H2O) compounds show similar layer distances according to SAXS-measurements, vide infra. Therefore, we believe the anhydrous compound would present similar characteristics in its structure. C12C1C12·H2O crystallizes as colourless thin needle-shaped crystals and in the triclinic space group P![[1 with combining macron]](https://www.rsc.org/images/entities/char_0031_0304.gif) (No. 2) with two formula units in the unit cell. The asymmetric unit contains a [C12C1C12im]+ cation, a bromide anion, and a water molecule (Fig. 4c). An exclusively U-shaped conformation of the cations is observed in the crystal packing. Both N-alkyl chains are approximately orthogonal to the methylimidazolium plane and point in the same direction. The methylimidazolium cores are almost parallel to the ab-plane. The U-shape can be defined by the angles formed around the first C atom of the dodecyl chain, between the N atom from the methylimidazolium ring and the terminal C atom of the dodecyl chain, and are measured as 93.6° and 97.6° for the two dodecyl chains, respectively. Both dodecyl chains adopt an all-trans conformation being almost overlapped in the projection approximately on the ac plane. A slight shift is observed only for the first three carbon positions that gradually decreases and becomes invisible for the fourth one. Such a U-shaped conformation has been previously observed for benzimidazolium halides18 and 1,3-didodecylimidazolium with [N(CN)2]− and [C(CN)3]− as counter ions.54
(No. 2) with two formula units in the unit cell. The asymmetric unit contains a [C12C1C12im]+ cation, a bromide anion, and a water molecule (Fig. 4c). An exclusively U-shaped conformation of the cations is observed in the crystal packing. Both N-alkyl chains are approximately orthogonal to the methylimidazolium plane and point in the same direction. The methylimidazolium cores are almost parallel to the ab-plane. The U-shape can be defined by the angles formed around the first C atom of the dodecyl chain, between the N atom from the methylimidazolium ring and the terminal C atom of the dodecyl chain, and are measured as 93.6° and 97.6° for the two dodecyl chains, respectively. Both dodecyl chains adopt an all-trans conformation being almost overlapped in the projection approximately on the ac plane. A slight shift is observed only for the first three carbon positions that gradually decreases and becomes invisible for the fourth one. Such a U-shaped conformation has been previously observed for benzimidazolium halides18 and 1,3-didodecylimidazolium with [N(CN)2]− and [C(CN)3]− as counter ions.54
The cation head groups are held in a row connected side by side through strong π–π interactions (dCg–Cg = 3.70 Å, offset 1.44 Å) and CH⋯Br hydrogen-bonds, while all the dodecyl chains point in the same direction (Fig. 9). Two rows of cations stack in such a way that their dodecyl chains alternate orientational direction in neighbouring layers, hence forming a bilayer structure. The dodecyl chains interdigitate in rows and are aligned approximately with the crystallographic c-axis (tilt 10.1° from the ab-plane normal). The interdigitated cation stacks form a bilayer with a thickness of 20.5 Å (Fig. 8), which in turn form a lamellar structure. Similarly to C12C1C1, complete separation of hydrophobic and hydrophilic regions can be observed in the crystal packing. While the hydrophobic regions are formed by alkyl chains, the hydrophilic part is now more populated and contains the imidazolium head groups, the bromide anions and water. Cohesion inside the crystal structure is ensured by incorporation of water molecules, as neighbouring cations are held together by CH⋯Br, CH⋯O and additional OH⋯Br interactions (Table 3). Interestingly, as with C12C1C1, C12C1C12·H2O shows distinct differences between analogous 1,3-didodecyl-1,2,3-triazolium bromide.48 Though all carbon chains in both compounds align identically, no interdigitation has been observed in the latter, while the orientation of the triazolium rings allows efficient π–π interactions between and CH–π interactions within the layers that in large extent can be attributed to a less intense hydrogen bond network.
| Compound | d Cr [Å] | d LC [Å] |
|---|---|---|
| a Mesophases coexist and could not be measured. b The liquid crystalline phase exists only in a very small temperature range, no layer spacing could be detected. c The solid phase exists only at low temperature and recrystallization did not occur for this sample. d These compounds exhibit no mesophase. Cr = crystalline state; LC = liquid crystalline state. | ||
| C 12 C 1 C 0 | 16.7 | —d |
| C 12 C 1 C 1 | 22.2 | 27.8 |
| C 12 C 1 C 2 | 30.4 | —a |
| C 12 C 1 C 3 | 27.9 | 28.5 |
| C 12 C 1 C 4 | 26.2 | —b |
| C 12 C 1 C 5 | 21.2 | 23.8 |
| C 12 C 1 C 6 | —c | —d |
| C 12 C 1 C 7 | 24.5 | 21.9 |
| C 12 C 1 C 8 | 23.0 | 22.7 |
| C 12 C 1 C 9 | 24.0 | 22.7 |
| C 12 C 1 C 10 | 25.4 | 23.0 |
| C 12 C 1 C 11 | 19.6 | 23.7 |
| C 12 C 1 C 12 | 20.4 | 24.8 |
Mesophase investigations with POM and SAXS
Mesophase formation was observed for all the compounds except for C12C1C4, C12C1C6 and C12C1C0. The corresponding polarizing optical micrographs for all the liquid crystalline compounds are shown in Fig. S89–S101, ESI.†Focal conic fan textures, Schlieren textures and oily streak textures can be observed. All of these are textures are characteristic of smectic mesophases. For compounds C12C1C9 and C12C1C10, a bluish domain texture without the polarising filter could be observed, changing to violet before melting (Fig. S95 and S96†), which is considered to be indicative of bow-shaped molecules. The layer spacing distances d of all compounds in the crystalline states and the liquid crystalline phases are summarized in Table 3.
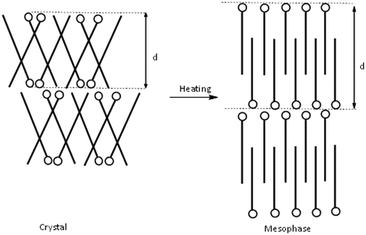
Based on the crystalline structure of C12C1C1 as evidenced by SXRD, the large layer spacing in the crystalline phase could be explained by a model shown schematically in Fig. 9 (left). The molecules form a herringbone-like bilayer arrangement; the polar head groups line up along a row, and the long-chain tails tilt in alternate directions. Upon heating, the long alkyl chains presumably stretch parallel to the normal of the layer plane, resulting in an increased d spacing in agreement with a smectic A phase (Fig. 10, right). According to the SAXS data, smectic A phases also form for compounds C12C1C3–C12C1C5.
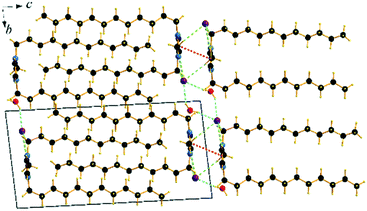 | ||
| Fig. 9 Packing diagrams of C12C1C12·H2O. Projection on the bc plane. Cg–Cg contacts are shown by red and Br⋯H bonds by green and O⋯H by blue dashed lines. | ||
For C12C1C7–C12C1C10, the layer spacings in the mesophases are shorter than the layer spacings in the crystals. This indicates that the structure undergoes a transition to smectic C phase, where the alkyl chains of cations are tilted with respect to the layer normal. An increase in interdigitation could explain the falling trend for the layer spacing d with rising n. A decrease of 5 Å in layer spacing could be observed between C12C1C4 and C12C1C5. The rapid change in the d value indicates a principal geometric change in the molecular conformation. This could be a result of decreasing the angle of the varying alkyl chain tilt with respect to the dodecyl chains. We believe a V-shaped molecule could be formed in this way for C12C1C5–C12C1C10, where the angle between the two alkyl chains at both sides of the 2-methylimidazolium ring remains roughly constant with rising n since the d values in the crystalline state are almost unchanging. The slight increase in the d values could be explained by the insertion of methylene groups. The observation of blue-violet domains in the POM images is also in agreement with our supposition: a presence of a V-shaped structure.
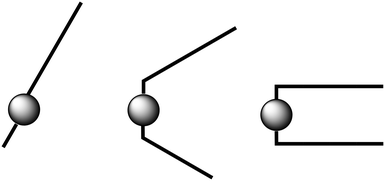
The sudden decrease in layer distances in C12C1C10 and C12C1C11 of approximately 5 Å can be considered to be a molecular conformational change from V-shaped to U-shaped. Single crystal data shows that C12C1C12 arranges itself as interdigitated U-shaped molecules in the solid-state. We could imagine that such U-shaped conformation is already adopted above n = 11. A crude representation of the three shape types supposed for the 1-dodecyl-2-methyl-3-alkylimidazolium cations is shown in Fig. 11.
C 12 C 1 C 11 and C12C1C12 show an increased d value in the mesophase (23.7 Å (C12C1C11) and 24.8 Å (C12C1C12) compared to the crystal phase (19.6 Å (C12C1C11) and 20.4 Å (C12C1C12)). The U-shaped molecules are able to move with respect to one another in the direction of the interdigitated alkyl chains during heating and cooling processes. A smectic A phase can, therefore, be formed by simply decreasing the interdigitated region.
Generally speaking, these findings correspond to the previously reported result on the non-methylated imidazolium analogues.44 The triazolium analogues, on the other hand, present another behaviour as even for longer chain length, the layer spacing in the mesophase appears to be shorter than in its crystalline form.48 For the shorter alkyl chains (C1 and C2), however, all the analogues present the same behaviour; the layer spacing in the liquid crystalline phase is much larger than in the crystal form.
Conclusions
In conclusion, we have prepared a series of 1-dodecyl-2-methyl-3-alkylimidazolium bromides of which the thermal behaviour has been investigated by DSC, POM and SAXS experiments. The main focus was directed at elucidating their thermal behaviour and structure. Furthermore, crystal structures of C12C1C1 and C12C1C12·H2O and C12C1C0 could be obtained. All thirteen compounds could be considered ILs since they exhibit a melting point below 100 °C. For C12C1C4, C12C1C6 and C12C1C0 no thermotropic liquid crystalline behaviour is observed. The absence of mesophase formation for these three compounds was anticipated according to findings for the analogous 1-dodecyl-3-alkylimidazolium bromides. In the previous study, this absence of liquid crystallinity was attributed to the formation of a bilayer structure with an increase in the complexity of interactions between the anion and cation.44 One can assume a similar effect for the three aforementioned compounds. Elimination of liquid crystallinity after methylation at the C2 position has been reported for imidazolium dodecylsulfonate by Mukai et al.45 For LC formation, a balance between attractive van der Waals forces and electrostatic repulsion is required.In comparison with the 1-dodecyl-3-alkylimidazolium salts reported in our previous report, after insertion of the methyl group on the C2 position, an increase of both the melting points and clearing points of all the compounds can be observed in this series. This increase is consistent with the previous report and originates from the reduced entropy.11,23 In addition, C2 methylation induces a decrease in liquid crystallinity for n ≤ 6, but above n ≥ 7 an increase in the mesophase temperature ranges can be observed and with significantly higher clearing points.
The data from SAXS and POM measurements of C12C1Cn compounds suggest three different cation conformations: for n = 0–4, the molecules show near-linear structures; for 5 ≤ n ≤ 10, a V-shaped conformation is postulated; and for n = 11, 12, a U-shaped molecule might be assumed.
The removal of the most acidic proton at the C2 position, by either methylation or substitution by nitrogen, provides researchers with a new way to fine-tune the thermal properties of imidazolium derivatives ILs by controlling their decomposition point, extending their liquid crystalline behaviour and tweaking their melting point.
Conflicts of interest
There are no conflicts to declare.Acknowledgements
This work was supported in part by the German Science Foundation DFG through the priority program 1191 “Ionic Liquids” and the DESY (Deutsches Elektronensynchrotron), proposal no. I-20100011, and the Royal Swedish Academy of Science through the Göran Gustafsson prize in Chemistry and Energimydigheten. We would like to thank Dr. Sergio Funari, for support during the SAXS measurements.References
- A. Getsis and A.-V. Mudring, Acta Crystallogr., Sect. E: Struct. Rep. Online, 2005, 61, 2945–2946 CrossRef.
- A. Getsis and A.-V. Mudring, Cryst. Res. Technol., 2008, 43, 1187–1196 CrossRef CAS.
- S. Tang, A. Babai and A.-V. Mudring, Angew. Chem., Int. Ed., 2008, 47, 7631–7634 CrossRef CAS.
- A. Getsis, B. Balke, C. Felser and A.-V. Mudring, Cryst. Growth Des., 2009, 9, 4429–4437 CrossRef CAS.
- A. Getsis and A.-V. Mudring, Z. Anorg. Allg. Chem., 2010, 636, 1726–1734 CrossRef CAS.
- A. Getsis and A.-V. Mudring, Eur. J. Inorg. Chem., 2011, 2011, 3207–3213 CrossRef CAS.
- M. Yang, B. Mallick and A.-V. Mudring, Cryst. Growth Des., 2013, 13, 3068–3077 CrossRef CAS.
- X. Wang, F. W. Heinemann, M. Yang, B. U. Melcher, M. Fekete, A.-V. Mudring, P. Wasserscheid and K. Meyer, Chem. Commun., 2009, 7405–7407 RSC.
- P. Wasserscheid and T. Welton, Ionic Liquids in Synthesis, Wiley-VCH, Weinheim, 2007 Search PubMed.
- A.-V. Mudring, Aust. J. Chem., 2010, 63, 544–564 CrossRef CAS.
- P. A. Hunt, J. Phys. Chem. B, 2007, 111, 4844–4853 CrossRef CAS.
- A. Mele, G. Romanò, M. Giannone, E. Ragg, G. Fronza, G. Raos and V. Marcon, Angew. Chem., Int. Ed., 2006, 45, 1123–1126 CrossRef CAS.
- K. Fujii, T. Mitsugi, T. Takamuku, T. Yamaguchi, Y. Umebayashi and S. Ishiguro, Chem. Lett., 2009, 38, 340–341 CrossRef CAS.
- K. Fumino, A. Wulf and R. Ludwig, Angew. Chem., Int. Ed., 2008, 47, 8731–8734 CrossRef CAS.
- S. Zahn, G. Bruns, J. Thar and B. Kirchner, Phys. Chem. Chem. Phys., 2008, 10, 6921–6924 RSC.
- G. Wang, M. Valldor, S. Siebeneichler, M. Wilk-Kozubek, V. Smetana and A.-V. Mudring, Inorg. Chem., 2019, 58, 13203–13212 CrossRef CAS.
- P. Ghosh and A.-V. Mudring, Nanoscale, 2016, 8, 8160–8169 RSC.
- K. M. Lee, C. K. Lee and I. J. B. Lin, Chem. Commun., 1997, 899–900 RSC.
- J. N. A. Canongia Lopes and A. A. H. Pádua, J. Phys. Chem. B, 2006, 110, 3330–3335 CrossRef CAS.
- A. Triolo, O. Russina, H.-J. Bleif and E. Di Cola, J. Phys. Chem. B, 2007, 111, 4641–4644 CrossRef CAS.
- L. Crowhurst, P. R. Mawdsley, J. M. Perez-Arlandis, P. A. Salter and T. Welton, Phys. Chem. Chem. Phys., 2003, 5, 2790–2794 RSC.
- H.-C. Chang, J.-C. Jiang, W.-C. Tsai, G.-C. Chen and S. H. Lin, J. Phys. Chem. B, 2006, 110, 3302–3307 CrossRef CAS.
- T. Endo, T. Kato and K. Nishikawa, J. Phys. Chem. B, 2010, 114, 9201–9208 CrossRef CAS.
- C. Hardacre, J. D. Holbrey, S. E. J. McMath, D. T. Bowron and A. K. Soper, J. Chem. Phys., 2002, 118, 273–278 CrossRef.
- E. J. Maginn, J. Phys.: Condens. Matter, 2009, 21, 373101 CrossRef CAS.
- Y. Yoshida, O. Baba, C. Larriba and G. Saito, J. Phys. Chem. B, 2007, 111, 12204–12210 CrossRef CAS.
- J. Zhu, L. Bai, B. Chen and W. Fei, Chem. Eng. J., 2009, 147, 58–62 CrossRef CAS.
- P. Bonhôte, A.-P. Dias, N. Papageorgiou, K. Kalyanasundaram and M. Grätzel, Inorg. Chem., 1996, 35, 1168–1178 CrossRef.
- F. F. C. Bazito, Y. Kawano and R. M. Torresi, Electrochim. Acta, 2007, 52, 6427–6437 CrossRef CAS.
- S. T. Handy and M. Okello, J. Org. Chem., 2005, 70, 1915–1918 CrossRef CAS.
- C. P. Fredlake, J. M. Crosthwaite, D. G. Hert, S. N. V. K. Aki and J. F. Brennecke, J. Chem. Eng. Data, 2004, 49, 954–964 CrossRef CAS.
- P. W. Lohse, R. Bürsing, T. Lenzer and K. Oum, J. Phys. Chem. B, 2008, 112, 3048–3057 CrossRef CAS.
- T. Itoh, Y. Nishimura, N. Ouchi and S. Hayase, J. Mol. Catal. B: Enzym., 2003, 26, 41–45 CrossRef CAS.
- A. E. Bradley, C. Hardacre, J. D. Holbrey, S. Johnston, S. E. J. McMath and M. Nieuwenhuyzen, Chem. Mater., 2002, 14, 629–635 CrossRef CAS.
- K. Binnemans, Chem. Rev., 2005, 105, 4148–4204 CrossRef CAS.
- L. Douce, J.-M. Suisse, D. Guillon and A. Taubert, Liq. Cryst., 2011, 38, 1653–1661 CrossRef CAS.
- M. Yang, P. S. Campbell, C. C. Santini and A.-V. Mudring, Nanoscale, 2014, 6, 3367–3375 RSC.
- M. Yang, K. Stappert and A.-V. Mudring, J. Mater. Chem. C, 2014, 2, 458–473 RSC.
- K. V. Axenov and S. Laschat, Materials, 2011, 4, 206–259 CrossRef CAS.
- A. Taubert, C. Palivan, O. Casse, F. Gozzo and B. Schmitt, J. Phys. Chem. C, 2007, 111, 4077–4082 CrossRef CAS.
- A. Taubert, Angew. Chem., Int. Ed., 2004, 43, 5380–5382 CrossRef CAS.
- A. Taubert, F. Stange, Z. Li, M. Junginger, C. Günter, M. Neumann and A. Friedrich, ACS Appl. Mater. Interfaces, 2012, 4, 791–795 CrossRef CAS.
- P. S. Campbell, M. Yang, D. Pitz, J. Cybinska and A.-V. Mudring, Chem. – Eur. J., 2014, 20, 4704–4712 CrossRef CAS.
- M. Yang, B. Mallick and A.-V. Mudring, Cryst. Growth Des., 2014, 14, 1561–1571 CrossRef CAS.
- T. Mukai, M. Yoshio, T. Kato and H. Ohno, Chem. Lett., 2004, 33, 1630–1631 CrossRef CAS.
- P. H. J. Kouwer and T. M. Swager, J. Am. Chem. Soc., 2007, 129, 14042–14052 CrossRef CAS.
- C. Li, J. He, J. Liu, L. Qian, Z. Yu, Q. Zhang and C. He, J. Colloid Interface Sci., 2010, 349, 224–229 CrossRef CAS.
- K. Stappert and A.-V. Mudring, RSC Adv., 2015, 5, 16886–16896 RSC.
- S. Sanghi, E. Willett, C. Versek, M. Tuominen and E. Bryan Coughlin, RSC Adv., 2012, 2, 848–853 RSC.
- P. Wasserscheid and T. Welton, Ionic Liquids in Synthesis, John Wiley & Sons, 2008 Search PubMed.
- A. Hunt, J. Phys.: Condens. Matter, 1992, 4, L429–L431 CrossRef CAS.
- V. R. Thalladi, M. Nüsse and R. Boese, J. Am. Chem. Soc., 2000, 122, 9227–9236 CrossRef CAS.
- J. D. Holbrey and K. R. Seddon, J. Chem. Soc., Dalton Trans., 1999, 2133–2140 RSC.
- X. Wang, C. S. Vogel, F. W. Heinemann, P. Wasserscheid and K. Meyer, Cryst. Growth Des., 2011, 11, 1974–1988 CrossRef CAS.
Footnote |
| † Electronic supplementary information (ESI) available: Experimental details, instrumentation, SCXRD table, NMR spectra, IR spectra, TGA spectra, DSC traces, SAXS and POM. CCDC 1912603–1912605. For ESI and crystallographic data in CIF or other electronic format see DOI: 10.1039/d0ce01672a |
| This journal is © The Royal Society of Chemistry 2021 |

