Fragmentation dynamics of doubly charged camphor molecule following C 1s Auger decay
Sanket
Sen
 a,
S.
Mandal
b,
Arnab
Sen
b,
R.
Gopal
c,
L.
Ben Ltaief
 d,
S.
Turchini
 e,
D.
Catone
 e,
N.
Zema
e,
M.
Coreno
fg,
R.
Richter
e,
N.
Zema
e,
M.
Coreno
fg,
R.
Richter
 f,
M.
Mudrich
 dh,
S. R.
Krishnan
*h and
V.
Sharma
 *a
*a
aIndian Institute of Technology Hyderabad, Kandi 502285, India. E-mail: vsharma@phy.iith.ac.in
bIndian Institute of Science Education and Research, Pune 411008, India
cTata Institute of Fundamental Research, Hyderabad 500046, India
dAarhus University, 8000 Aarhus C, Denmark
eIstituto di Struttura della Materia - CNR (ISM-CNR), Area di Ricerca di Tor Vergata via del Fosso del Cavaliere, 100, Rome 00133, Italy
fElettra-Sincrotrone Trieste, Basovizza 34149, Italy
gConsiglio Nazionale delle Ricerche - Istituto di Struttura della Materia, Trieste 34149, Italy
hQuCenDiEM - group and Department of Physics, Indian Institute of Technology - Madras, Chennai 600036, India. E-mail: srkrishnan@iitm.ac.in
First published on 25th January 2022
Abstract
The fragmentation dynamics of the gas-phase, doubly charged camphor molecule, formed by Auger decay following carbon 1s ionisation, using soft X-ray synchrotron radiation, is presented in this work. The technique of velocity map imaging combined with a photoelectron–photoion–photoion coincidence (VMI-PEPIPICO) is used for both electron energy and ion momentum (in-sequence) measurements. The experimental study is complemented by molecular dynamics simulation, performed with an NVT (moles, volume, and temperature) ensemble. Velocity Verlet algorithms were used for time integration at various internal energies. These simulations validate observed dissociation pathways. From these, we successfully deduce that the internal energy of the doubly charged molecular ion has a significant contribution to the fragmentation mechanism. Notably, a prominent signature of the internal energy was observed in the experimentally determined energies of the neutral fragment in these deferred charge separation pathways, entailing a more detailed theoretical study to uncover the exact dissociation dynamics.
1 Introduction
The response of a molecule to the excitation of an inner shell electron is pivotal for understanding its interaction with X-ray radiation. Investigating such interactions has profound implications in obtaining insights into processes such as radiation damage in biology and the stability of molecular aggregates like ices in interstellar medium.1,2 When a core-level electron in a molecule is excited, a valence electron fills the core hole resulting in either photoemission or the removal of one or more partner electrons from the system leading to an Auger decay. Auger processes are the dominant multiple ionisation channels in light atoms, even when they are a part of larger aggregates, like molecules.3 Multiple electron emission by processes like Auger cascades or double/triple Auger decay4 can occur, leaving the parent molecule in a higher charged state, with a substantial amount of internal energy. Such a multiply charged system eventually breaks up into smaller ionic and neutral fragments. The dissociation process depends significantly on the internal energy5–9 and its redistribution among the various degrees of freedom of the molecule.10,11 Furthermore, fragmentation is often accompanied by a redistribution of charge density, and rearrangement of the atomic constituents of the molecular system.12,13 These complex dynamics may proceed through more than one fragmentation channel,12,14 especially in large molecules.15Consequently, experimental approaches based on detecting no more than one ion in coincidence with the ejected electrons are inadequate to capture the essentials and the rich physics associated with such inner-shell excited multi-electron processes. In addition to scalar energy measurements, measuring vectorial three-dimensional momenta of fragment ions and their angular separations reveals the details of the processes involved in the fragmentation channel, as noted previously.16–18 Momentum imaging and multiple ion coincidence detection techniques have revealed important aspects of these processes, such as the observation of a Renner-Teller state and multiple fragmentations in CO2,19,20 inner-shell ionisation and fragmentation in intense X-ray pulses in methylselenol and ethylselenol,13,18 details of fragmentation due to multiple charging of N2O by ion-impact collisions21 and dissociation of multiply charged, inner-shell photoionised ICN.22
In the structure of sufficiently large molecules, chirality is an additional feature in isomers, identical in all other respects except being mirror images of each other. Camphor, a naturally occurring molecule, has long served as the prototype to investigate photoexcitation23 and dichroism in such systems. Dichroism in photoelectron emission from valence and core shells has been benchmarked using both photons from synchrotrons24–30 as well as femtosecond laser pulses.31–34 The origin of asymmetry is also well-explained in theoretical studies.35–38 Moreover, dichroism is observed in the photoion emission of other chiral and achiral molecule.39–41 Though the first study42 on the fragmentation of camphor following photoexcitation at the carbon K-edge was using the electron–ion–ion coincidence technique,43–45 some questions, such as how does a dicationic molecule dissociate in kinematically complete scheme? were left unanswered, and hence motivating this study.
In this investigation, we employed a photoelectron–photoion–photoion coincidence (PEPIPICO) spectrometer consisting of a velocity map imaging46 (VMI) and a Time-of-Flight (ToF) setup placed opposite to each other, a VMI-PEPIPICO setup. We investigated the ionisation and fragmentation dynamics of camphor (C10H16O) following carbon K-shell photoexcitation using both experimental and computational methods. In the experiment, photons with energies across the C 1s ionisation energy range of the camphor molecule were employed for both excitation and ionisation. Two sets of experiments were performed in succession; first, we recorded the photoelectron energy spectra on the VMI correlated with the ions on the ToF part and, second, only the start signal was taken from the electrons on the ToF part while 3-D momenta of the ions were measured on the VMI.
Furthermore, with the aid of ionic fragments' 3-D momenta, correlated to the islands where the missing neutral fragment has mass of 28 amu (corresponding to the mass of CO), angular distribution between the fragments and their energy distribution were determined. To comprehend the dissociation dynamics resulting in these islands, molecular dynamics (MD) simulations were performed with a doubly charged camphor molecule deposited with various internal energies, in the GAMESS suite of programs.47 A few experimentally observed islands were associated with the dissociation channels obtained from the simulations. A good match between the computed and experimentally measured results for angular distributions between the ionic fragments were observed. In addition, unique signatures of the internal energy deposited into the molecular ion were observed in the experimentally determined kinetic energies of the neutral fragment (CO), emitted in the first step of the two step (deferred charge separation) fragmentation pathways. This necessitates a more detailed theoretical study to have an extensive understanding of the complex processes that occur during the dissociation. This study, thus, serves as a forerunner to subsequent explorations of the dynamics triggered by the inner-shell photoionisation of this benchmark chiral molecule and other large systems.
2 Methods
2.1 Experimental setup
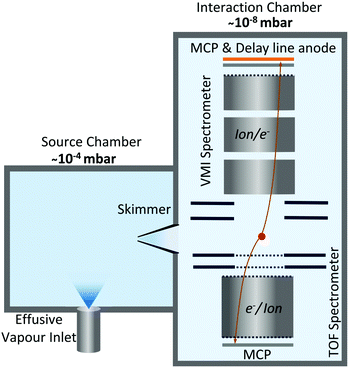
Our investigations were carried out at the Circular Polarisation (CiPo) beamline48 of the Elettra Synchrotron Trieste, Italy. This beamline operates in the photon energy range between 5–1200 eV with two monochromators for different photon energy ranges. Our experiments employed the Spherical Grating Monochromator G3 (range 120–400 eV), capable of an effective resolving power of ∼4 × 10³ for photon energies in the range 280–305 eV relevant to this study.49 Photon energy in this region was calibrated using the well-known energy of the C 1s → π* excitation of CO2.50The details of the experimental setup, shown in Fig. 1, have been presented earlier.51–53 Briefly, the experimental setup consists of two sections: the first is the source chamber where camphor vapour was effused via a dosing valve with a chamber pressure maintained at ∼10−4 mbar. (1S)-(–)-Camphor (purity > 95%) from Sigma-Aldrich was used without further purification. Camphor molecules (effusive) then enter a differentially pumped second chamber, which we call the interaction chamber, through a skimmer. The pressure in this chamber was maintained at ∼10−8 mbar. This chamber houses the spectrometer consisting of a VMI setup and a ToF setup placed opposite to each other, working in tandem. Molecules interact with the focused beam of soft X-ray radiation from the synchrotron at the geometric centre of the chamber, while the plane of linear polarization of the photon beam was perpendicular to the spectrometer axis. As the VMI and ToF spectrometers were operated synchronously, electron–ion coincidence and electron-multi-ion coincidence measurements could be done. For the current investigation, the “start” signal was derived from an electron detection on the VMI/ToF spectrometer, and multiple ion coincidences were recorded on the ToF/VMI spectrometer for electron-VMI (e-VMI) and ion-VMI mode, respectively. This enables us to compute the photoelectron energy spectra, from the set of events (in e-VMI mode) and the complete momenta of the photoions detected from each event in the ion-VMI mode.
2.2 Analysis methods
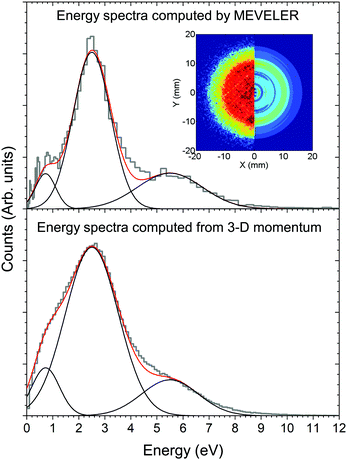
The kinetic energy distribution of the photoelectrons, detected in e-VMI mode, are evaluated using Abel inversion by employing the well-established protocol of the MEVELER54 program. The kinetic energies of the detected electrons are calibrated by referencing to atomic He photo-ionisation, as described earlier.53 The average energy resolution (ΔE/E) of the VMI is ∼7%. The electron energy spectra correlated to a specific ionic fragment detected at the ToF detector can also be measured in this setup.To compute the complete 3-D momentum (px, py, pz) of the ionic fragments detected, in ion-VMI mode, the two position coordinates (X and Y) and the ToF (T) of the fragments from each ionisation event were recorded. Ion hits on the delay-line detector in the VMI spectrometer were referenced to the arrival time of the electron at the detector in the ToF spectrometer, and arrival time differences were used to determine the three momentum components. These components were computed as follows:55,56
| pz = −CqEsΔT |
![[p with combining right harpoon above (vector)]](https://www.rsc.org/images/entities/i_char_0070_20d1.gif) neutral as follows: for n fragments generated in an event, the linear momentum of a neutral fragment which remains undetected in the charged-particle detection scheme can be written as,
neutral as follows: for n fragments generated in an event, the linear momentum of a neutral fragment which remains undetected in the charged-particle detection scheme can be written as,![[p with combining right harpoon above (vector)]](https://www.rsc.org/images/entities/i_char_0070_20d1.gif) neutral = −( neutral = −(![[p with combining right harpoon above (vector)]](https://www.rsc.org/images/entities/i_char_0070_20d1.gif) 1 + 1 + ![[p with combining right harpoon above (vector)]](https://www.rsc.org/images/entities/i_char_0070_20d1.gif) 2 + ⋯ + 2 + ⋯ + ![[p with combining right harpoon above (vector)]](https://www.rsc.org/images/entities/i_char_0070_20d1.gif) n−1) n−1) |
The kinetic energy, KE, of each fragment from every event can be computed from individual ion momenta as,
The distribution of the KER can then be plotted for a particular break-up reaction. This provides insights into probable states accessed by the ionised molecule before breaking into ionic and neutral fragments.
2.3 Computational methods
To elucidate the fragmentation routes of the dicationic camphor molecule, we performed molecular dynamics simulation on the molecular ion using the quantum chemistry package GAMESS.47 In general, in molecular dynamics simulation the molecular system with a specific internal energy is allowed to evolve for a long time for equilibration, and the randomised structure and the velocity distribution of the molecular fragments are estimated as a function of time. In this specific case, we have started from the dicationic state of the (1S)-(−)-Camphor with the optimised geometry of the neutral (1S)-(−)-Camphor under the equilibrium. The geometry optimisation has been performed by a DFT calculation of the B3LYP type exchange–correlation functional using the 6311-G basis set. The convergence threshold of the density matrix is kept at 10−6 during the optimisation. We matched it with the known geometry of the neutral (1S)-(−)-Camphor from earlier studies42,57,58 to validate our geometry optimisation. Usually, the MD simulation is performed with an NVT (moles, volume, and temperature) ensemble and the velocity Verlet algorithm is used for time integration. In this study, the simulation is performed at a time-step of 0.5 fs, and it is continued up to 2000 fs. The internal energy of system was varied over a wide range, as a function of bath temperature (which corresponds to the internal energy deposited in the doubly charged molecular ion), from 500 K to 5000 K in steps of 500 K. A similar approach has been previously used for thiophene,7 and cysteine and serine.8 For the temperatures below 2500 K, no fragmentation is observed for the dicationic (1S)-(−)-Camphor up to 2000 fs. However, for temperatures above this, the molecular ion starts fragmenting into various channels, with dependence on the temperature and a few experimentally observed dissociation channels can be accounted for. For temperatures beyond 5000 K, we have observed extensive fragmentation and several neutral and charged fragments are created, which cannot be identified in our experimental data.3 Results
3.1 Ion yield, mass spectra and photo-electron spectra
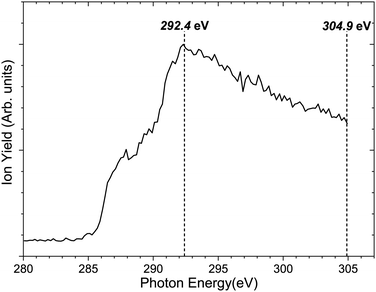
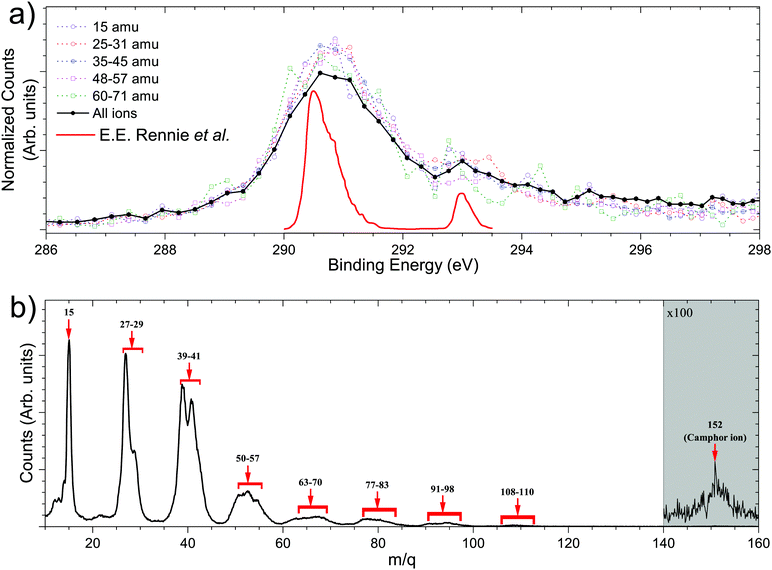
Fig. 3 shows the total ion yield of camphor, around C 1s edge, between photon energies, 280–305 eV, in steps of 0.2 eV with an acquisition period of 20 s per step. This encompasses the C 1s ionisation of camphor, at 293 eV for the carbonyl and around 290.5 eV for the rest of the skeletal C atoms.36,59 In a previous PEPIPICO fragmentation study of camphor, photon energies of 270 eV and 330 eV were used for ionisation.42 To gain a deeper understanding of the fragmentation dynamics of the molecule, we implemented the VMI-PEPIPICO technique at 292.4 eV (having the highest ion yield) for ion-VMI and 304.9 eV for electron-VMI (e-VMI) (where the VMI resolution (ΔE/E) is better at around 7%, as compared to low energy electrons produced by photons of energy 292.4 eV).The C 1s electron ionised by 304.9 eV photon is presented in Fig. 4a. The total electron yield in coincidence is shown by the black curve, while the coloured dotted curves show the electrons corresponding to a particular fragment/group of fragments. The counts are normalised by the total counts (area under the curve) of the PES, between the binding energies of 285 eV and 298 eV. The peak at 293 eV corresponds to carbonyl C atoms and the prominent peak between 290 and 292 eV corresponds to the other C atoms, as has been computed for (1R)-(+)-Camphor by Stener et al. by ADF and B-spline LCAO approach.36 E. E. Rennie et al. observed a sharper peak at 290.5 eV with a shoulder near 291 eV and a second peak at 293 eV, see red curve Fig. 4a.59 Although vibronic coupling generally leads to asymmetry in the peak shape as observed in the case of benzene,60 with the overall resolution of our spectrometer (ΔE/E) at around 7%, that is ∼1 eV at 15 eV, resolving vibrational fine features is beyond the scope of the present experimental data. In addition, two other parameters are to be considered here. First, the C 1s ionisation potentials of the nine C atoms, except the carbonyl C, in camphor has been previously found to be very close to each other (few tenths of eV), both theoretically36 and experimentally.59 Second, even with a much higher experimental resolution (∼90 meV) in the study by E. E. Rennie et al.,59 the peak resulting from ionisation of the carbonyl C 1s electron has a full width at half maximum of ∼300 meV, and is essentially structureless. Broadening of photoelectron spectra normally arises due to various causes like slit width dependent photon bandwidth48 and post collision interaction.61 However, the most dominant reason for broadening in our experiment is the effusive nature of the source giving rise to an elongated ionisation region along the direction of photon propagation and hence leading to a low energy resolution on the VMI spectrometer. In a recent study on avebenzone,15 a variation in the photoelectron spectra corresponding to the fragments/group of fragments has been observed. In our study, however, a similar difference has not been observed. Hence, establishing dependence of fragmentation on the initial site of ionisation (carbonyl C or other C atoms) becomes untenable.
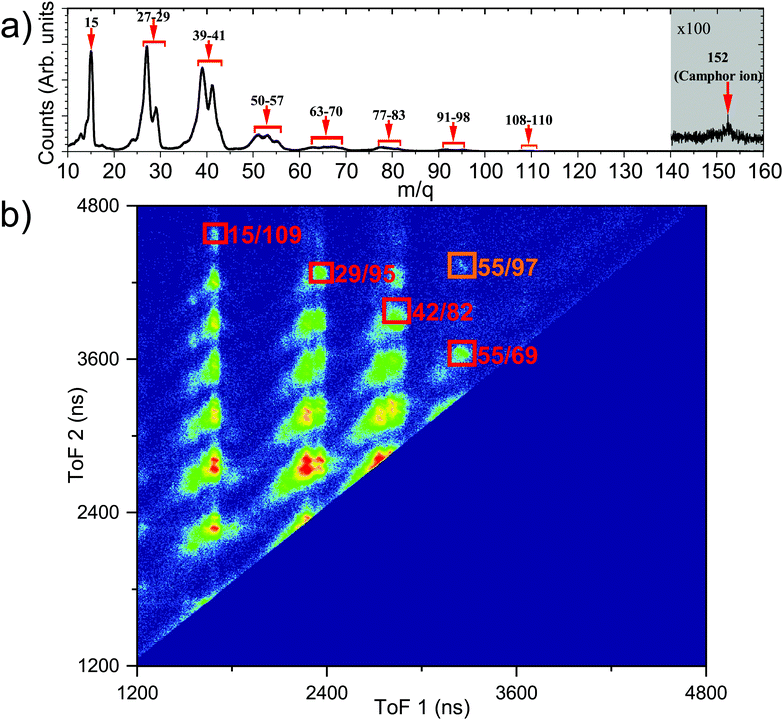
Fig. 4b shows the PEPICO mass spectra with the prominent fragments, following ionisation with a photon energy of 304.9 eV, observed at m/q values of 15, 27, 29, 39, 41, and groups of fragments around 53–55, 67–69, 81–83, 95, 109. We note that the relative ratio of the lighter to heavier fragments produced in near C 1s edge ionisation is different compared to electron impact ionisation.58,62 This is expected for C 1s edge photoionisation as the molecule can undergo double and triple ionisation by highly efficient secondary mechanisms like Auger decay,3 leading to higher fragmentation as observed previously.42 This is further confirmed by the presence of the observed fragments in photoelectron–photoion–photoion coincidences.
3.2 PEPIPICO maps
The ToF mass spectra of camphor ionised by 292.4 eV photon, see Fig. 5a, is comparable with the ToF mass spectra at 304.9 eV (Fig. 4b), with major fragments having a smaller m/q value. At 292.4 eV, the dominant decay process would be different for the carbonyl C and the rest of the C atoms. While, as this energy is below the ionisation potential of the carbonyl C, this leads to resonant Auger decay from highly excited states of the molecule, for the rest of the C atoms normal Auger will be the dominating process. However, as the 1s ionisation would result in very slow electrons, their collection probability would be more efficient than the fast resonant Augers, and hence the ion-ion coincidence data would be dominated by the ionisation of the rest of the C 1s electrons. Auger decay, following the photoionisation predominantly leaves the molecule doubly charged; however, triple ionisation of the molecule is plausible via Auger cascade or double Auger decay. By using the predictive equation of Roos et al.,63 the empirical estimation of the triply ionised state is between 10–16% for C 1s ionisation from all the C atoms. With this presumption, we assert that the triply ionised state will contribute negligibly in the ion–ion coincidences and focus only on the doubly ionised state by normal Auger decay. PEPIPICO map,43,45 one of the techniques to study fragmentation dynamics, is a plot of the ToF of the faster ion in the horizontal axis while the ToF of the slower ion in the vertical axis, as presented in Fig. 5b. Ionic fragments originating from the same ionisation event appear as tilted islands, and their shape depends on the dynamics of fragmentation post ionisation.64 The molecular camphor dication can break up by two-body, three-body or many-body dissociation pathways, as the doubly charged molecular camphor is highly unstable. This leads to the formation of more stable singly charged and neutral species, and the corresponding fragments share the KER in each step of fragmentation. Atomic rearrangements and elimination occur during fragmentation65 as demonstrated for camphor62,66 and other large organic molecules.15Fig. 5b is the PEPIPICO map of camphor ionised by a 292.4 eV photon. The islands formed by fragments of lower m/q appear not to have a clear slope and are relatively broad. This indicates that the islands are resulting from multi-body dissociation, accompanied by the release of neutral fragments, post C 1s ionisation. It can be further noted that some islands appear to be formed by a merger of one or more islands; this may result from different fragmentation pathways producing the same set of ionic fragments and can also have a significant contribution from triply or multiply ionised camphor, as some of them were also observed in triple ion coincidences.
Consequently, a few islands were chosen for further elucidation. The first being the island formed by m/q of 55 & 97, which adds to the molecular mass of camphor (see the area marked in orange in Fig. 5b) and the second, a set of islands, formed by masses 15 & 109, 29 & 95, 42 & 82 and 55 & 69, forming a diagonal in the PEPIPICO map (see the area marked in red in Fig. 5b). The masses of the detected fragments add up such for the set of islands, that the missing fragment has an mass of 28 amu, which can reasonably be assigned to the carbonyl group (C![[double bond, length as m-dash]](https://www.rsc.org/images/entities/char_e001.gif) O) of camphor molecule (as this forms the strongest the molecular bond and the emitted neutral carbon mono-oxide fragment would be fairly stable). The PES obtained from the e-VMI of the chosen islands, at a photon energy of 304.9 eV, have very few counts, and this combined with instrumental broadening leads to ill-defined PES. This complicates the assignment of a fragmentation channel to a specific initial ionisation site. However, an improved overall resolution and sufficiently long acquisition period can reveal critical information about the core level ionisation site and the associated fragmentation channel.
O) of camphor molecule (as this forms the strongest the molecular bond and the emitted neutral carbon mono-oxide fragment would be fairly stable). The PES obtained from the e-VMI of the chosen islands, at a photon energy of 304.9 eV, have very few counts, and this combined with instrumental broadening leads to ill-defined PES. This complicates the assignment of a fragmentation channel to a specific initial ionisation site. However, an improved overall resolution and sufficiently long acquisition period can reveal critical information about the core level ionisation site and the associated fragmentation channel.
4 Discussions
4.1 Two-body dissociation of doubly charged camphor molecule
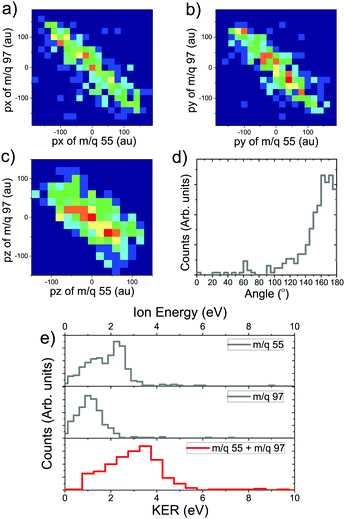
The probability of doubly charged camphor dissociating into two fragments, post C 1s ionisation is not very high. However, some pathways would lead to two body dissociation of the doubly charged molecule. One such pathway was observed in the PEPIPICO map leading to formation of charged moieties having m/q of 55 & 97 (see Fig. 5b marked in orange). As the two body dissociation process of a doubly charged molecule is governed by Coulombic repulsion, the resulting fragments would drift away from each other carrying equal and opposite momenta. This becomes evident when the 3-momenta, px, py and pz, of the slower ion are plotted against corresponding momenta of the faster ion, as shown in Fig. 6a–c. Further, the angular distribution between the m/q of 55 & 97, refer Fig. 6d, shows an very narrow distribution around 180°. This, in addition, affirms that the methodology adopted for analysis produces rather correct results. The photo-fragment energy spectra, Fig. 6e, shows the experimentally measured energy distribution of the detected ions. It is observed that the lighter ionic fragment having m/q of 55 carries more energy as compared to the heavier fragment with m/q of 97, as expected. However, as the dissociation channel of the transient molecular ion depends on the energy states accessed during the quenching of the hole formed by photoionisation, it is essential to estimate these energy states. The Kinetic Energy Release (KER) spectra is obtained by summing up the event by event kinetic energies of the ionic fragments generated (m/q 55+ + m/q 97+), and plotting the hence formed distribution. Even though an Auger electron energy discriminated experiment provides a greater detail of the energy states accessed, KER spectra too is associated with the energy state accessed by the precursor molecular ion.5 Hence, the KER spectra (in coincidence with electron) can be used to estimate the states contributing to the dissociation precursor.67 The KER spectra in this fragmentation channel peaks around 3.5 eV, indicating the energy state accessed by the molecule following Auger decay.4.2 Three-body dissociation of doubly charged camphor molecule with neutral CO emission
A core electron ionised molecule has a very high probability of decaying via Auger decay, quenching the core hole. As the core hole lifetime in molecules is strongly dependent on the Auger transition rates and is in the order of a few femtoseconds,68,69 the core hole will decay before the molecule actually breaks. This will leave the molecule with two holes in valence orbitals and a definite amount of internal energy.| M + hν → M+ + ecore− → M2+ + eAuger− + ecore− |
Calculations to decipher the exact dicationic states involved in a particular dissociation pathways is extremely complicated due to the presence of a large number of densely packed Auger final states in a large molecule, as observed previously for benzene.70 Moreover, we do not have selection on the energy of Auger electron in the experiment, hence we are not restricted to a few electronic states and configurations. Therefore, it is essential to exploit other parameters to discern a fragmentation channel. The internal energy deposited in the molecule, post Auger decay, depends on the Auger decay channel, and plays a vital role in the fragmentation pathway it follows. In a previous study of OCS, it was observed that the fragmentation mechanisms showed marked differences depending on the final Auger decay state.5 In another fragmentation study of chloro- and bromo-acetic acid post C 1s ionisation, a clear relation between the initial ionisation site and the fragmentation pattern was detected, resulting from the difference in internal energy following the site-specific Auger decay.6 In a recent study of N-methyltrifluoroacetamide,9 internal energy was found to be the dominant factor for the fragmentation pattern even for a resonant Auger decay.
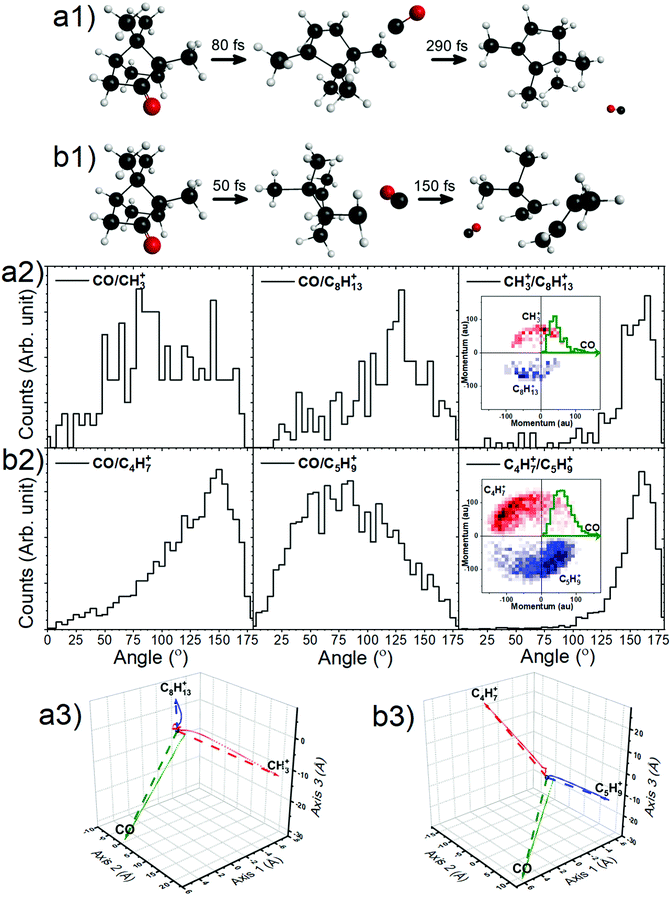
With this premise, ground-state ab initio molecular dynamics (MD) simulations for the dicationic camphor molecule, with given internal energies (in the form of bath temperatures) were performed using GAMESS suite, as described in the computational methods section. These MD simulations sufficiently unfolds the fragmentation dynamics of the islands discussed arising from doubly charged camphor molecule, following C 1s ionisation of camphor. The crucial factor that affects the molecule's fragmentation channel, as observed, is the ‘bath temperature’. The bath temperature here corresponds to the internal energy deposited on the doubly charged molecular ion, as mentioned earlier, thence the normal Auger decay. A similar approach has been employed for studying X-ray induced fragmentation of Thiophene7 and Serine & Cysteine.8 Among the various temperatures chosen for the MD simulations, the dicationic molecule starts fragmenting at 2500 K leading to fragments corresponding to the experimentally observed island m/q 15 (CH3+) & 109 (C8H13+), with emission of a neutral CO, mass of 28 amu, in the initial stage. This fragmentation channel remains unchanged for temperatures up to ∼4000 K. At 4000 K, the molecule fragments into the island corresponding to m/q of 55 (C4H7+) & 69 (C5H9+), with emission of neutral CO, similar to the first island. This channel is observed till the temperature reaches 5000 K. A few crucial steps of the dynamics have been shown in Fig. 7a1 and b1 (generated using wxMacMolPlt71). The molecular ion fragments into the final daughter fragments faster for higher internal energy, as the MD is faster for higher energy, as previously observed.7
Taking advantage of the experimentally measured momenta of the detected fragments and the estimated momentum of the neutral fragment, the angular distribution could be easily plotted for both the channels, see Fig. 7a2 and b2. To corroborate this with the molecular dynamics simulations, the centre of mass (CM) of each fragment were computed from the positions of the individual atoms contributing to that particular fragment, as obtained from the simulation, in time steps of 2.5 fs. Fig. 7a3 and b3 show the CMs of each of the fragments in space coordinates (in Å), and each bubble represents the CMs at a particular time with interval of 10 fs, up to 1000 fs. The straight dashed arrows are formed by connecting the CM of the camphor molecule before fragmentation to the CMs of the individual fragments after 1000 fs, and these depict the relative direction of the fragments in space after 1000 fs. Furthermore, the angles between the individual fragments were computed from the trajectories, using the direction vectors, aforementioned ‘straight dashed arrows’. These fragmentation channels, CH3+ + C8H13+ + CO and C4H7+ + C5H9+ + CO, has been discussed in detail in the following subsections.
From the experimentally observed angular distribution, see Fig. 7a2, neutral CO was observed to have a broad angular distribution with both the ionic, detected fragments, while the angle between the ionic fragments has a rather narrow distribution, having momenta in the almost opposite direction. The Newton diagrams referenced to the neutral fragment, inset in Fig. 7a2, reciprocate the same and gives an indication of molecular rotation post emission of the neutral CO. In Fig. 7a3 (obtained from simulations as aforementioned), it can be observed that the molecule has undergone rotations following the neutral CO emission and before fragmenting further. Albeit the fact that the computed angle neutral CO makes with the detected fragments does not make much sense, as the molecule is free to rotate after the first stage of dissociation, this adequately explains the experimental broad angular distribution of the charged moieties with the neutral CO. CH3+ is the lighter among the two final daughter fragments and shows a higher degree of rotation. This correlates to the broader distribution with respect to CO in experiments, as compared to C8H13+. However, the angle computed between the ionic fragments, CH3+ & C8H13+, from the MD simulations, was found to be 156°, which sufficiently complements the experimentally observed angular distribution.
The angular distribution in this dissociation channel is comparable to the first channel. While the neutral CO has a broad distribution with the charged fragments, they themselves have a narrow distribution in opposite direction (Fig. 7b2). Having said that, the ionic doubly charged fragment rotates for a significantly shorter time post neutral CO emission, than the first channel and the masses of the final ionic fragments are not as distinct as in the first channel. This leads to a similar degree of rotation of both the fragments and a more directed emission of the final fragments with respect to the neutral CO. The Newton diagrams referenced to the neutral fragment (inset in Fig. 7b2) are much distinguished owing to ample number of events recorded for this channel and the free rotation post neutral CO emission is hence more comprehensible. This can be ratified with the simulations, see Fig. 7b3. Similar to the first channel, the angle between the charged fragments C4H7+ & C5H9+ is found to be 156°, complementing the experiments.
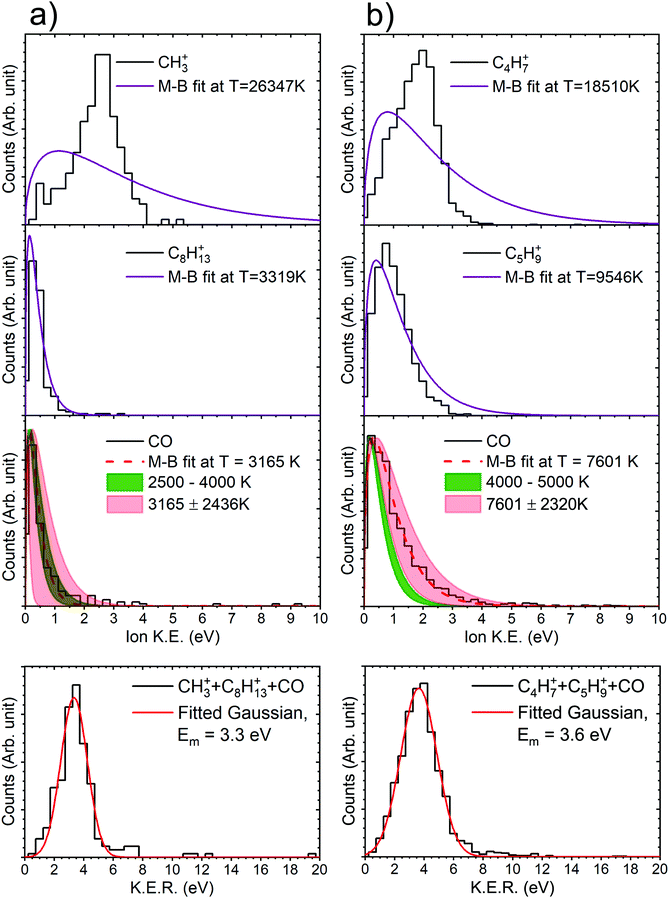
It can be observed here that for the channel CH3+ + C8H13+ + CO, the theoretical and the experimental values match very well. For the channel C4H7+ + C5H9+ + CO, they are adequately close considering the substantial spectrometer error associated. Essentially, both the parameters, the convoluted temperature range obtained from M–B fit to the experimental data and the temperature range of the bath in MD simulations, are observed to increase proportionally. Furthermore, Gaussians have been fitted to the KER distributions of both the channels, which results in energy difference indistinguishable to the spectrometer resolution, and mean energy at ∼3.5 eV. A possible explanation for the resultant temperature of the neutral fragment would be that the fragment is carrying the excessive energy resulting from the normal mode state in which the fragment formed.
For the other two channels m/q 29+ + m/q 95+ + m/q 28 and m/q 42+ + m/q 82+ + m/q 28, we found the M–B fit to experimental data in range between the channels CH3+ + C8H13+ + CO and C4H7+ + C5H9+ + CO. However, in the MD simulations we did not observe the fragmentations correlating to the observed m/q s in that particular temperature range. Therefore, substantiating the correlation of the temperature obtained from M–B fits to experimental data with bath temperature in the MD simulations, for the channels m/q 29+ + m/q 95+ + m/q 28 and m/q 42+ + m/q 82+ + m/q 28, is untenable without further dwelling. Anyhow, the experimental M–B fits and the fragmentation pattern do correlate in a manner. A comparison between the amount of energy carried by the m/q 28 (which manifest in the form of temperature of the M–B fits) in all the four channels and the mass ratio of the two detected ionic fragments suggest that, as the energy of the m/q 28 increases the fragmentation of the remnant doubly charged fragment becomes more aggressive resulting in final fragments of comparable masses.
Having said that, the fragmentation dynamics and detailed understanding of it are associated with many intricate processes that may involve multiple potential energy surfaces and crossing over from one surface to another via conical intersections. Therefore, a thorough theoretical study, comparable to studies such as; examining the impact of conical intersection on the product vibrational state distribution on non-adiabatic photodissociation of phenol,10 and investigating the effect of the redistribution of internal energy among various degrees of freedom, and its effect on the dissociation pathways, using quantum chemical calculations, statistical mechanical methods and experiments as previously reported for furan,11 is essential. Such a study for a molecule like camphor would, however, be computationally costly and complex, and requires further dwelling.
5 Conclusions
In conclusion, we studied the fragmentation dynamics of a doubly charged camphor molecule post C 1s ionisation at photon energies 292.4 eV and 304.9 eV. Using the VMI-PEPIPICO technique, photoelectron energy spectra at 304.9 eV and complete 3-D momenta of the ionic fragments at 292.4 eV were recorded.Furthermore, as the internal energy of the molecule and its redistribution to the various degrees of freedom is known to drastically affect the fragmentation of multiply charged molecule following Auger decay, MD simulations were performed to determine the evolution of the fragmentation dynamics of the doubly charged camphor with temperature as a parameter. Two experimentally observed fragmentation channel, CH3+ + C8H13+ + CO and C4H7+ + C5H9+ + CO, were successfully simulated, for two particular temperature ranges. Notably, the signature of this temperature was found in the experimentally observed energy distribution of neutral CO, emitted in the dissociation via deferred charged separation pathways. This hints towards the excessive energy carried by the neutral fragment, resulting from the normal mode state. Nonetheless, a detailed theoretical study requires complex computation to decipher the finer details of the dissociation channels.
Since a kinematically complete scheme is used to detect both electrons and ions, this study sets a base for further studies like exploring the photoelectron circular dichroism (PECD) post ionisation of O 1s of camphor (as observed for carbonyl C 1s of camphor26), probing photoion circular dichroism (PICD) in strong field ionisation of camphor, as previously seen for other molecules39–41 or the impact of ro-vibronically cooling of such a molecular system in a He nanodroplet host environment. Additionally, it motivates the study of interaction of radiation with large chiral molecules significant in biological applications.
Author contributions
V. S., R. G. and S. R. K. planned and designed research; S. S., S. M., R. G., L. B. L., S. T., D. C., N. Z., M. C., R. R. and S. R. K. performed research; S. S., S. M., A. S., V. S., R. G. contributed new analytic and simulation tools; S. S., S. M., A. S. and V. S. analysed data; S. S. and A. S. performed MD simulations. S. S., S. M., A. S., V. S., R. R., M. M. and S. R. K. wrote the paper.Conflicts of interest
There are no conflicts to declare.Acknowledgements
S. S., A. S. and V. S. thank Prof. M. Krishnamurthy and Dr R. Ramakrishnan for extending to us the computational facilities of the Tata Institute of Fundamental Research, Hyderabad, and for insightful suggestions. S. R. K. and V. S. are grateful to DST, India and ICTP, Trieste, who supported this campaign (#20185050). V. S. thanks DST-SERB and DAE-BRNS, and V. S. and R. G. thank IMPRINT (#5627) for financial support. S. R. K. thanks D. S. T. and Max Planck Society for financial support. V. S., S. R. K., and M. M. acknowledge funding from the SPARC programme, MHRD, India. S. R. K. gratefully acknowledges financial support from IIT Madras through the Quantum Centers in Diamond and Emerging Materials (QuCenDiEM) group as part of the Institute of Eminence (IoE) programme (project# SB20210813PHMHRD002720). MM acknowledges support from the Carlsberg Foundation and the International Network Programme of the Danish Ministry of Higher Education and Science.References
- G. C. Almeida, S. Pilling, D. P. P. Andrade, N. L. S. Castro, E. Mendoza, H. M. Boechat-Roberty and M. L. M. Rocco, J. Phys. Chem. C, 2014, 118, 6193–6200 CrossRef CAS
.
- A. L. F. de Barros, D. P. P. Andrade, E. F. da Silveira, K. F. Alcantara, P. Boduch and H. Rothard, Mon. Not. R. Astron. Soc., 2017, 474, 1469–1481 CrossRef
.
- A. Kivimäki, M. Alagia and R. Richter, J. Phys. B: At., Mol. Opt. Phys., 2014, 47, 155101 CrossRef
.
- J. Viefhaus, M. Braune, S. Korica, A. Reinköster, D. Rolles and U. Becker, J. Phys. B: At., Mol. Opt. Phys., 2005, 38, 3885–3903 CrossRef CAS
.
- K. Saha, S. Banerjee and B. Bapat, Chem. Phys. Lett., 2014, 607, 85–91 CrossRef CAS
.
- H. Levola, E. Itälä, K. Schlesier, K. Kooser, S. Laine, J. Laksman, D. T. Ha, E. Rachlew, M. Tarkanovskaja, K. Tanzer and E. Kukk, Phys. Rev. A: At., Mol., Opt. Phys., 2015, 92, 063409 CrossRef
.
- E. Kukk, D. T. Ha, Y. Wang, D. G. Piekarski, S. Diaz-Tendero, K. Kooser, E. Itälä, H. Levola, M. Alcamí, E. Rachlew and F. Martín, Phys. Rev. A: At., Mol., Opt. Phys., 2015, 91, 043417 CrossRef
.
- E. Itälä, H. Levola, D. T. Ha, K. Kooser, E. Rachlew and E. Kukk, J. Phys. Chem. A, 2016, 120, 5419–5426 CrossRef PubMed
.
- P. Salén, L. Schio, R. Richter, M. Alagia, S. Stranges and V. Zhaunerchyk, Phys. Rev. A, 2020, 102, 032817 CrossRef
.
- C. Xie, B. Zhao, C. L. Malbon, D. R. Yarkony, D. Xie and H. Guo, J. Phys. Chem. Lett., 2020, 11, 191–198 CrossRef CAS PubMed
.
- E. Erdmann, N. F. Aguirre, S. Indrajith, J. Chiarinelli, A. Domaracka, P. Rousseau, B. A. Huber, P. Bolognesi, R. Richter, L. Avaldi, S. Díaz-Tendero, M. Alcamí and M. Aabuda, Phys. Chem. Chem. Phys., 2021, 23, 1859–1867 RSC
.
- L. Zhang, S. Roither, X. Xie, D. Kartashov, M. Schöffler, H. Xu, A. Iwasaki, S. Gräfe, T. Okino, K. Yamanouchi, A. Baltuska and M. Kitzler, J. Phys. B: At., Mol. Opt. Phys., 2012, 45, 085603 CrossRef
.
- B. Erk, D. Rolles, L. Foucar, B. Rudek, S. W. Epp, M. Cryle, C. Bostedt, S. Schorb, J. Bozek, A. Rouzee, A. Hundertmark, T. Marchenko, M. Simon, F. Filsinger, L. Christensen, S. De, S. Trippel, J. Küpper, H. Stapelfeldt, S. Wada, K. Ueda, M. Swiggers, M. Messerschmidt, C. D. Schröter, R. Moshammer, I. Schlichting, J. Ullrich and A. Rudenko, Phys. Rev. Lett., 2013, 110, 053003 CrossRef CAS PubMed
.
- U. Alkemper, R. Hörnig and F. von
Busch, J. Phys. B: At., Mol. Opt. Phys., 1996, 29, 35–46 CrossRef CAS
.
- A. R. Abid, E. Pelimanni, M. Reinhardt, N. Boudjemia, A. Kivimäki, M. Huttula, O. Björneholm and M. Patanen, J. Phys. B: At., Mol. Opt. Phys., 2020, 53, 244001 CrossRef
.
- A. Hishikawa, A. Matsuda, E. J. Takahashi and M. Fushitani, J. Chem. Phys., 2008, 128, 084302 CrossRef PubMed
.
- H. Xu, T. Okino and K. Yamanouchi, J. Chem. Phys., 2009, 131, 151102 CrossRef PubMed
.
- B. Erk, D. Rolles, L. Foucar, B. Rudek, S. W. Epp, M. Cryle, C. Bostedt, S. Schorb, J. Bozek, A. Rouzee, A. Hundertmark, T. Marchenko, M. Simon, F. Filsinger, L. Christensen, S. De, S. Trippel, J. Küpper, H. Stapelfeldt, S. Wada, K. Ueda, M. Swiggers, M. Messerschmidt, C. D. Schröter, R. Moshammer, I. Schlichting, J. Ullrich and A. Rudenko, J. Phys. B: At., Mol. Opt. Phys., 2013, 46, 164031 CrossRef
.
- Y. Muramatsu, K. Ueda, N. Saito, H. Chiba, M. Lavollée, A. Czasch, T. Weber, O. Jagutzki, H. Schmidt-Böcking, R. Moshammer, U. Becker, K. Kubozuka and I. Koyano, Phys. Rev. Lett., 2002, 88, 133002 CrossRef CAS PubMed
.
- R. K. Singh, G. S. Lodha, V. Sharma, I. A. Prajapati, K. P. Subramanian and B. Bapat, Phys. Rev. A: At., Mol., Opt. Phys., 2006, 74, 022708 CrossRef
.
- A. Khan, L. C. Tribedi and D. Misra, Phys. Rev. A, 2017, 96, 012703 CrossRef
.
- J. H. D. Eland, R. Singh, J. D. Pickering, C. S. Slater, A. Hult Roos, J. Andersson, S. Zagorodskikh, R. J. Squibb, M. Brouard and R. Feifel, J. Chem. Phys., 2016, 145, 074303 CrossRef CAS PubMed
.
- I. Novak, S. Ng and B. Kovac, Spectrochim. Acta, Part A, 1993, 49, 1629–1631 CrossRef
.
- G. A. Garcia, L. Nahon, M. Lebech, J.-C. Houver, D. Dowek and I. Powis, J. Chem. Phys., 2003, 119, 8781–8784 CrossRef CAS
.
- T. Lischke, N. Böwering, B. Schmidtke, N. Müller, T. Khalil and U. Heinzmann, Phys. Rev. A: At., Mol., Opt. Phys., 2004, 70, 022507 CrossRef
.
- U. Hergenhahn, E. E. Rennie, O. Kugeler, S. Marburger, T. Lischke, I. Powis and G. Garcia, J. Chem. Phys., 2004, 120, 4553–4556 CrossRef CAS PubMed
.
- L. Nahon, G. A. Garcia, C. J. Harding, E. Mikajlo and I. Powis, J. Chem. Phys., 2006, 125, 114309 CrossRef PubMed
.
- I. Powis, C. J. Harding, G. A. Garcia and L. Nahon, ChemPhysChem, 2008, 9, 475–483 CrossRef CAS PubMed
.
- L. Nahon, G. A. Garcia, H. Soldi-Lose, S. Daly and I. Powis, Phys. Rev. A: At., Mol., Opt. Phys., 2010, 82, 032514 CrossRef
.
- L. Nahon, L. Nag, G. A. Garcia, I. Myrgorodska, U. Meierhenrich, S. Beaulieu, V. Wanie, V. Blanchet, R. Géneaux and I. Powis, Phys. Chem. Chem. Phys., 2016, 18, 12696–12706 RSC
.
- C. Lux, M. Wollenhaupt, T. Bolze, Q. Liang, J. Köhler, C. Sarpe and T. Baumert, Angew. Chem., Int. Ed., 2012, 51, 5001–5005 CrossRef CAS PubMed
.
- C. S. Lehmann, N. B. Ram, I. Powis and M. H. M. Janssen, J. Chem. Phys., 2013, 139, 234307 CrossRef PubMed
.
- C. Lux, M. Wollenhaupt, C. Sarpe and T. Baumert, ChemPhysChem, 2015, 16, 115–137 CrossRef CAS PubMed
.
- In 3d Momentum Imaging Spectroscopy Probing Of Strong-Field Molecular And Surface Dynamics, ed. L. Fan, Wayne State University Dissertations, 2018 Search PubMed
.
- F. J. Devlin, P. J. Stephens, J. R. Cheeseman and M. J. Frisch, J. Phys. Chem. A, 1997, 101, 6322–6333 CrossRef CAS
.
- M. Stener, D. Di Tommaso, G. Fronzoni, P. Decleva and I. Powis, J. Chem. Phys., 2006, 124, 024326 CrossRef CAS PubMed
.
- I. Dreissigacker and M. Lein, Phys. Rev. A: At., Mol., Opt. Phys., 2014, 89, 053406 CrossRef
.
- A. D. Müller, A. N. Artemyev and P. V. Demekhin, J. Chem. Phys., 2018, 148, 214307 CrossRef PubMed
.
- K. Fehre, S. Eckart, M. Kunitski, M. Pitzer, S. Zeller, C. Janke, D. Trabert, J. Rist, M. Weller, A. Hartung, L. P. H. Schmidt, T. Jahnke, R. Berger, R. Dörner and M. S. Schöffler, Sci. Adv., 2019, 5, eaau7923 CrossRef CAS PubMed
.
- C. S. Lehmann and K.-M. Weitzel, Phys. Chem. Chem. Phys., 2020, 22, 13707–13712 RSC
.
- K. Fehre, S. Eckart, M. Kunitski, C. Janke, D. Trabert, M. Hofmann, J. Rist, M. Weller, A. Hartung, L. P. H. Schmidt, T. Jahnke, H. Braun, T. Baumert, J. Stohner, P. V. Demekhin, M. S. Schöffler and R. Dörner, Phys. Rev. Lett., 2021, 126, 083201 CrossRef CAS PubMed
.
- R. B. de Castilho, T. C. Ramalho, C. V. Nunez, L. H. Coutinho, A. C. F. Santos, S. Pilling, A. F. Lago, M. O. Silva-Moraes and G. G. B. de Souza, Rapid Commun. Mass Spectrom., 2014, 28, 1769–1776 CrossRef CAS PubMed
.
- J. Eland, F. Wort and R. Royds, J. Electron Spectrosc. Relat. Phenom., 1986, 41, 297–309 CrossRef CAS
.
- L. J. Frasinski, M. Stankiewicz, K. J. Randall, P. A. Hatherly and K. Codling, J. Phys. B: At. Mol. Phys., 1986, 19, L819–L824 CrossRef CAS
.
- J. Eland, Mol. Phys., 1987, 61, 725–745 CrossRef CAS
.
- A. T. J. B. Eppink and D. H. Parker, Rev. Sci. Instrum., 1997, 68, 3477–3484 CrossRef CAS
.
- M. W. Schmidt, K. K. Baldridge, J. A. Boatz, S. T. Elbert, M. S. Gordon, J. H. Jensen, S. Koseki, N. Matsunaga, K. A. Nguyen, S. Su, T. L. Windus, M. Dupuis and J. A. Montgomery Jr, J. Comput. Chem., 1993, 14, 1347–1363 CrossRef CAS
.
- A. Derossi, F. Lama, M. Piacentini, T. Prosperi and N. Zema, Rev. Sci. Instrum., 1995, 66, 1718–1720 CrossRef CAS
.
- D. Desiderio, S. Difonzo, B. Dlviacco, W. Jark, J. Krempasky, R. Krempaska, F. Lama, M. Luce, H. C. Mertins, M. Placentini, T. Prosperi, S. Rinaldi, G. Soullie, F. Schäfers, F. Schmolle, L. Stichauer, S. Turchini, R. P. Walker and N. Zema, Synchrotron Radiation News, 1999, 12, 34–38 CrossRef
.
- M. Tronc, G. C. King and F. H. Read, J. Phys. B: At. Mol. Phys., 1979, 12, 137–157 CrossRef CAS
.
- P. OKeeffe, P. Bolognesi, M. Coreno, A. Moise, R. Richter, G. Cautero, L. Stebel, R. Sergo, L. Pravica, Y. Ovcharenko and L. Avaldi, Rev. Sci. Instrum., 2011, 82, 033109 CrossRef CAS PubMed
.
- D. Buchta, S. R. Krishnan, N. B. Brauer, M. Drabbels, P. OKeeffe, M. Devetta, M. Di Fraia, C. Callegari, R. Richter, M. Coreno, K. C. Prince, F. Stienkemeier, R. Moshammer and M. Mudrich, J. Phys. Chem. A, 2013, 117, 4394–4403 CrossRef CAS PubMed
.
- S. Mandal, R. Gopal, M. Shcherbinin, A. DElia, H. Srinivas, R. Richter, M. Coreno, B. Bapat, M. Mudrich, S. R. Krishnan and V. Sharma, Phys. Chem. Chem. Phys., 2020, 22, 10149–10157 RSC
.
- B. Dick, Phys. Chem. Chem. Phys., 2014, 16, 570–580 RSC
.
- A. Khan, L. C. Tribedi and D. Misra, Rev. Sci. Instrum., 2015, 86, 043105 CrossRef PubMed
.
- R. Gopal, A. Sen, S. R. Sahu, A. S. Venkatachalam, M. Anand and V. Sharma, Rev. Sci. Instrum., 2018, 89, 086107 CrossRef CAS PubMed
.
- M. Brunelli, A. N. Fitchci and A. J. Mora, J. Solid State Chem., 2002, 163, 253–258 CrossRef CAS
.
- In NIST Chemistry WebBook, NIST Standard Reference Database Number 69, ed. P. Linstrom and E. W. G. Mallard, National Institute of Standards and Technology, Gaithersburg MD, p. 20899, retrieved May 18, 2021 Search PubMed
.
- E. E. Rennie, I. Powis, U. Hergenhahn, O. Kugeler, G. Garcia, T. Lischke and S. Marburger, J. Electron Spectrosc. Relat. Phenom., 2002, 125, 197–203 CrossRef CAS
.
- V. Myrseth, K. J. Børve, K. Wiesner, M. Bässler, S. Svensson and L. J. Sæthre, Phys. Chem. Chem. Phys., 2002, 4, 5937–5943 RSC
.
- M. Borst and V. Schmidt, Phys. Rev. A: At., Mol., Opt. Phys., 1986, 33, 4456–4458 CrossRef CAS PubMed
.
- D. S. Weinberg and C. Djerassi, J. Org. Chem., 1966, 31, 115–119 CrossRef CAS
.
- A. H. Roos, J. H. D. Eland, J. Andersson, R. J. Squibb, D. Koulentianos, O. Talaee and R. Feifel, Sci. Rep., 2018, 8, 16405 CrossRef PubMed
.
- J. H. D. Eland, Laser Chem., 1991, 11, 717149 Search PubMed
.
- F. W. McLafferty, Anal. Chem., 1959, 31, 82–87 CrossRef CAS
.
- D. R. Dimmel and J. Wolinsky, J. Org. Chem., 1967, 32, 410–416 CrossRef CAS
.
- A. Sen, T. Sairam, S. R. Sahu, B. Bapat, R. Gopal and V. Sharma, J. Chem. Phys., 2020, 152, 014302 CrossRef CAS PubMed
.
- T. X. Carroll, J. Hahne, T. D. Thomas, L. J. Sæthre, N. Berrah, J. Bozek and E. Kukk, Phys. Rev. A: At., Mol., Opt. Phys., 2000, 61, 042503 CrossRef
.
- T. X. Carroll, K. J. Børve, L. J. Sæthre, J. D. Bozek, E. Kukk, J. A. Hahne and T. D. Thomas, J. Chem. Phys., 2002, 116, 10221–10228 CrossRef CAS
.
- F. Tarantelli, A. Sgamellotti, L. S. Cederbaum and J. Schirmer, J. Chem. Phys., 1987, 86, 2201–2206 CrossRef CAS
.
- B. M. Bode and M. S. Gordon, J. Mol. Graphics Modell., 1998, 16, 133–138 CrossRef CAS PubMed
.
| This journal is © the Owner Societies 2022 |

