 Open Access Article
Inkjet 3D-printing of functional layers of solid oxide electrochemical reactors: a review
S. S.
Kawale
,
I.
Jang
*,
N. M.
Farandos†
and
G. H.
Kelsall

Department of Chemical Engineering, Imperial College London, London SW7 2AZ, UK. E-mail: i.jang@imperial.ac.uk
First published on 14th April 2022
Abstract
Conventionally, components of solid oxide fuel cells and electrolysers are fabricated by die pressing, tape/gel casting, injection moulding, etc., using metal oxide particulate dispersions with binders and other additives, followed by sintering at high temperatures. Such processes require cycle times of hours to days, and are materially wasteful and energetically inefficient, making them costly and less environmentally benign. Their limited ability to fabricate more complex geometries than conventional planar and tubular structures constrains reactor designs. Hence, herein we review 3D inkjet printing the functional layers of solid oxide electrochemical reactors, as it can achieve reproducible geometries and microscopic resolution feature sizes, thereby minimising material waste, but compatible with manufacturing processes. The principles of inkjet printing and formulation of suitable precursor colloidal dispersions (‘inks’) are overviewed, followed by a summary of the literature on inkjet-printed solid oxide electrochemical reactors, covering ink formulation, reactor fabrication and their electrochemical performances in fuel cell and electrolyser modes. Whereas electrodes have been 2D printed with composite inks of two particulate phases, their performance was limited significantly by low porosities. Fabrication of 3D electrodes with reproducible, pre-designed architectures has been reported for less than a decade, so the full potential of 3D inkjet printing has yet to be realised. Finally, we discuss how the challenges limiting this technique: increasing spatial resolution, controlling porosity, and 3D structure resolution and fabrication, are expected to be met.
1. Introduction
Global concerns over climate change and energy security have driven research, development and deployment of renewable, decarbonised electrical power sources, but the inherent intermittency of wind and solar energy sources requires energy storage technologies1 to manage those dynamics and of supply and demand.2 Electrochemical reactors can convert electrical to chemical energy during times of surplus electrical power availability, and the reverse at times of high power demand. Electrochemical energy storage devices include batteries3 supercapacitors and coupled fuel cell/electrolyser systems,4,5 the last of which generally have higher energy and power densities than batteries. For example, such electrolysers can split water (or steam) into H2,6,7 usually termed ‘power-to-gas’ storage, which can be used in both cyclic electrolyser – fuel cell operation, and in fuel cell-powered vehicles.8,9Fuel cells and electrolysers are classified generally by their operating temperatures, with low-temperature devices including polymer electrolyte membrane (PEM) and alkaline aqueous cells,10 and high temperature counterparts including molten electrolyte and solid oxide electrochemical reactors (SOERs).11 Presently, the former are more technologically advanced, but suffer from several drawbacks; they require precious metal catalysts, operate with very few chemical species (i.e. only H2), are less efficient than their high temperature counterparts, so have a greater electrical energy requirement in electrolyser mode, and unlike SOERs, a single reactor cannot function reliably in both fuel cell and electrolyser modes.12–14 Hence, reversible SOERs are preferred for grid-scale energy storage applications, operating with round-trip energy conversion efficiencies, of ca. 70%, i.e. competitive with pumped hydroelectric storage, presently the dominant means of energy storage globally.
Commercialisation of SOERs has been restricted primarily to the US, UK, and Japan for relatively low power residential and industrial applications. Increasing reactor durability and decreasing capital costs are the main challenges to achieving market penetration, so extensive research has aimed to develop innovative ceramic materials and composites, whereas comparatively limited efforts have focused on the design of electrode architectures. Progress of commercial additive manufacturing (AM) technologies over the last two decades potentially has enabled new approaches to fabrication and improving SOERs performances.
Following a brief overview of SOER materials, conventional fabrication methods and AM techniques are summarised, focusing on the types of inkjet printing, ink properties and possible effects on fabrication of advanced functional layers of materials. The literature on SOERs fabricated by inkjet printing and their subsequent electrochemical performance is reviewed, concluding with the challenges of advancing inkjet printing as a fabrication technique.
1.1. Materials for solid oxide electrochemical reactors
SOERs comprise ionically conducting metal oxide electrolytes, sandwiched by electronically conducting positive and negative electrodes, with pores by which reactants/products are supplied/removed, respectively. In addition, there is often an ‘inter-layer’ due to chemical incompatibilities between certain electrolyte and electrode phases. The most common materials used for SOERs functional layers are:• Ionic conducting ceramic electrolytes (e.g. scandia-stabilized (ScSZ), yttria-stabilised zirconia (YSZ), gadolinium-doped ceria (CGO) or lanthanum strontium gadolinium manganite (LSGM)).15
• Positive (cathode in fuel cell and anode in electrolyser modes) and negative (anode in fuel cell and cathode in electrolyser modes) electrodes comprising either a mixed electronically- and ionically-conducting material, such as lanthanum strontium cobaltite ferrite (LSCF), or a composite electrode combining an ionically-conducting material (i.e. the electrolyte layer material) and an electronically-conducting material (e.g. lanthanum strontium manganite (LSM), Ni or Cu).16
• Depending on the electrode and electrolyte materials, an interlayer may be required to prevent reaction between the two at high temperatures (>1000 °C during sintering), or to bridge a difference in their thermal expansion coefficients. Examples include a CGO interlayer between YSZ and LSCF, and a samarium-doped ceria (SDC) interlayer between YSZ and barium strontium cobalt ferrite (BSCF), to prevent unfavourable solid-state reactions.17
1.2. Conventional fabrication techniques
Tape casting or screen printing of precursor pastes containing powders of the desired materials, and their subsequent sintering, is employed conventionally to fabricate the functional layers of SOERs.18 Both techniques rely on random particle mixing within the electrode pastes to produce high triple phase boundary (TPB) densities (the interface between connected pores, electronically and ionically conducting materials) or dual phase boundary (the interface between connected pores and mixed conductors) for mixed-conducting materials, at which reactions occur, within the electrode.A consequence of random powder mixing within the pastes is that a high fraction of TPBs are non-percolating, limiting reactor performance.19 Furthermore, tape casting and screen printing suffer from significantly larger ‘minimum electrolyte layer thicknesses’ than can be achieved by more complex and expensive technologies, such as chemical vapour deposition (CVD) or pulsed laser deposition (PLD).20 Consequently, the ohmic resistance of the reactors remains relatively high for conventionally fabricated devices, so affordable techniques to fabricate thin electrolyte layers are required.21
Electrodes fabricated with tailored micro-structures could increase electrochemical performance, decrease raw material requirements and enhance the longevity of the devices by decreasing degradation rates. Such electrodes, with higher reproducibility and well defined electrode|electrolyte geometries, aid the understanding of SOER reaction mechanisms. Hitherto, ‘model’ electrodes (segregated phases, pre-defined and localised reaction sites) have been constrained to 2D, i.e. patterned electrodes;22 however, model 3D electrodes could validate the kinetic models and concentration profiles established from 2D electrodes, aiding the design of 3D electrodes with superior performance. 3D printing offers the potential of fabricating complex geometries, rapid prototyping, and lower material and energy consumptions than in conventional fabrication processes, thereby prospectively decreasing production costs.
Inkjet printing offers additional prospective benefits for SOERs, of reproducible, geometrically defined TPBs, thereby enabling model-predictable performances. Technologically more importantly, increased electrode|electrolyte interfacial areas per geometric area would enable up-scaling and decrease specific costs. However, as described in section 1.4, simple geometric calculations greatly over-predict scale-up factors, which require model predictions of electrical potential, current density and gas compositions, as functions of geometries.
1.3. Additive manufacturing (AM) of ceramics
AM technologies began to be developed in the 1980s,23,24 and are highly versatile, rapid prototyping techniques that have been applied to plastic electronics,25 biomaterials26 and ceramic component manufacturing.27 Thanks to the versatility and customizability of AM, many technologies have been invented and introduced to the market mainly depending on their applications, though the underlying principle of adding layer onto layer to build structures/devices remains constant. Fig. 1 shows the classification of AM techniques28 based on the starting materials being used, but this review focuses only on inkjet-based techniques.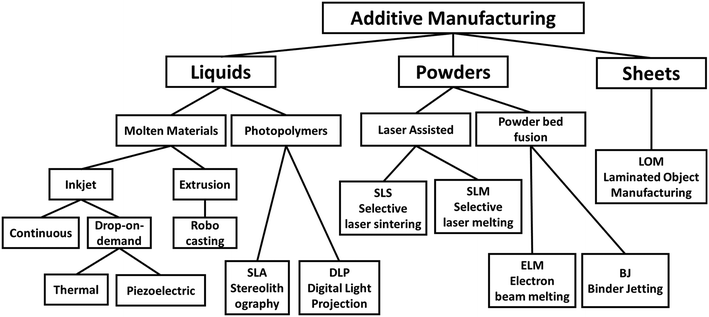 | ||
| Fig. 1 Additive manufacturing (AM) technologies classified by starting materials: liquid, powders or sheets. | ||
These technologies have been reviewed previously for their feasibility to fabricate ceramic components,29,30 but without mention of the relationship of specific fabrication time and achievable feature size/resolution, as given in Fig. 2. From this plot, it is clear that, although the resolution range (102–103 nm) of indirect laser lithography is best suited to the scale of SOERs electrode microstructures, the present state of the technology precludes its use for SOERs fabrication. By contrast, inkjet printing can achieve 10–50 μm resolution with ca. 30 pL droplet volumes at acceptable printing speeds.31 More advanced printheads eject droplets with 1 pL volume, so resolutions of <10 μm should be achievable.32 The other technologies may have utility within SOER manufacturing processes to fabricate e.g. supports, as it is envisaged that only the electrolyte and functional electrode layers will require fine microstructure or <10 μm thick layers. Therefore, an integrated approach employing different technologies may be required. However, this review focuses on inkjet-based technologies and their successful use for SOER microstructural fabrication.
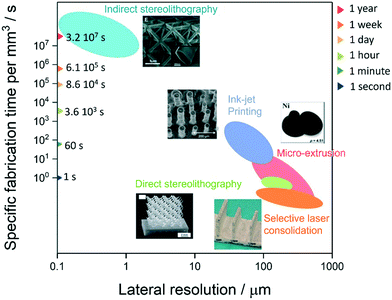 | ||
| Fig. 2 Effect of lateral feature size resolution on fabrication time of ceramic components for different additive manufacturing (AM) technologies. | ||
Inkjet printing is a material deposition technique used for liquid phase materials or inks, consisting of solutions or particles dispersed in a solvent, ejected through a nozzle at precise positions and rates, either continuously or, as shown in Fig. 3, it can be triggered by a drop-on-demand (DOD) system, using thermal or piezoelectric mechanisms, the latter being preferred in industrial inkjet printing technologies.27
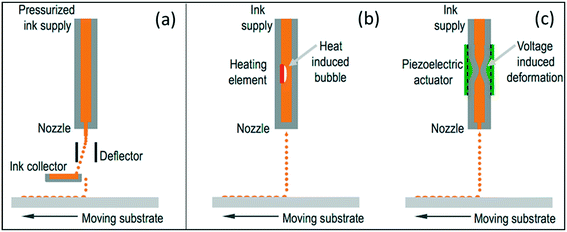 | ||
| Fig. 3 Schematic representation of (a) continuous inkjet (CIJ) and drop on demand (DOD) inkjet printing systems using (b) thermal and (c) piezoelectric technology (reproduced with permission33). | ||
In inkjet printing, droplets are formed by generating pressure waves in an ink-filled channel behind an orifice (printhead nozzle), as shown in Fig. 4a. A droplet is ejected when the kinetic energy transferred to the droplet exceeds the surface energy required to form the droplet and upon ejection, a ‘finger’ of fluid is released. Above a critical pressure, dependent on the rheological properties of the ink and the nozzle geometry, finger detach forming droplets.35
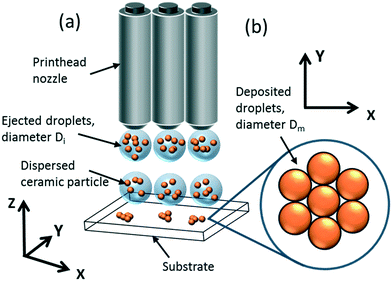 | ||
| Fig. 4 (a) Schematic of a 3D, multi-nozzle, DOD printer, and (b) appearance of a monolayer of dried, deposited droplets with no inter-droplet overlap. | ||
After the droplets impact and settle on the surface of a substrate, the droplets dry by evaporation, leaving a layer of solid deposit (Fig. 4b) with a customisable droplet deposition pattern (e.g. square or hexagonal lattice). Hence, deposited droplets coalesce to form 1D ‘line’ structures, which in turn can coalesce to form 2D planar sheets; printing multiple layers of these sheets on top of each other forms 3D structures.
By optimising the ink properties and droplet behaviour, it is possible to manipulate the droplet coalescence process and print 2D or 3D structures. The resolution of these structures is determined by the droplet impact, settling, and coalescence processes, which depend on the droplet dimensions, ink rheology, substrate, and printer settings such as ejection pressure and pulse duration.
1.4. Practical benefits of 3D inkjet printing for solid oxide electrochemical reactors (SOERs)
Electrode reactions in SOERs occur at interfaces between electronic conductors|ionic conductors|(percolated) pores, through which reactants are transported in and products out. Hence, densities of such triple-phase boundaries (TPBs) determine rates at which gas species can be oxidized or reduced, reacting with the electrons and ions flowing in or out through electronically conducting electrodes and ionically conducting electrolyte phases (Fig. 5). Up-scaling densities of TPBs facilitate gas conversion rates, increasing SOER performances.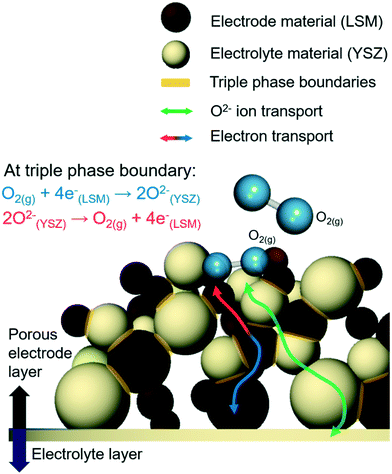 | ||
| Fig. 5 Schematic illustration of the triple phase boundaries (TPBs) in solid oxide electrochemical reactors (SOERs). | ||
Amongst the various reports about TPBs, fabricating three-dimensional (3D) structural components predictably has been reported as an effective means of increasing interfacial areas between electrode and electrolyte layers, especially when downsizing to the nanoscale. Inkjet printing is the sole technology that can print ceramic structures down to the micrometre scale with high reproducibility.
However, simply constructing 3D structured ceramic layers may not necessarily increase electrochemical performance, as extending ionic conduction path lengths in electrolyte phases result in ohmic potential losses, which may limit increases in current densities due to increased electrode|electrolyte interfacial areas (Fig. 6). Hence, optimal design of such 3D nanostructures needs to balance geometrical benefits with potential losses, requiring computational simulation of spatial distributions of electrical potential and local current densities.
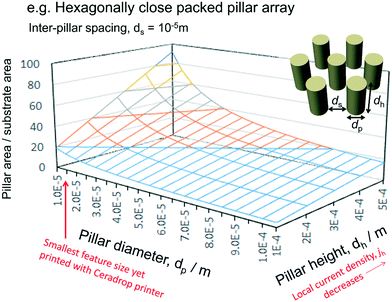 | ||
| Fig. 6 Effect on pillar area/substrate area of pillar diameter and height of hexagonally close packed pillar array on planar substrate. | ||
Masciandaro et al.36 reported the fabrication of honeycomb-like YSZ electrolyte by 3D inkjet-printing; the benefit of greater interfacial electrode|electrolyte area resulted in solid oxide fuel cells (SOFCs) with greater energy densities. A finite element model of the potential and current distribution in the 3D structure was developed using COMSOL software, to predict the SOFCs experimentally measured higher energy densities. (Fig. 7a–c) Such numerical simulations enable prediction of optimal geometrical structures for fabrication by inkjet printing, to focus experimental validations, decrease material requirements and decrease costs. Even present inkjet printing technology is capable37 of providing the bases of continuous conveyer belt-like, mass manufacturing processes, so potentially decreasing SOER fabrication costs and thereby energy costs, not only by increasing energy conversion efficiencies of SOERs, but also by increasing productivities. This could facilitate applications of SOERs, which could develop as the main systems globally for benign, stationary electrical or chemical energy sources.
 | ||
| Fig. 7 (a) Predicted effect of inkjet-printed 3D honeycomb structure on the power generation performance calculated through a simulation (dashed lines); (b) current and (c) voltage distributions throughout the 3D printed structure calculated by the numerical simulation (reproduced with permission36). | ||
2. Inkjet printing of ceramics
High-resolution fabrication of ceramics by 3D printers involves three steps: i) formulation of suitable inks, ii) optimisation of the printing technique to achieve the required resolution, and iii) sintering of printed structures.The inks used for printing ceramics are colloidal ceramic particles dispersed in a continuous phase (solvent) with additives that: a) ensure the physical properties of the ink are compatible with the printer and result in high-quality printed deposits, b) the dispersed particles are stable to aggregation, and c) the properties of the ink are optimised to provide a feature resolution suitable with the application of the finished product. This section covers the principles of each of these factors for piezoelectric DOD inkjet printing.
2.1. Ink physical properties
Inkjet printing requires ink dispersions to be stable to aggregation over long times. The formation and behaviour of ink droplets is controlled by surface tension, inertia, and viscosity. Printability of an ink can be characterised by four dimensionless numbers: Reynolds (Re) and Weber (We), defined in eqn (1) and (2), and Ohnesorge (Oh) and Capillary (Ca) numbers defined in eqn (3) and (4), respectively.27 | (1) |
 | (2) |
 | (3) |
 | (4) |
The predicted printability of a given ink and printer parameters, defined as the consistent ejection of droplets with reproducible geometry, differs between sources (Table 1). The Oh number, which according to eqn (3) is independent of ejection velocity, includes the relevant ink properties, so is an appropriate parameter for DOD printing conditions.38 When Oh−1 (often denoted ‘Z’) is too low, viscous forces dominate, opposing droplet ejection. When Z is too high, satellite drops form (Fig. 8a and b), another problematic phenomenon, for which several dimensionless relationships are given in Table 1 (Fig. 8).39
 | ||
| Fig. 8 Images of droplet ejection and flight for Z > 10 (a and b), and 1 < Z < 10 (c and d). Reproduced with permission.47 | ||
These constraints define a set of possible Re and We numbers for stable and practical droplet formation. Notably, the droplet formation process is not related directly to the particle radius (R), on which the stability of the ink depends critically. However, the viscosity of the dispersion is correlated strongly to the volume fraction of particles (ϕ), for which many relationships exist; several frequently used relationships are given in Table 2.
2.2. Particle charge and stability of dispersions to aggregation
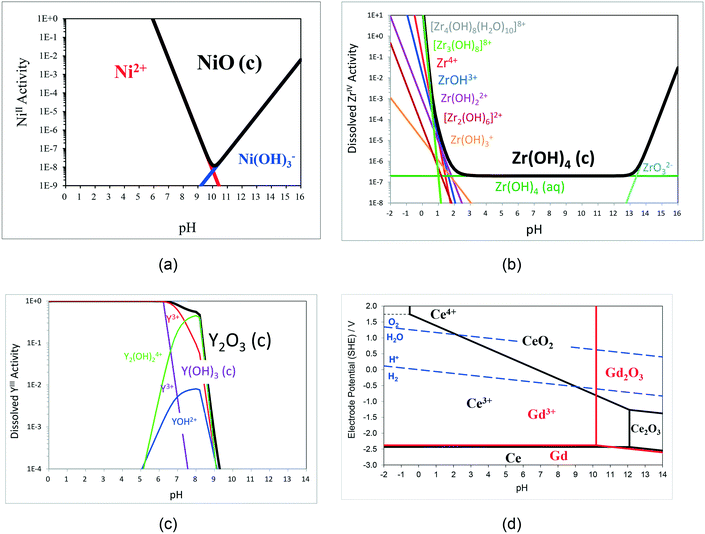
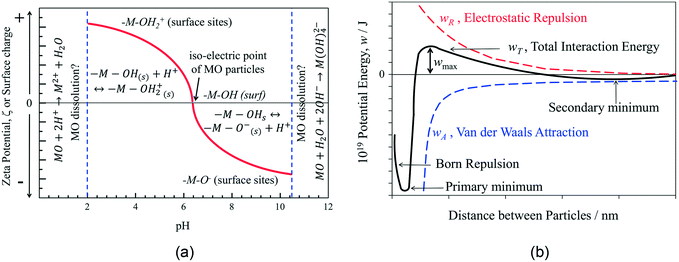
Fig. 9a shows the predicted pH-dependent solubility for NiO, which has a reported iso-electric point of ca. pH 8.55 The high NiII solubility at pH < 6 precludes such conditions for NiO inks. By contrast, Fig. 9b shows the predicted of ZrO2/Zr(OH)4 which is essentially insoluble at 2 < pH < 13. However, 8 mol% yttria-stabilised zirconia ((Y2O3)0.08(ZrO2)0.92: 8YSZ) is a common electrolyte phase in SOERs; yttria (Y2O3/Y(OH)3) is predicted to dissolve at pH < ca. 9 (Fig. 9c). Hence, selective dissolution of YIII species from YSZ occurs in the pH window 2 < pH < 9, changing particle (surface) compositions of the positively charged surfaces56 and constraining the pH range practically available for YSZ inks. The electrolyte gadolinia-doped ceria (Ce0.9Gd0.1O2−x), used in so-called intermediate temperature SOFCs, is also predicted to exhibit selective dissolution of GdIII species at pH < ca. 10, as unlike Ce2O3, CeIVO2 is essentially insoluble, according to Fig. 9d, again potentially constraining the pH range in CGO inks if GdIII dissolution kinetics are favourable. As Ce2O3 is so much more soluble than CeO2, Fig. 9d also predicts thermodynamically facile dissolution of CeIII species by reductive dissolution of CeO2, caused by the presence of oxidisable species in solution, e.g. by charged adsorbate species added to stabilise inks against aggregation. Similar behaviour is also predicted for positive electrode materials, such as lanthanum strontium manganite (La1−xSrxMnO3) and lanthanum strontium cobaltite ferrite (LaxSr1−xCoyFe1−yO3), the surface charge on particles of which is dependent on both pH and sensitive to electrode potential/redox conditions.57
For aqueous-based dispersions, the solution ionic strength is a critically important parameter as it determines the Debye length, κ−1, the effective thickness of the diffuse double layer, which decreases with increasing electrolyte concentration (e.g., for z = 1 and c∞ = 10−2, 1 and 102 mol m−3, κ−1 ≈ 100, 10 and 1 nm, respectively). Double layer interactions between particles can occur at separations <10/κ nm, as discussed below. Continuous phase viscosity is also important in determining shelf-lives of inks, as higher viscosities can decrease particle diffusion coefficients and hence aggregation kinetics.
Several strategies may be employed to induce inter-particle repulsion that are classified as electrostatic, stearic, or electro-stearic. The most common methods of inducing surface charges for electrostatic repulsion are varying the pH for aqueous solutions, and/or adding dispersants that adsorb on, and so further charge particle surfaces. Typically, the additive adsorbs on particle surfaces, imparting charge (electrostatic), or is sufficiently large to prevent dispersed particles becoming sufficiently close together that aggregation occurs (stearic), or a combination of both (electro-stearic). Therefore, the dispersant should be soluble in the selected solvent, and have an affinity for surfaces of the dispersed particles to ensure sufficient surface coverage for stabilisation. Additional dispersant properties that increase dispersion stabilities are polymeric chain lengths >10 nm and the presence of double bonds in the chain structure, facilitating polarisation and decreasing the Hamaker constant AH,60 which decreases inter-particle attractive potentials.
2.3. Stability to aggregation
The stability of an ink depends on limiting the rate of aggregation and sedimentation of the dispersed particles, due to repulsive inter-particle forces. Several inter-particle interactions are responsible for these processes, the most significant of which can be categorised into two groups: i) attractive van der Waals (wvdW) and depletion potentials (wex), and ii) repulsive electrostatic potentials (we).59,61 Repulsive electrostatic potentials arise from the charged surface sites on particles, with counter charge thermalised (effects of kBT energy dispersing ions to bulk solution) on the solution side of particle|solution interfaces. The properties and behaviour of such systems have been reviewed extensively.59The interaction energy between a pair of YSZ particles with different diameters, dispersed in water, was plotted and shown in Fig. 11. This shows that the stability (energy barrier to aggregation) of a dispersion with particles of 200 nm diameter is approximately 8 times greater than for particles of 50 nm diameter. As the attractive and repulsive contributions have different dependences on the separation, the total interaction potential-distance plot exhibits a maximum for zeta potentials, ζ > 30 mV. Such maxima constitute kinetic barriers to particle aggregation in dispersions used as inks.
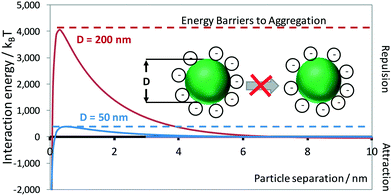 | ||
| Fig. 11 Effect on interaction energy of particle diameter and separation of YSZ particles in aqueous 10 mol m−3 KCl, stabilised by 0.2 mg m−2 Dispex A40 dispersant. | ||
2.4. Resolution
Two factors affect the resolution of printed structures: i) the maximum splat (spreading) diameters of droplets after impact with substrates (Dm); ii) the diameter of in-flight droplets (Di), corresponding to the minimum possible splat diameters after impact.The coffee stain effect occurs generally in ceramic inkjet printing, due to rates of solvent evaporation at droplet edges being greater than at droplet centres, causing inhomogeneous solidification and deposition of rings of particles, as shown schematically in Fig. 13 for low contact angles. These deposited particles pin the droplet contact line, resulting in a receding contact angle and increased mass transport of particles toward the edge of droplets, leading to formation of ring-like structures: the coffee stain effect, first reported71 in 1997.
 | ||
| Fig. 13 Schematic of formation of ring-like structure at the boundary of droplets in the coffee stain effect (reproduced with permission70). | ||
The phenomenon occurs if: i) contact angles are ‘pinned’, although this has been disputed,72 ii) solidification or drying occurs primarily by evaporation, and iii) the solvent meets the substrate at a non-zero contact angle. These conditions are usually fulfilled while inkjet printing ceramic dispersions.
The consequence of this effect is that Dm defines the diameter of the solid deposit after drying. There are several approaches to mitigate this effect, other than non-evaporative solidification, such as counteracting it with a Marangoni flow73 manipulating the solvent partial pressure, droplet spacing,74 droplet impact velocity,75 together with substrate and air temperatures.76
 | ||
| Fig. 14 (a) Effect of pulse duration on droplet velocity; (b) effect of voltage amplitude on droplet volume and velocity; (c) droplet volume relationship with time/inverse of frequency, tp = f−1, for a study with paraffin suspensions, normalised by τ, the optimal pulse time, Pt. Data for paraffin wax jetted at a frequency of 10 kHz and a pulse duration of 30 μs. Reproduced with permission.35 | ||
3. Inkjet printing of solid oxide electrochemical reactor components
Inkjet printing has been applied to produce functional layers of SOFCs and solid oxide electrolysers (SOEs) using a range of materials and conditions, reviewed below, for both green and sintered structures. The sintering conditions for optimal densification of successfully printed functional layers are given in Table 3.| Printed layer | Solvent | Printed material | Substrate material | Sintering temperature profile (hold time) | D m/μm | Electrochemical performance established | Ref. |
|---|---|---|---|---|---|---|---|
| Electrolyte | α-Terpineol | YSZ | Dense NiO–YSZ | 1400 °C | 360 (pre-sintered) | YES | 78 and 79 |
| Electrolyte | Propionic acid and propan-1-ol | CGO | Dense NiO–YSZ | 1100 ± 50 °C (2 h) | 500 (pre-sintered) | NO | 79 |
| Electrolyte | α-Terpineol-MeOH | CGO | Dense NiO–YSZ | 1400 °C (4 h) | 1000 (pre-sintered) | NO | 92 |
| Electrolyte | H2O-EtOH | YSZ | Green NiO–YSZ | 1. Firing at <700 °C for 48 h to remove organics2. 1300 °C (6 h) | 170 (post-sintered) | YES | 93 |
| Electrolyte | H2O | YSZ-SDC | Dense NiO–YSZ | 1400 °C (5 h) at 5 °C min−1 | Reported as 600 dpi but not measured | YES | 94 |
| Electrolyte | Unspecified | CGO | Dense LSM | 1300 °C (2 h) | Unreported, but > 200 μm | NO | 88 |
| Electrolyte | H2O | YSZ | Green NiO–YSZ | 1. Firing at 600 °C (6 h) at 4 °C min−12. Heating to 1500 °C (10 h) at 15 °C min−1 3. Cooling to room temperature at 4 °C min−1 |
35 (post-sintered) | YES | 31 |
| Electrolyte | α-Terpineol | YSZ | Dense NiO–YSZ | 1375 °C (2 h)Co-fired at 950 °C | Unreported | YES | 86 |
| Anode | α-Terpineol | NiO–YSZ | Green NiO–YSZ | ||||
| Anode | α-Terpineol + MeOH | NiO–CGO | Stainless steel 430 L powders | Co-sintered at 1000 and 1300 °C | 1500 | YES | 95 |
| Electrolyte | CGO | Green NiO–CGO | |||||
| Cathode | H2O and 1,5-pentanediol | LSCF | Dense CGO | 950 °C (2 h) in air | Reported as 600 × 300 dpi but not measured | YES | 96 |
| Cathode | α-Terpineol | LSCF | Glass | N/A | 80 (for ten overlapped splats) | NO | 97 |
| Cathode | H2O | LSCF-CGO | Dense CGO | 1000 °C (2 h) | 150 (pre-sintered) | YES | 98 |
| Cathode | α-Terpineol | LSM-YSZ | Dense YSZ | Co-sintered at 1200 °C (1 h) | Unreported | YES | 83 |
| Current collection | α-Terpineol | LSM | Green LSM-YSZ | ||||
| Electrolyte | α-Terpineol | YSZ | Green 3 mol% YSZ | Co-sintered at 1450 °C with a burnout stage at 300 °C | Unreported | NO | 91 and 99 |
| Anode | NiO | ||||||
| Interconnect | SLT | 99 | |||||
| Anode | NiO–YSZ | 1450 °C for 1 h | Unreported | N/A | 100 |
3.1. YSZ electrolyte system
The same group79 also reported the use of an electromagnetically driven print head with 100 μm ruby nozzle orifice and X-Y planar positioning system, to print YSZ ink onto 50 × 50 mm2 pre-sintered tape-cast NiO-8YSZ-CGO composite anodes of SOFCs. Ejection pressure and nozzle opening times were shown to affect droplet volume, velocity and hence deposit geometries.
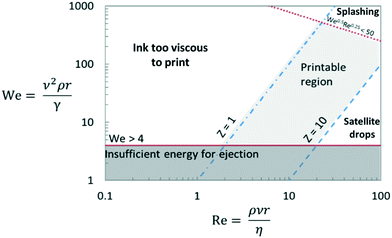
Being more environmentally benign, aqueous-based inks are preferable to primarily organic-based inks. For example, 50 nm YSZ particles were dispersed in 20 EtOH: 80 H2O, and a HP Deskjet 1000 printer with 20 μm radius nozzles used to fabricate gas-tight, 1.2 μm thick YSZ electrolyte layers.80 As shown in Fig. 15a, YSZ inks exhibited remarkable stability to aggregation over 100 days, evidenced by R(100days) = 50 nm. Electrolyte layers were printed from both concentrations of YSZ ink at a resolution of 600 × 300 dpi onto green NiO–YSZ substrates with volume ratios of 2![[thin space (1/6-em)]](https://www.rsc.org/images/entities/char_2009.gif) :
:![[thin space (1/6-em)]](https://www.rsc.org/images/entities/char_2009.gif) 3, having established their Weber–Reynolds numbers diagram, as shown in Fig. 15b, defining the conditions for printability.
3, having established their Weber–Reynolds numbers diagram, as shown in Fig. 15b, defining the conditions for printability.
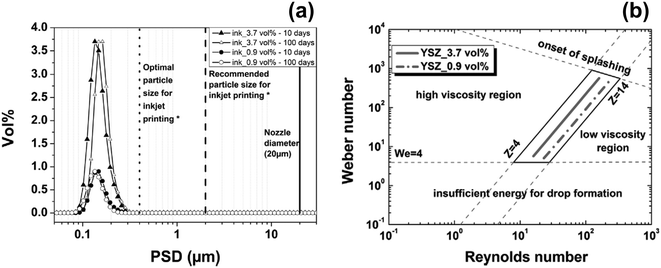 | ||
| Fig. 15 (a) Particle size distributions for 3.7 vol% and 0.9 vol% YSZ ink after milling for 10 days and after 100 days of storage (b) Weber–Reynolds numbers diagram defining the printability conditions for those YSZ inks.80 | ||
Two printing procedures: single droplet printing, and continuous printing were used with a waiting time of around 15 s between each print, to allow the solvent in the inks to evaporate and deposits to dry; the coffee stain effect was not evident after printing single, isolated droplets. Printing of multiple layers was necessary to cover defects formed during single-layer printing; 5 printed layers followed by sintering resulted in a gas tight electrolyte.
The effect of changing solids loading between 3–24 wt% and particle diameters of 194 and 115 nm (specific surface areas of 9.2 and 10.8 m2 g−1, respectively) was investigated for aqueous inks used to print YSZ electrolyte layers.81 Firstly, Dispex A40 (Ciba-BASF, UK) dispersant was dissolved at an equivalent concentration of 0.2 mg m−2 of particles; then YSZ particles were added and dispersed with an ultrasonic probe, subsequently centrifuged and syringe filtering to remove particles with diameters >800 nm. Polyethylene glycol 35![[thin space (1/6-em)]](https://www.rsc.org/images/entities/char_2009.gif) 000 was added to increase viscosity, then Natsurf 265 (Croda Chemicals, UK) to adjust surface tension at a concentration of 0.2 mg m−2, for all formulations.
000 was added to increase viscosity, then Natsurf 265 (Croda Chemicals, UK) to adjust surface tension at a concentration of 0.2 mg m−2, for all formulations.
A Ceradrop X-Serie piezoelectric DOD printer (Ceradrop, Limoges, France) with a DIMATIX Sapphire QS-256/30 AAA printhead (Fujifilm, USA), with nozzle diameters 52 μm, was used to deposit YSZ layers onto an un-sintered NiO–YSZ substrate. Initially, printed films cracked due to capillary forces arising in the films during drying. Avoiding aggregation of particles within the deposited droplets during drying was essential to mitigate cracking; that was achieved by avoiding (attractive) depletion potentials. The added polymer content significantly influences crack formation by inducing attractive depletion potentials between adjacent particles through drying. Hence, decreasing particle packing densities and allowing sufficient drying time between sequential printed layers, would increase their resistance to cracking. Sufficient drying times between sequentially printed films also ensured layer heights not to exceed critical cracking thicknesses of films.82
The most suitable ink composition was 24 wt% YSZ, 25 mg cm−3 PEG-35000, R = 97 nm, stabilised by 0.2 mg m−2 Dispex A40, and 0.2 mg m−2 Natsurf 265. This was used to print 12 layers with a square lattice droplet deposition pattern and a diameter overlap of 40%; Dm = 60 μm, Dm/Di = 1.6; the ejection velocity was 4.5 m s−1 (Oh−1 = 8.5). The printer settings were a voltage amplitude of 80 V, total Pt = 13 μs including an increase and decrease time of 2 and 5 μs, respectively, and a frequency of 2.8–5 kHz. Four minutes drying time were allowed between each layer, and the resulting layers were co-sintered at 1500 °C for 10 h. A LSM-YSZ composite was brush-coated onto the sintered YSZ layer and allowed to dry, followed by a pure LSM coating, then co-sintered; Fig. 16 shows the final densified structure.
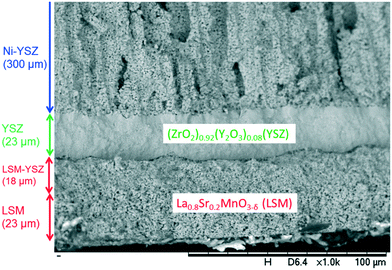 | ||
| Fig. 16 SEM image of cross-sectional structure of LSM|LSM–YSZ|YSZ|Ni–YSZ SOFC with electrolyte fabricated by inkjet printing.81 | ||
A Dimatix DMP 2831 (FujiFilm, USA) printer with DIMATIX 11610 cartridges was used to print the structures, with a nominal 10 pL droplet setting, and printhead nozzle diameter of 21 μm.32 Ten layers of NiO–YSZ were printed onto a supporting, green, NiO–YSZ tape (60![[thin space (1/6-em)]](https://www.rsc.org/images/entities/char_2009.gif) :
:![[thin space (1/6-em)]](https://www.rsc.org/images/entities/char_2009.gif) 40 wt% ratio, respectively) at a stable droplet ejection rate of 3 kHz with pulses of 32 V and 2.94 μs. A 15 μm droplet overlap in a square deposition lattice was used, with a substrate heated to 80 °C to increase drying rates; a square pattern with 15 μm droplet separation was used for complete coverage. Twenty layers of the electrolyte layer were printed on top of the composite anode layer with the same printer settings. After sintering, the printed layers could be distinguished by SEM, and differed depending on the particle size of NiO in the ink as shown by Fig. 17. Furthermore, the layers fabricated using the 150 nm particles had a non-uniform porosity, attributed to aggregate formation.82
40 wt% ratio, respectively) at a stable droplet ejection rate of 3 kHz with pulses of 32 V and 2.94 μs. A 15 μm droplet overlap in a square deposition lattice was used, with a substrate heated to 80 °C to increase drying rates; a square pattern with 15 μm droplet separation was used for complete coverage. Twenty layers of the electrolyte layer were printed on top of the composite anode layer with the same printer settings. After sintering, the printed layers could be distinguished by SEM, and differed depending on the particle size of NiO in the ink as shown by Fig. 17. Furthermore, the layers fabricated using the 150 nm particles had a non-uniform porosity, attributed to aggregate formation.82
 | ||
| Fig. 17 Cross sectional SEM images of sintered, printed YSZ electrolyte and NiO–YSZ composite layers. (a) Layers produced using NiO particles of R = 15 nm; 12 μm thick electrolyte (top) and composite NiO–YSZ interlayer (bottom). (b) Layers produced using NiO particles of R = 150 nm; 6 μm thick YSZ electrolyte layer and composite NiO–YSZ interlayer. Reproduced with permission.82 | ||
Further development aimed to print complete SOFCs by printing four functional layers on top of a tape-casted NiO–YSZ support layer (55/45 wt% respectively): a NiO–YSZ anode interlayer, a YSZ electrolyte, a LSM-YSZ composite cathode, and a LSM current collection layer.83 The same Dimatix DMP 2831 printer was used to print each layer with a jetting amplitude of 32 V, 2.944 μs pulse, a slew rate of 0.93 V μs−1, and at a frequency of 3 kHz. Ten layers of the composite anode ink were printed onto the substrate at 80 °C, followed by bisque firing at 950 °C. Twelve layers of the electrolyte ink were then printed onto the composite NiO–YSZ layer, with the reservoir temperature set at 48 °C. After sintering at 1400 °C for 2 hours, twenty layers of the LSM-YSZ layer were printed onto the electrolyte, with the ink reservoir temperature at 58 °C. The electrolyte ‘substrate’ structure was set at 100 °C to dry the LSM–YSZ deposits. Thirty layers of the LSM ink were then printed at an ink temperature of 48 °C to complete the SOFC, prior to its sintering.
The substrate temperature for this step was critical for drying behaviour. When the temperature was too low (40–70 °C), the ink spread beyond the SOFC area, whereas when the temperature was too high, coffee staining resulted; the optimum temperature was 100 °C. After sintering, the inkjet printed SOFC's performance and specifically that of the printed cathode, was determined to be lower than that fabricated by pasting. The inkjet-printed cathode showed tighter pore structure, which was attributed to non-optimised cathode layer ink formulation. This comparative study highlighted the need for optimised ink formulation, printing parameters, and sintering processes to fully exploit 3D printing for SOER applications.
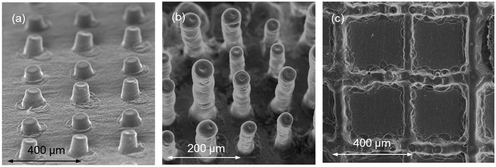 | ||
| Fig. 18 (a) 50 and (b) 180 layers of YSZ printed to fabricate micro-pillar arrays; (c) a YSZ square lattice printed onto a NiO–YSZ substrate. Reproduced with permission.31 | ||
3.2. Ceria electrolyte systems
A La0.6Sr0.4Co0.2Fe0.8O3 (LSCF) electrode layer was inkjet-printed onto a 200 nm thick dense CGO barrier layer deposited by pulsed laser deposition (PLD) on a sintered NiO–YSZ|YSZ substrate using a HP Deskjet 1010 DOD inkjet printer with a resolution of 600 × 300 dpi.85 However, the nozzle diameter and mass fraction of particles, and hence ink density, were not reported, so Oh−1 of the inks was unknown. The ink was prepared by dry ball milling commercial LSCF powder (Kceracell Co. Ltd) for 36 h, then filtered to remove larger particles with an unspecified sieve. The resulting particles were dispersed in water with DISPERBYK-2012 (BYK-Chemie GmbH) and to check the effect of 1,5-pentanediol, three different types of LSCF inks containing 0, 11, and 20 wt% of 1,5-pentanediol were prepared. When the concentration of 1,5-pentanediol was less than 20 wt%, ‘fault lines’ were observed in the printed layers, suggesting that the physical properties of the inks lay outside the Oh−1 printable range. Dynamic light scattering (DLS) measurements showed little change in sizes of ca. 200 nm LSCF particles over 34 days, indicating the near absence of aggregation in the dispersions.
The (Newtonian) viscosity of the ink was 2.93 mPa s, suggesting that the particle loading was low; unfortunately, the surface tension and printer ejection duration, pulse magnitude and frequency were not reported. To tailor the porosity of the LSCF layer, by leaving gaps between splats, the ‘greyscale’ setting for printed layers was adjusted from a luminosity of 50–200, in increments of 50, where 0 represents black and 255 white. The number of printed layers for each was 40, 80, 160, and 200, with corresponding porosities of 10.2%, 12.7%, 13.6% and 16.2%, respectively; the drying time between each layer was unreported. The printed structures were dried for 24 h, then sintered at 950 °C for 2 h. Cracking was evident for luminosities 50, 100, and 150, attributed to relatively slow rates of evaporation of the solvent at higher particle concentrations, though evaporation rates were unreported (Fig. 19). Lower evaporation rates increase the ability of a printed film to resist capillary stresses that arise during drying of printed films, decreasing the extent of cracking. Furthermore, the thicknesses of printed layers decreased from 110 and 20 nm for luminosity values from 50–200, so cracking may have been mitigated at high luminosities because film thicknesses were less than the critical cracking thickness. The printed LSCF layers were about 5 μm thick, within which porosity was controlled by varying the luminosity, so the reproducibility of the ‘microstructures’ is questionable.
 | ||
| Fig. 19 Cracking in the sintered LSCF layers at a luminosity setting of 50 (a), 100 (b), and 150 (c). Reproduced with permission.85 | ||
The printability of 3.5–12 wt% LSCF particles (R < 1.6 μm) dispersed in α-terpineol with 0.03–0.4 wt% polymeric ethyl cellulose dispersant was studied using a Dimatix DMP 2831 DOD piezoelectric printer (Fujifilm, USA) with 21.5 μm nozzles printer.86 The dispersant was added to both stabilize the dispersion and to provide strength to the green printed films. After dispersing the LSCF by ball milling for 1 week, the different compositions resulted in a surface tension of γ = 34 mN m−1 and a temperature-dependent viscosity of 2 < η < 10 mPa s at 40 < T < 60 °C (3 < Z < 24). At T < 40 °C, the viscosity was too high for ejection and at T > 60 °C, drying occurred at the nozzle tip causing blockage. Layers were printed onto dense 50 μm thick YSZ pellets; the pulse amplitude (10–50 V) and duration (2.64–30 μs) at a frequency of 2 kHz were varied to alter the ejection velocity up to a maximum of 9 m s−1. As shown in Fig. 20a, the Weber number (We) was varied in the range 0 < We < 57; at We > 35, satellite droplets and splashing were observed. At We < 35 and Z ≤ 24, reproducible droplets were observed, indicating a different printability constraint to what is typically assumed. These setting resulted in a droplet volume of 7 pL and a resolution of 400 dpi with a feature resolution of 60–90 μm.
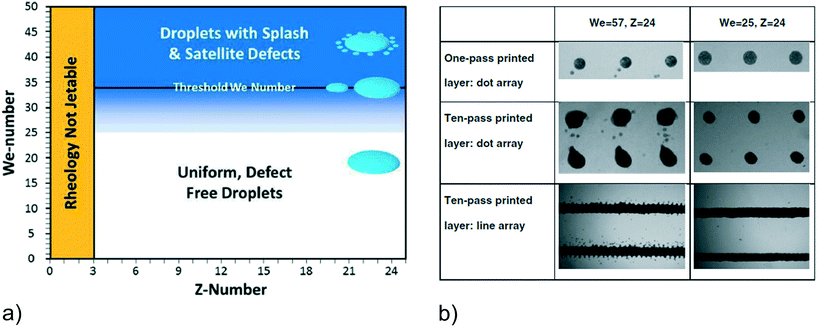 | ||
| Fig. 20 a) Schematic illustration of three printing zones: unjettable, stable defect-free droplets, and droplets with splashes and satellites defects, determined by the values of Weber and Z numbers. b) Optical images of the printed micropatterns, e.g. one-layer dot array, multi-layer dot array, and multilayer line arrange, obtained at below (We = 25) and above (We = 57) the threshold values. The images presented are obtained using α-terpineol + 12 wt% LSCF on glass substrate.86 | ||
Fig. 20b shows the micropatterns obtained using α-terpineol with 12 wt% LSCF on glass substrates: one-layer dot array, ten-pass printed layer dot array, and ten-pass printed layer line array, printed below or above the Weber number threshold; similar results were obtained on YSZ substrates. Apparently, at the optimal rheological and kinematic jetting conditions, e.g. Weber number below the threshold and for Z = 3–24, defect-free dot arrays and 1D line arrays were achieved. Multiple layers were printed, supposedly each with a thickness of 100 nm, which appears to be too small as particle sizes were up to an order of magnitude larger. Three or more printed layers were required for a defect-free surface, as one layer produced a surface coverage of 90%, though information on droplet overlap and lattice spacing were omitted. A porous structure suitable for gas diffusion resulted, suitable for SOFC and SOE applications.
![[thin space (1/6-em)]](https://www.rsc.org/images/entities/char_2009.gif) :
:![[thin space (1/6-em)]](https://www.rsc.org/images/entities/char_2009.gif) LSCF ratios of 50
LSCF ratios of 50![[thin space (1/6-em)]](https://www.rsc.org/images/entities/char_2009.gif) :
:![[thin space (1/6-em)]](https://www.rsc.org/images/entities/char_2009.gif) 50 to 40
50 to 40![[thin space (1/6-em)]](https://www.rsc.org/images/entities/char_2009.gif) :
:![[thin space (1/6-em)]](https://www.rsc.org/images/entities/char_2009.gif) 60 did not heterocoagulate and was printable. The particle size distribution of the composite ink was bimodal, with diameters of 80 and 230 nm. Sedimentation of agglomerated CGO particles was detected after 48 hours, presumably due to the low zeta potential of the LSCF particles. To prevent sedimentation, the dispersing process was optimised by staged addition of the CGO after the LSCF had been dispersed. The ink at pH 10, 40
60 did not heterocoagulate and was printable. The particle size distribution of the composite ink was bimodal, with diameters of 80 and 230 nm. Sedimentation of agglomerated CGO particles was detected after 48 hours, presumably due to the low zeta potential of the LSCF particles. To prevent sedimentation, the dispersing process was optimised by staged addition of the CGO after the LSCF had been dispersed. The ink at pH 10, 40![[thin space (1/6-em)]](https://www.rsc.org/images/entities/char_2009.gif) :
:![[thin space (1/6-em)]](https://www.rsc.org/images/entities/char_2009.gif) 60 (vol%) CGO
60 (vol%) CGO![[thin space (1/6-em)]](https://www.rsc.org/images/entities/char_2009.gif) :
:![[thin space (1/6-em)]](https://www.rsc.org/images/entities/char_2009.gif) LSCF and 5 wt% solids had η = 1 mPa s and particles with a bimodal size distribution normally distributed about R = 40 and 115 nm.
LSCF and 5 wt% solids had η = 1 mPa s and particles with a bimodal size distribution normally distributed about R = 40 and 115 nm.
The ink was printed onto a dense NiO–CGO|CGO substrate with 50 and 600 μm thick layers, respectively, using a Pico Jet-1000 printer (Microjet Co. Ltd., Taiwan) with nozzle diameters of 50 μm, producing droplet volumes of 50 pL. Solid deposits had diameters of 150 μm and exhibited the coffee staining effect on a dense CGO substrate, the preparation of which is outlined elsewhere.87 The thickness of the printed LSCF![[thin space (1/6-em)]](https://www.rsc.org/images/entities/char_2009.gif) :
:![[thin space (1/6-em)]](https://www.rsc.org/images/entities/char_2009.gif) CGO layer was 2 μm (Fig. 21); due to the small particles, the cathode porosity was low, so gas permeation to reaction sites was hindered significantly, resulting in poor SOFC performance.
CGO layer was 2 μm (Fig. 21); due to the small particles, the cathode porosity was low, so gas permeation to reaction sites was hindered significantly, resulting in poor SOFC performance.
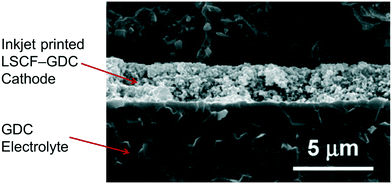 | ||
| Fig. 21 SEM image of the cross section of the printed cathode layer. Reproduced with permission.87 | ||
 | ||
| Fig. 22 (a) Hexagonal, and (b) square CGO microstructures of 12 μm depth each, comprising 20 printed layers. Reproduced with permission.88 (c) photograph of the printed LSM deposited using aqueous-based ink. | ||
3.3. Bi-layer electrolyte system
Green structures of Sm0.5CoO3 (SSC) and Sm0.2Ce0.8O1.9 (SDC) have been inkjet-printed using aqueous-based inks to fabricate a pre-sintered porous cathode layer.89 The 0.5–0.7 μm SSC/SDC particles were mixed in a mass ratio of 70:30 and dispersed in water at a concentration of 5 wt% by ultrasonicating for 30 minutes. 2.5 wt% PEG-4000 was added as a pore former; polyacrylic acid and glycerine were added at 0.75 wt% and 1.25 wt%, respectively, to modify viscosity and increase stability, resulting in no visible sedimentation over 3 days. The physical properties of the ink were ρ = 1.05 g cm−3, γ = 71.50 mN m−1, and η = 8.74 mPa s giving a Z = 4.54. A modified HP Deskjet 2668 printer with nominal resolution 600 dpi was used to print 45 porous cathode layers, 15 μm thick onto a prefabricated half-cell with a NiO/YSZ anode and YSZ electrolyte and SDC barrier layer. Such inkjet printed layers containing pore formers produced electrochemical performances comparable to that of a cell fabricated using conventional wet powder spraying.Another aqueous-based YSZ ink formulation was used to print electrolyte layers by thermal inkjet printing with a modified HP Deskjet 2668 printer with estimated nozzle diameters of 21 μm.90 20 wt% YSZ particles with R = 37 nm were dispersed by ultrasonication for 30 minutes in distilled water, to which was added polyethylene glycol-4000 (PEG-4000) at 25 wt% relative to the YSZ particles, corresponding to values of η, γ, ρ, and Z at 25 °C of 5.13 mPa s, 56.5 mN m−1, 1.2 g cm−3, and 7.4, respectively. The ink was printed onto a porous, pre-sintered NiO–YSZ substrate tape with sufficient porosity to avoid the coffee stain effect. Layers of 1.5 μm thickness were printed with 30 s intervals to allow for drying; due to some contamination of Ni from the anode substrate, the electrolyte had residual electronic conductivity, which was more significant with fewer printed layers, as expected. Consequently, the anode substrate was printed with four YSZ layers, as shown in Fig. 23a, onto which LSM was wet sprayed subsequently.
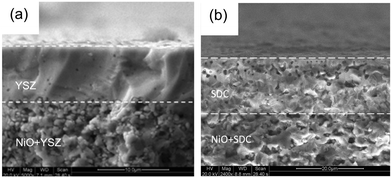 | ||
| Fig. 23 SEM micrographs showing (a) printed YSZ on Ni–YSZ, and (b) printed SDC on Ni–SDC; post sintering. Reproduced with permission.90 | ||
A Sm0.2Ce0.8O1.9 (SDC) interlayer was inkjet printed from an aqueous ink with composition 10 wt% SDC, 50 wt% PEG-4000, and 10 wt% triethanolamine (TEOA), both relative to the SDC, corresponding to values of η, γ, ρ, and Z of 6.7 mPa s, 70 mN m−1, 1.1 g cm−3 and 5.9, respectively, producing stability to aggregation over 5 days. However, Dm and u0 were unreported, so the predictions of resolution, satellite formation and/or splashing were omitted. As evidenced by the closed pores present in the structure shown in Fig. 23b, before sintering, the SDC interlayer required a greater time interval for drying than the printed YSZ electrolyte onto which it was printed, due to the decreased solids and high organic contents. Subsequently, a Ba0.5Sr0.5Co0.8Fe0.2O3−δ (BSCF) cathode was wet-sprayed on top of the SDC to complete the SOFC structure.
Dense layers of NiO, YSZ, and lanthanum-doped strontium titanate (SLT) have been deposited with a Dimatix DMP 2831 (Fujifilm, USA) onto a green, 3 mol% partially stabilised zirconia (3 mol% YSZ) substrate for a segmented-in-series SOFC architecture. Particle sizes were <1 μm, but particle size distributions were not reported. Particles were dispersed in α-terpineol and stabilised with Solsperse 13![[thin space (1/6-em)]](https://www.rsc.org/images/entities/char_2009.gif) 940 at 2 wt% relative to the weight of the particles for all phases, by ball milling with zirconia beads for ca. 24 h. The viscosities of the NiO and YSZ inks were ca. 27 and 46 mPa s, respectively, at an unreported temperature, so the temperature of the printhead was raised to 50 °C to decrease the viscosities to the recommended range of 10–12 mPa s. The inks were printed onto each other sequentially, heated to 300 °C to combust organics and then co-sintered at 1450 °C, to form the arrangement 3 mol% YSZ|SLT|NiO|YSZ with an approximate thickness of 15 μm for each layer. A patent application was made for the above ink compositions.91
940 at 2 wt% relative to the weight of the particles for all phases, by ball milling with zirconia beads for ca. 24 h. The viscosities of the NiO and YSZ inks were ca. 27 and 46 mPa s, respectively, at an unreported temperature, so the temperature of the printhead was raised to 50 °C to decrease the viscosities to the recommended range of 10–12 mPa s. The inks were printed onto each other sequentially, heated to 300 °C to combust organics and then co-sintered at 1450 °C, to form the arrangement 3 mol% YSZ|SLT|NiO|YSZ with an approximate thickness of 15 μm for each layer. A patent application was made for the above ink compositions.91
3.4. Effect of inkjet printing technology on electrochemical performances
Inkjet printing for SOFCs/SOEs has been successful in achieving thin and gas-tight electrolyte layers to decrease ohmic potential losses. Fig. 24 shows the effect of printed electrolyte thickness on SOFC power densities, increasing the performance by a factor of 4.5 by decreasing the electrolyte thickness by an order of magnitude. YSZ electrolytes with only 2 printed layers (equivalent to ca. 0.6 μm), were tested and found to be non-gas-tight using a 3.7 wt% ink.80 Thus, to decrease electrolyte thicknesses further, lower weight-percentage inks with smaller particles are required, as more printed layers are preferable to lower the probability of defects in the printed film. Dense printed functional layers have also been employed successfully for a SOER operating in electrolysis mode.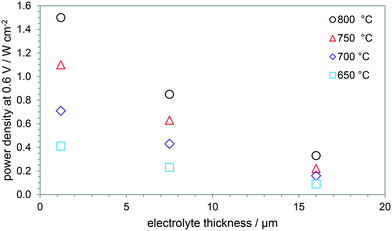 | ||
| Fig. 24 Effect of electrolyte thickness on power densities at 0.6 V applied potential difference for 650–750 °C.80,83,101 | ||
Printing a dense interlayer between electrolyte and electrode phases allows a wider range of materials to be used by obviating chemical and/or thermal expansion mismatches,90 thereby enabling enhanced electrochemical performance. For example, 66% increase in peak power density at 750 °C was reported for a BSCF cathode with SDC interlayer, compared to that for a LSM cathode.
However, inkjet printing of electrodes still poses challenges, mainly concerning achievable microstructures. A 40% decrease in power densities for printed LSM-YSZ|LSM cathode and current collection layer (Fig. 25) was reported83 and attributed to non-optimised microstructure of the printed layers. Nevertheless, high reproducibility for inkjet printed SOFCs was achieved.
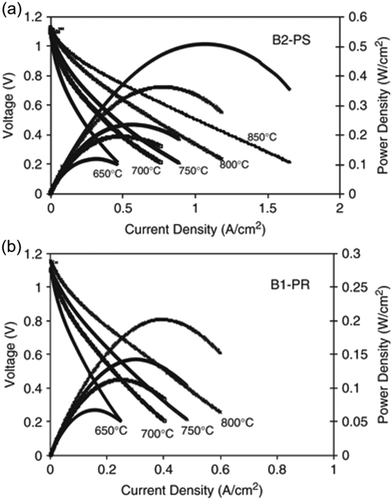 | ||
| Fig. 25 Effect of current density on cell potential difference for (a) conventional hand-pasted and (b) printed electrode. Reproduced with permission.83 | ||
SOFC performances can be increased by combining inkjet-printed electrode layers, with smaller pores, and a painted electrode on top with larger pores, creating a graded structure. Printed electrode, painted electrode, and printed and painted layers within the electrode had power densities of 0.11, 0.54, and 0.71 W cm−2, respectively; i.e. higher TPBs densities are achieved at electrode|electrolyte interfaces, and the open porosities within painted layers impede mass transport to a lesser extent (Fig. 26).98 The smaller sized pores were achieved by using nanometre diameter particles in the ink. However, smaller particles sinter to produce higher densities; hence, dense skin layers can form at the top of printed layers, decreasing mass transport rates of gaseous reactants and products significantly. Varying the pore former size/concentration in the inks would be required to print a porosity-graded structure. In addition to the particle size and sintering temperatures,102 the substrate can also influence porosity, because if the shrinkage properties of the electrode are not matched to the interlayer or electrolyte, delamination or undesirable microstructure with low porosity can result.
 | ||
| Fig. 26 Graded electrode micro-structure incorporating inkjet printing and conventional pasted electrodes with (a) scanning electron micrograph and (b) schematic. Reproduced with permission.98 | ||
Changing the printing parameters, e.g. droplet overlap, could also vary the porosity and thickness of the printed layers. An increase of ca. 7% in porosity, facilitated by decreasing the droplet overlap, resulted in approximately 8–12% increase in peak power density at identical total electrode thicknesses. Electrochemical impedance spectroscopy suggested this was due to decreased electrode polarization. However, with porosities in the range 10.2–16.2%, there is scope for further improvement.103
Ink-jet printing can also be used to deposit co-catalysts onto electrodes,79 whereby an impregnation of Co(NO3)2·6H2O at 40 °C resulted in the subsequent most uniform deposition of Co3O4 by thermal decomposition. The electrode resistance was decreased by ca. 75% following the printing infiltration technique.
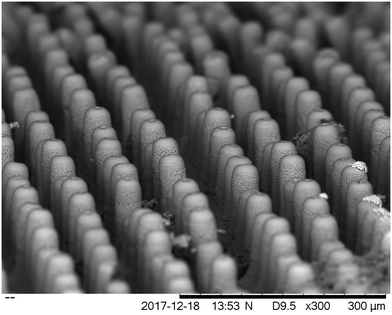
Fig. 27 shows a photomicrograph of a micropillar YSZ array coated with LSM, for which the performance was determined as an oxygen electrode operating in electrolyser mode.82 These types of tailorable and reproducible electrodes open new routes for advanced electrodes, so-called ‘electrodes-by-design’. These could aid fabrication of graded microstructures for improved reactor performance, in terms of percolated TPBs, decreased degradation rates, and provide 3D model electrodes for validation of computational model predictions. The spatial distributions of electrical potential and current densities are usually inhomogeneous in electrochemical systems,104,105 dependent on system geometries, electrolyte and electrode conductivities, and kinetic and transport overpotentials. Hence, printed structures shown in Fig. 27 with up-scaled electrode|electrolyte interfacial areas will not exhibit a corresponding increase in current density. Here, modelling is required to predict spatial distributions of potential and current densities to optimise geometries, in silico, prior to printing and subsequent experimental validation.
4. Future challenges
Inkjet printing has been used successfully to fabricate SOERs with competitive performances compared to reactors fabricated by conventional methods. However, to maximise the impact inkjet printing can have on such applications, advancements are needed in: i) improving resolution, ii) controlling porosity in printed structures, and iii) creating 3D ‘cavities’ to increase TPB densities.In the first instance, resolution depends on Dm and Di. To decrease Di, hardware improvements of inkjet printers must be made, such as decreasing nozzle diameters and improving the sensitivity of the droplet ejection hardware. It is possible to eject droplets <1 pL volume using piezoelectric droplet generation (6.2 μm radius);106 using electrohydrodynamic droplet generation, a resolution of 2 μm has been achieved for non-ceramic materials.107 This feature size could be decreased by ca. 30% for fabrication of ceramic components, due to shrinkage during densification when printed onto green substrates. To print particulate dispersions successfully at these resolutions, the diameter of dispersed ceramic particles would need to be decreased to ca. 10 nm, requiring the development of new processes to synthesise particles at this scale. Alternatively, printing dissolved (metal nitrate) precursors and producing ceramic phases in situ could be a possibility to mitigate practical difficulties resulting from instability of the colloidal dispersions and reduced droplet volume. To decrease Dm, the interaction of the ink with the substrate should be optimised. As the droplet spreading process is essentially a dissipation of kinetic energy, the surface of the substrate could be e.g. roughened and the viscosity increased within the printability constraints, increasing frictional and viscous energy dissipation, respectively. However, the decreased droplet volume for the increase in resolution possibly will lead to increased fabrication times, which is an additional future challenge for inkjet printing.
Secondly, hitherto the porosity in printed electrodes has been too low for adequate rates of mass transport of reactants and products to and from reaction sites. There are two routes to increase porosities, the simplest being incorporation of a sacrificial pore-former such as poly(methyl methacrylate) into the precursor inks that provides porosity after its combustion.108 The second route involves formulating multiple inks with varying composition (particle sizes, relative particle proportions, pore-former concentration) that may be printed sequentially on top of each other, to fabricate a so-called ‘functionally graded material’ with a continuous or step-changing composition.109 Alternatively, the printing parameters, such as droplet overlap, may be modified for sequentially printed layers of a given ink formulation to increase porosities nearer the bulk gas channels and so increase mass transport rates.
Thirdly, to create 3D cavities by inkjet printing, a sacrificial phase should be deposited to provide structural support to layers of ceramic printed subsequently. Furthermore, that phase should not auto-ignite within the temperature range at which sintering occurs sufficiently between ceramic particles, so that they may stand alone without support from the sacrificial phase. In addition, the sacrificial phase should be removed by heat treatment, ideally by complete combustion, so the resulting structure is not contaminated by residues. Consequently, the minimum temperature is ca. 1000 K, which precludes hydrocarbons.110 To-date, cavities ca. 200 μm tall and 400 μm wide have been fabricated with a carbon particle sacrificial phase; these dimensions are too large to affect the electrochemical performance of SOER electrodes, so research should be undertaken to decrease the dimensions of cavities.
5. Conclusions
Reversible SOERs offer the potential for an efficient, grid-scale, and inter-seasonal energy storage capability that can balance the increasingly problematic intermittency of renewable energy supply to electrical power grids. The performance of these devices is limited by poor control over electrode microstructure, due to conventional powder-mixing fabrication techniques such as screen printing and tape casting. Therefore, a number of AM techniques, including laser lithography, micro-extrusion, and 3D inkjet printing offer the potential to fabricate electrode architectures with high reproducibility at the micro-scale. Of these technologies, 3D inkjet printing has been shown by evidence presented above, to be the most applicable to SOER electrodes, as it offers comparatively high-resolution, low material waste, and could be incorporated in manufacturing processes.The literature has been reviewed on the formulation of inks for inkjet printing and on the fabrication of the functional layers of SOERs by inkjet printing. Most of the publications on the use of inkjet technology for the additive manufacture of ceramics involves piezoelectric DOD systems. Dense and porous, ionically- and electronically-conducting phases have been inkjet-printed and utilised as SOER electrodes and electrolytes. Inkjet-printed YSZ electrolytes with thicknesses of <2 μm have been fabricated with comparable power densities to those fabricated by conventional techniques. Furthermore, porous composite electrodes have been inkjet printed, and their performances in SOFCs have been determined. However, the porosity of printed composite layers was sufficiently low to cause mass transport limitations, and the microstructures within those layers remained uncontrollable as the inks contained multiple phases. To control microstructure, single-phase inks should be formulated and printed to localise the phases to pre-determined positions. The effects of inkjet printing on long-term degradation processes and rates has yet to be reported. Hence, the full potential of 3D inkjet-printed electrodes has yet to be realised.
3D YSZ structures with lateral resolutions of ca. 35 μm and 1 μm vertically have been reported and could provide sufficient microstructural control over electrodes to enhance electrochemical performance, but this has yet to be established. In addition, to match the output current density of conventionally fabricated reactors, the resolution (smallest feature size) of inkjet printing should decrease by an order of magnitude to achieve comparable TPB densities. Hence, it is essential to decrease the volume of ejected droplets and droplet spreading on the substrate. A resolution of ca. 2 μm has been realised by electrohydrodynamic inkjet printing of transistors, so could be applied to SOER fabrication in the future. Due to the decrease in droplet volume required to increase resolution, inevitably fabrication times would increase. Therefore, it may be beneficial to combine multiple AM techniques to fabricate the different functional layers and auxiliary components of practical SOERs.
In conclusion, inkjet printing offers superior capabilities of microstructural engineering that are critically important to improve SOER electrochemical performances, notably in minimising electrolyte layer thicknesses, which otherwise make a significant contribution to ohmic potential losses. As inkjet technology improves, better control over structural parameters, porosity and enhanced percolating TPB densities will become available. Compared to conventional fabrication techniques, inkjet printing uses far less energy, fabrication time and amounts of precursors, with negligible waste, offering the prospect of environmentally benign fabrication and manufacturing of more energy efficient SOERs and other such devices requiring similar resolutions.111
Nomenclature
Conflicts of interest
There are no conflicts to declare.Acknowledgements
The authors thank Shell Global Solutions International B. V. for a research contract providing post-doctoral research associateships for S. K. and I. J.References
- S. Chu and A. Majumdar, Nature, 2012, 488, 294 CrossRef CAS PubMed.
- I. Gyuk, Energy Storage Safety Strategic Plan, United States Department of Energy, 2014.
- B. Dunn, H. Kamath and J.-M. Tarascon, Science, 2011, 334, 928 CrossRef CAS PubMed.
- J. A. Turner, Science, 1999, 285, 687 CrossRef CAS PubMed.
- S. H. Jensen, C. Graves, M. Mogensen, C. Wendel, R. Braun, G. Hughes, Z. Gao and S. A. Barnett, Energy Environ. Sci., 2015, 8, 2471 RSC.
- M. Z. Jacobson, Energy Environ. Sci., 2009, 2, 148 RSC.
- J. A. Turner, Science, 2004, 305, 972 CrossRef CAS PubMed.
- M. Z. Jacobson, W. G. Colella and D. M. Golden, Science, 2005, 308, 1901 CrossRef CAS PubMed.
- R. M. Ormerod, Chem. Soc. Rev., 2003, 32, 17 RSC.
- A. Ursua, L. M. Gandia and P. Sanchis, Proc. IEEE, 2012, 100, 410 CAS.
- United States Department of Energy, ‘Types of Fuel Cells’, https://www.energy.gov/eere/fuelcells/types-fuel-cells, (accessed 03-Oct-21).
- D. Ferrero, A. Lanzini, M. Santarelli and P. Leone, Int. J. Hydrogen Energy, 2013, 38, 3523 CrossRef CAS.
- C. Graves, S. D. Ebbesen, M. Mogensen and K. S. Lackner, Renewable Sustainable Energy Rev., 2011, 15, 1 CrossRef CAS.
- K. Eguchi, H. Kojo, T. Takeguchi, R. Kikuchi and K. Sasaki, Solid State Ionics, 2002, 152–153, 411 CrossRef CAS.
- B. C. H. Steele and A. Heinzel, Nature, 2001, 414, 345 CrossRef CAS PubMed.
- A. Weber and E. Ivers-Tiffée, J. Power Sources, 2004, 127, 273 CrossRef CAS.
- H. Uchida, S. I. Arisaka and M. Watanabe, Electrochem. Solid-State Lett., 1999, 2, 428 CrossRef CAS.
- N. H. Menzler, J. Malzbender, P. Schoderböck, R. Kauert and H. P. Buchkremer, Fuel Cells, 2014, 14, 96 CrossRef CAS.
- J. R. Wilson, W. Kobsiriphat, R. Mendoza, H.-Y. Chen, J. M. Hiller, D. J. Miller, K. Thornton, P. W. Voorhees, S. B. Adler and S. A. Barnett, Nat. Mater., 2006, 5, 541 CrossRef CAS PubMed.
- J. Will, A. Mitterdorfer, C. Kleinlogel, D. Perednis and L. J. Gauckler, Solid State Ionics, 2000, 131, 79 CrossRef CAS.
- W. Feng, W. Wu, C. I. Jin and D. Ding, Electrochem. Soc. Interface, 2020, 29, 47–53 CrossRef CAS.
- A. M. Sukeshini, B. Habibzadeh, B. P. Becker, C. A. Stoltz, B. W. Eichhorn and G. S. Jackson, J. Electrochem. Soc., 2006, 153, A705 CrossRef CAS.
- J. P. Kruth, CIRP Annals, 1991, 40, 603–614 CrossRef.
- S. H. Huang, P. Liu, A. Mokasdar and L. Hou, Int. J. Adv. Des. Manuf. Technol., 2013, 67, 1191 CrossRef.
- J. Hoerber, J. Glasschroeder, M. Pfeffer, J. Schilp, M. Zaeh and J. Franke, Procedia CIRP, 2014, 17, 806 CrossRef.
- Q. Fu, E. Saiz and A. P. Tomsia, Acta Biomater., 2011, 7, 3547 CrossRef CAS PubMed.
- B. Derby, J. Eur. Ceram. Soc., 2011, 31, 2543 CrossRef CAS.
- M. Vaezi, H. Seitz and S. Yang, Int. J. Adv. Des. Manuf. Technol., 2013, 67, 1721 CrossRef.
- J. Deckers, J. Vleugels and J.-P. Kruth, J. Ceram. Sci. Technol., 2014, 5(4), 245–260 Search PubMed.
- A. Ambrosi and M. Pumera, Chem. Soc. Rev., 2016, 45, 2740 RSC.
- N. M. Farandos, L. Kleiminger, T. Li, A. Hankin and G. H. Kelsall, Electrochim. Acta, 2016, 213, 324 CrossRef CAS.
- Sapphire QS-256/30 AAA Inkjet Printhead Specifications, Fujifilm USA, https://www.fujifilm.com/us/en/business/inkjet-solutions/industrial-printheads/sapphire-qs-256-30-aaa, accessed 03-Oct-21).
- J. Alamán, R. Alicante, J. Ignacio Peña and C. Sánchez-Somolinos, Materials, 2016, 9, 910 CrossRef PubMed.
- B. Derby, Annu. Rev. Mater. Res., 2010, 40(1), 395–414 CrossRef CAS.
- N. Reis, C. Ainsley and B. Derby, J. Appl. Phys., 2005, 97(9), 094903 CrossRef.
- S. Masciandaro, M. Torrell, P. Leone and A. Tarancón, J. Eur. Ceram. Soc., 2019, 39, 9–16 CrossRef CAS.
- N. Kostretsova, A. Pesce, M. Nuñez, A. Morata, M. Torrell and A. Tarancón, ECS Trans., 2021, 103, 59 CrossRef CAS.
- I. M. Hutchings, G. D. Martin and S. D. Hoath, in Fundamentals of Inkjet Printing: The Science of Inkjet and Droplets, ed. S. D. Hoath, Wiley-VCH, Weinheim, Germany, 2016, pp. 8–12 Search PubMed.
- H. Dong, W. W. Carr and J. F. Morris, Phys. Fluids, 2006, 18, 072102 CrossRef.
- J. Fromm, IBM J. Res. Dev., 1984, 28, 322 Search PubMed.
- N. Reis and B. Derby, Mater. Res. Soc. Symp. Proc., 2000, 625, 65 CrossRef.
- D. Jang, D. Kim and J. Moon, Langmuir, 2009, 25, 2629 CrossRef CAS PubMed.
- R. Satoh, et al. , Jpn. J. Appl. Phys., 2004, 43, 7725 CrossRef CAS.
- C. D. Stow and M. G. Hadfeld, Proc. R. Soc. London, Ser. A, 1981, 373, 419 Search PubMed.
- J. Q. Feng, J. Imaging Sci. Technol., 2002, 46, 398 CAS.
- Q. Xu and O. A. Basaran, Phys. Fluids, 2007, 19, 102111 CrossRef.
- R. Noguera, M. Lejeune and T. Chartier, J. Eur. Ceram. Soc., 2005, 25, 2055 CrossRef CAS.
- A. Hughes, Nature, 1954, 173(4414), 1089–1090 CrossRef.
- I. M. Krieger and T. J. Dougherty, J. Rheol., 1959, 3, 137 CAS.
- M. Mooney, J. Colloid Interface Sci., 1951, 6, 162 CrossRef CAS.
- H. Eilers, Kolloid-Z., 1941, 97, 313 CrossRef CAS.
- D. Quemada, Rheol. Acta, 1977, 16, 82 CrossRef.
- J. V. Robinson, J. Phys. Chem., 1948, 53, 1042 CrossRef.
- Standard Potentials in Aqueous Solution, ed. A. J. Bard, R. Parsons and J. Jordan, Marcel Dekker, New York, 1985 Search PubMed.
- P. H. Tewari and A. B. Campbell, J. Colloid Interface Sci., 1976, 55(3), 531–539 CrossRef CAS.
- R. Greenwood and K. Kendall, J. Eur. Ceram. Soc., 2000, 20, 77–84 CrossRef CAS.
- N. M. Farandos, T. Li and G. H. Kelsall, Electrochim. Acta, 2018, 270, 264–273 CrossRef CAS.
- R. J. Hunter, in Zeta Potential in Colloid Science, Academic Press, Oxford, UK, 1981, pp. 59–124 Search PubMed.
- R. J. Hunter, Foundations of Colloid Science, Oxford University Press, 2nd edn, 2001 Search PubMed.
- S. Zürcher and T. Graule, J. Eur. Ceram. Soc., 2005, 25, 863 CrossRef.
- H. N. Lekkerkerker and R. Tuinier, Colloids and the Depletion Interaction, Springer Science, London, UK, 2011, pp. 57–108 Search PubMed.
- B. Derby and N. Reis, MRS Bull., 2003, 28, 815 CrossRef CAS.
- T. Mao, D. C. S. Kuhn and H. Tran, AIChE J., 1997, 43, 2169 CrossRef CAS.
- A. L. Yarin, Annu. Rev. Fluid Mech., 2006, 38, 159–192 CrossRef.
- B. Derby, Engineering, 2015, 1(1), 113–123 CrossRef CAS.
- J. Stringer and B. Derby, J. Eur. Ceram. Soc., 2009, 29, 913 CrossRef CAS.
- M. Pasandideh-Fard, Y. Qiao, M. J. Chandra and J. Mostaghimi, Phys. Fluids, 1996, 8, 650 CrossRef CAS.
- B. L. Scheller and D. W. Bousfield, AIChE J., 1995, 41, 1357 CrossRef CAS.
- H. Yoo and C. Kim, Colloids Surf., A, 2015, 468, 234 CrossRef CAS.
- M. Mikolajek, A. Friederich, W. Bauer and J. R. Binder, CFI, Ceram. Forum Int., 2015, 92(3), E25 Search PubMed.
- R. D. Deegan, O. Bakajin, T. F. Dupont, G. Huber, S. R. Nagel and T. A. Witten, Nature, 1997, 389(6653), 827–829 CrossRef CAS.
- A. P. Sommer and N. Rozlosnik, Cryst. Growth Des., 2005, 5, 551 CrossRef CAS.
- Y. Zhang, L. Chen and J. R. G. Evans, Langmuir, 2008, 24, 3752 CrossRef CAS PubMed.
- B.-J. de Gans and U. S. Schubert, Langmuir, 2004, 20, 7789 CrossRef CAS PubMed.
- R. Noguera, M. Lejeune and T. Chartier, J. Eur. Ceram. Soc., 2005, 25, 2055 CrossRef CAS.
- T. Cuk, S. M. Troian, C. M. Hong and S. Wagner, Appl. Phys. Lett., 2000, 77, 2063 CrossRef CAS.
- K. A. M. Seerden, N. Reis, J. R. G. Evans, P. S. Grant, J. W. Halloran and B. Derby, J. Am. Ceram. Soc., 2001, 84, 2514 CrossRef CAS.
- R. I. Tomov, M. Krauz, J. Jewulski, S. C. Hopkins, J. R. Kluczowski, D. M. Glowacka and B. A. Glowacki, J. Power Sources, 2010, 195, 7160 CrossRef CAS.
- R. I. Tomov, R. Duncan, M. Krauz, R. V. Kumar and B. A. Glowacki, E3S Web Conf., 2016, 10, 00098 CrossRef.
- V. Esposito, C. Gadea, J. Hjelm, D. Marani, Q. Hu, K. Agersted, S. Ramousse and S. H. Jensen, J. Power Sources, 2015, 273, 89 CrossRef CAS.
- N. M. Farandos, L. Kleiminger, T. Li, A. Hankin and G. H. Kelsall, Electrochim. Acta, 2016, 213, 324 CrossRef CAS.
- N. Farandos, Inkjet printing for solid oxide electrochemical reactors, Ph.D Thesis, Imperial College London, 2018, DOI:10.25560/62628.
- M. A. Sukeshini, R. Cummins, T. L. Reitz and R. M. Miller, J. Am. Ceram. Soc., 2009, 92, 2913 CrossRef CAS.
- C. Wang, R. I. Tomov, R. Vasant Kumar and B. A. Glowacki, J. Mater. Sci., 2011, 46, 6889 CrossRef CAS.
- G. D. Han, K. C. Neoh, K. Bae, H. J. Choi, S. W. Park, J.-W. Son and J. H. Shim, J. Power Sources, 2016, 306, 503 CrossRef CAS.
- T. Y. Hill, T. L. Reitz, M. A. Rottmayer and H. Huang, ECS J. Solid State Sci. Technol., 2015, 4, P3015 CrossRef CAS.
- N. Yashiro, T. Usui and K. Kikuta, J. Eur. Ceram. Soc., 2010, 30, 2093 CrossRef CAS.
- A. M. El-Toni, T. Yamaguchi, S. Shimizu, Y. Fujishiro and M. Awano, J. Am. Ceram. Soc., 2007, 91, 346–349 CrossRef.
- C. Li, H. Chen, H. Shi, M. Tade and Z. Shao, J. Power Sources, 2015, 273, 465–471 CrossRef CAS.
- C. Li, H. Shi, R. Ran, C. Su and Z. Shao, Int. J. Hydrogen Energy, 2013, 38, 9310 CrossRef CAS.
- N. P. Sullivan, US Pat., US20140072702A1, 2014 Search PubMed.
- C. Wang, S. C. Hopkins, R. I. Tomov, R. V. Kumar and B. A. Glowacki, J. Eur. Ceram. Soc., 2012, 32, 2317 CrossRef CAS.
- V. Esposito, C. Gadea, J. Hjelm, D. Marani, Q. Hu, K. Agersted, S. Ramousse and S. H. Jensen, J. Power Sources, 2015, 273, 89 CrossRef CAS.
- C. Li, H. Shi, R. Ran, C. Su and Z. Shao, Int. J. Hydrogen Energy, 2013, 38, 9310 CrossRef CAS.
- R. I. Tomov, M. Krauz, A. Tlucze, R. Kluczowsk, V. V. Krishnan, K. Balasubramania, R. V. Kuma and B. A. Glowack, Mater. Renew. Sustain. Energy, 2015, 4, 14 CrossRef.
- G. D. Han, K. C. Neoh, K. Bae, H. J. Choi, S. W. Park, J.-W. Son and J. H. Shim, J. Power Sources, 2016, 306, 503 CrossRef CAS.
- T. Y. Hill, T. L. Reitz and H. Huang, Mater. Res. Bull., 2016, 84, 437 CrossRef CAS.
- N. Yashiro, T. Usui and K. Kikuta, J. Eur. Ceram. Soc., 2010, 30, 2093 CrossRef CAS.
- N. Faino, W. Rosensteel, B. Gorman and N. P. Sullivan, ECS Trans., 2011, 35, 593 CrossRef CAS.
- J. L. Wheeler, N. P. Sullivan and J. M. Porter, Sens. Actuators, B, 2013, 183, 194 CrossRef CAS.
- X. Zhao, J. R. G. Evans, M. J. Edirisinghe and J.-H. Song, J. Am. Ceram. Soc., 2002, 85, 2113 CrossRef CAS.
- D. Young, A. M. Sukeshini, R. Cummins, H. Xiao, M. Rottmayer and T. Reitz, J. Power Sources, 2008, 184, 191 CrossRef CAS.
- G. D. Han, K. C. Neoh, K. Bae, H. J. Choi, S. W. Park, J.-W. Son and J. H. Shim, J. Power Sources, 2016, 306, 503 CrossRef CAS.
- J. Newman and K. E. Thomas-Alyea, in Electrochemical Systems, Wiley, Hoboken, New Jersey, USA, 3rd edn, 2004 Search PubMed.
- N. Ibl, in Comprehensive Treatise of Electrochemistry, ed. E. Yeager, Plenum, New York, USA, 1983, vol. 6, pp. 239–315 Search PubMed.
- B. Derby, Science, 2012, 338, 921 CrossRef CAS PubMed.
- T. Sekitani, Y. Noguchi, U. Zschieschang, H. Klauk and T. Someya, Proc. Natl. Acad. Sci. U. S. A., 2008, 105, 4976 CrossRef CAS PubMed.
- J. C. Ruiz-Morales, J. Canales-Vazquez, J. Pena-Martinez, D. Marrero-Lopez, J. T. S. Irvine and P. Nunez, J. Mater. Chem., 2006, 16, 540 RSC.
- M. M. Mohebi and J. R. G. Evans, J. Am. Ceram. Soc., 2003, 86, 1654 CrossRef CAS.
- A. J. Pintar, Estimation of Autoignition Temperature, Technical Support Document, DIPPR® Project 912, Michigan Technological University, Houghton, 1996 Search PubMed.
- D. Liu, B. Lee, A. Babkin and Y. Chang, Materials, 2021, 14(6), 1415 CrossRef CAS PubMed.
Footnote |
| † Now at: Utility Global, 19416 Park Row, Suite 120, Houston, TX 77084, USA. |
| This journal is © The Royal Society of Chemistry 2022 |


