Synergistically enhanced electrical transport properties of SrTiO3via Fermi level regulation and modulation doping†
Dongmei
Li
,
Dongyang
Wang
 ,
Xiao
Zhang
 * and
Li-Dong
Zhao
 *
*
School of Materials Science and Engineering, Beihang University, Beijing 100191, China. E-mail: zhang_xiao@buaa.edu.cn; zhaolidong@buaa.edu.cn
First published on 17th March 2022
Abstract
SrTiO3 has gained wide attention as an oxide thermoelectric material due to its high Seebeck coefficient and excellent high-temperature thermal stability. However, its intrinsic insulatory properties hinder its development as a thermoelectric material. Herein, we synergistically improved the electrical transport properties of SrTiO3 by increasing carrier concentration and maintaining high carrier mobility via Fermi level regulation and modulation doping through co-doping and compositing. Nb and La co-doping notably heightened the carrier concentration and regulated the Fermi level in the conduction band, resulting in an enhanced ZT value from that of an insulator in SrTiO3 to 0.033 in Sr0.875La0.125Ti0.85Nb0.15O3 at 923 K. The subsequent TiB2 compositing simultaneously improved carrier concentration (4.82 × 1017 cm3) and afforded high carrier mobility (3.55 × 104 cm2 V−1 S−1) in the Sr0.875La0.125Ti0.85Nb0.15O3 + 4% TiB2 sample at 923 K. The combination of synergistically improved carrier concentration and retained high carrier mobility resulted in an enhanced power factor (11.04 μW cm−1 K−2 at 923 K), maximum ZT (0.23 at 923 K) and average ZT (0.15 at 473–923 K) in Sr0.875La0.125Ti0.85Nb0.15O3 + 4% TiB2 through co-doping and compositing, which matches those of many excellent SrTiO3-based materials. Our study demonstrated that the thermoelectric properties of SrTiO3 could be improved via synergistically enhanced electrical transport properties through Fermi level regulation and modulation doping via co-doping and compositing, which will inspire further research on SrTiO3 and other oxide thermoelectric materials with mediocre electrical transport properties.
1. Introduction
With the need for green energy, thermoelectric materials have gained growing attention since they can convert heat (industrial waste heat, geothermal heat, etc.) into electricity.1 The conversion efficiency of thermoelectric materials is determined by ZT, defined as , where S: Seebeck coefficient, σ: electrical conductivity, and κ: thermal conductivity.2–5 Through advanced material design and regulatory strategies, the properties of thermoelectric materials have been rapidly developed in recent decades.6,7 However, most traditional thermoelectric materials comprise expensive elements such as Te2,8–10 and Ge1,11 or toxic elements such as S12,13 and Pb.14–17 Moreover, the high-temperature resistance and oxidation resistance of traditional thermoelectric materials are mediocre. Therefore, oxide ceramics and oxygenated compounds have been developed for non-toxicity, oxidation resistance, low cost and easy synthesis, satisfying the needs of large-scale production and high-temperature service requirements.18,19 Compared with other oxide materials, such as Ca3Co3O9 and NaCo2O4, SrTiO3 (STO) shows superior S and excellent thermal stability at high temperatures,6,20–22 and its isotropic properties indicate good mechanical properties in practical applications and a difficulty in fracture in a specific direction, thus gaining more attention as an oxide thermoelectric material.23,24
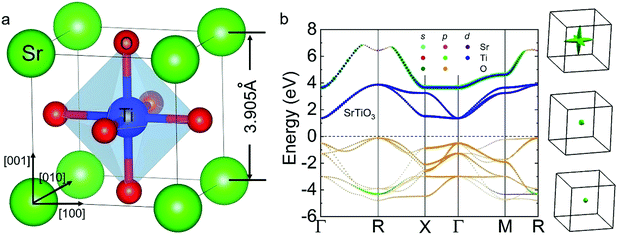
As shown in Fig. 1(a), SrTiO3 has a cubic perovskite structure (Pm3m) and a lattice constant of 3.905 Å at room temperature. The valence band maximum (VBM) and conduction band minimum (CBM) are located at the R and Γ points, respectively, indicating that it is an indirect semiconductor with a large band gap of ∼1.8 eV (Fig. 1(b)). The VBM mainly originates from the O atom while the CBM mainly results from the Ti-d orbital. Obviously, the CBM is a triple degenerate point and a strong anisotropy of effective mass can be found in the Fermi surface, as shown in the right panel of Fig. 1(b). Additionally, the longitudinal (vl) and shear (vs) acoustic velocities, the average sound velocity (va) and other elastic properties shown in Table S2 (ESI†) correspond to a high κ for the pristine STO material.
The energy band structure calculation results and the sound velocity measurements showed that the pristine STO material as an insulator has ultralow σ and high κ. Roy et al.25 reported that the power factor (PF) for Nb-doped SrTiO3 synthesized by spark plasma sintering (SPS) could reach 33.21 μW cm−1 K−2 at 1229 K. Li et al.26,27 proved that La doping in STO-Nb (Nb-doped SrTiO3) can not only introduce additional electrons to increase the carrier concentration (n) but also reduce the total energy of the STO-Nb system, effectively increasing the electron-doping efficiency. Besides, Ito et al.28 found that TiB2 could enhance the PF, resulting in a ZTmax value of ∼0.18 for the Sr0.95Y0.05TiO3 + 5 mass% TiB2 composite. These motivated us to explore the combined role of co-doping and compositing on the thermoelectric properties of STO.
In this work, we optimized the n of a pristine STO insulator by adjusting the Fermi level (EF) to enter the conduction band through Nb-La co-doping. In order to further improve the electrical transport, we composited TiB2, a high electrical conductivity boride, to introduce modulation doping in the STO matrix, synergistically improving n and maintaining high carrier mobility (μ). Therefore, the PF reached an ideal value in the entire investigated temperature range, with ∼11.04 μW cm−1 K−2 for Sr0.875La0.125Ti0.85Nb0.15O3 + 4% TiB2 at 923 K. Owing to the enhanced electrical transport over the broad temperature range, the Sr0.875La0.125Ti0.85Nb0.15O3 + 4% TiB2 sample reached a ZTmax of ∼0.23 at 923 K and an average ZT (ZTave) of ∼0.15 at 473–923 K, revealing the development potential of SrTiO3 for high-temperature thermoelectric applications.
2. Results and discussion
As revealed in Fig. 2, the designed improvement strategy for the thermoelectric performance of STO is divided into two consecutive steps: co-doping and compositing. Firstly, STO was transformed from an insulator to a semiconductor by electron-doping: the B-site (Ti4+) was substituted by Nb5+ and the A-site (Sr2+) was substituted by La3+. The experimental results and electronic structure calculations both verify that the La–Nb co-doped STO polycrystal showed measurable σ at room temperature. Secondly, to further synergistically improve n and μ, we composited the optimized La–Nb co-doped STO with TiB2 with excellent σ. Combining co-doping and compositing, the σ and thermoelectric performance accomplished a striking enhancement in a broad temperature range. | ||
| Fig. 2 Roadmap towards the high thermoelectric performance achieved in the SrTiO3-based samples via co-doping and modulation doping. | ||
2.1. Transforming STO from an insulator to a semiconductor through increasing carrier concentration via Nb-La co-doping
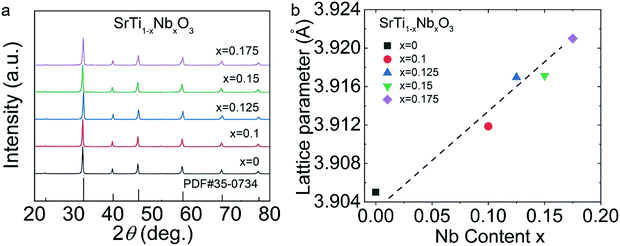
According to the XRD pattern shown in Fig. 3, the diffraction peaks of all the SrTi1−xNbxO3 (x = 0.1, 0.125, 0.15, 0.175) samples matched with the standard PDF card (PDF#35-0734) of STO, indicating that STO-based polycrystals were successfully synthesized by the solid-state reaction (SSR) without any impurity phase. Since the ion radius of Nb5+ (0.64 Å) is slightly larger than that of Ti4+ (0.61 Å), the lattice constants (Fig. 3(b)) increased gradually with increase in doping content.Fig. 4 displays the thermoelectric properties of SrTi1−xNbxO3, revealing the transformation from insulator to semiconductor at 473–923 K with room-temperature insulativity via Nb doping. The σ (Fig. 4(a)) of SrTi1−xNbxO3 showed a positive correlation with temperature, and generally increased with increasing doping content. σ reached ∼1.9 S cm−1 for the SrTi0.85Nb0.15O3 sample at 923 K. Fig. 4(b) shows that the S values of all samples at 473–923 K are negative, indicating that STO can be transformed from an insulator to an n-type semiconductor via electron-doping. The absolute values of all S are greater than 280 μV K−1, verifying the development potential of STO due to its high |S| in oxide thermoelectric materials.
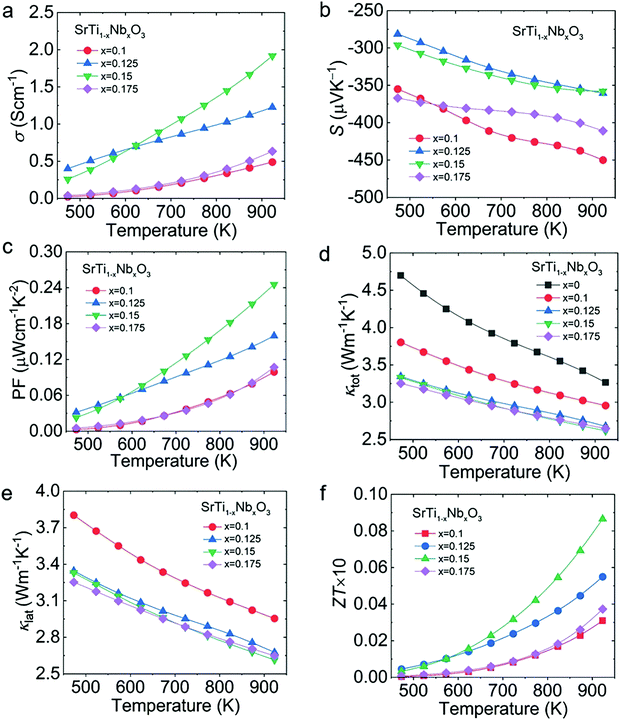 | ||
| Fig. 4 Thermoelectric performance of SrTi1−xNbxO3 (x = 0–0.175): (a) σ; (b) S; (c) PF; (d) κtot; (e) κlat; (f) ZT. | ||
The decrease of |S| (absolute value of the Seebeck coefficient) and increase of σ are both due to the increased n via electron-doping.29 Benefiting from the improved σ, the PF of all samples (Fig. 4(c)) shows enhanced electrical transport properties at high temperatures. The total thermal conductivity (κtot) (Fig. 4(d)) of the Nb-doped samples is depressed compared with that of un-doped SrTiO3 due to the enhanced phonon scattering after introducing defects via doping.30,31 The small difference between κtot and κlat seen in Fig. 4(e) indicates that lattice vibration is the main mechanism of heat transfer in the SrTi1−xNbxO3 polycrystal, and that the electrical properties of SrTi1−xNbxO3 are still inferior. Connected with the simultaneously enhanced electrical transport and depressed thermal properties, the ZTmax value (Fig. 4(f)) of SrTi1−xNbxO3 (x = 0.1, 0.125, 0.15, 0.175) increased from that of an insulator in undoped STO to ∼0.009 for SrTi0.85Nb0.15O3 at 923 K, and the ZTave value (Fig. S2, ESI†) was ∼0.003 for SrTi0.85Nb0.15O3 at 473–923 K.
Due to the inferior electrical properties and the room-temperature insulativity of SrTi1−xNbxO3, La–Nb co-doping was introduced to further increase the electrical transport properties of SrTi0.85Nb0.15O3 over a wide temperature range. The XRD patterns of Sr1−yLayTi0.85Nb0.15O3 (y = 0, 0.1, 0.125, 0.15) in Fig. 5(a) suggest that the La–Nb co-doped STO purity phase was synthesized. The measured band gap of Sr1−yLayTi0.85Nb0.15O3 (Fig. 5(b)) showed a slight increase compared with that of SrTi0.85Nb0.15O3, consistent with the theoretical calculation, which will be discussed later.
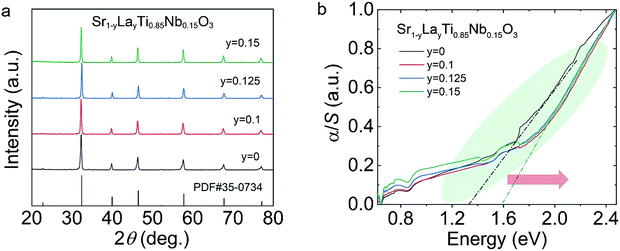 | ||
| Fig. 5 Structural characterization of Sr1−yLayTi0.85Nb0.15O3 (y = 0–0.15): (a) XRD patterns and (b) absorption coefficient from the Kubelka–Munk method. | ||
The σ of the Sr1−yLayTi0.85Nb0.15O3 samples (Fig. 6(a)) increased with temperature, reflecting good semiconductor behavior and did not reach a peak value within the tested temperature range. Besides, the σ values of Sr1−yLayTi0.85Nb0.15O3 are significantly superior to those of SrTi0.85Nb0.15O3. It is worth noting that the σ of all the La–Nb co-doped samples is measurable at room temperature. All the |S| values indicated that the samples are heavily doped semiconductors, almost linearly proportional to temperature (Fig. 6(b)). Meanwhile, the depressed |S| and enhanced σ for all the La–Nb co-doped samples indicates enhanced n through La and Nb co-doping. Therefore, the PF value (Fig. 6(c)) reached ∼0.9 μW cm−1 K−2 for the Sr0.875La0.125Ti0.85Nb0.15O3 sample at 923 K. On account of the measured σ and S, we acquired the weighted mobility (μW) (Fig. 6(d)) of the La–Nb co-doped STO polycrystal. The μW of Sr1−yLayTi0.85Nb0.15O3 increased monotonously with increase in temperature, possibly due to the thermal activation of the grain boundary.32,33
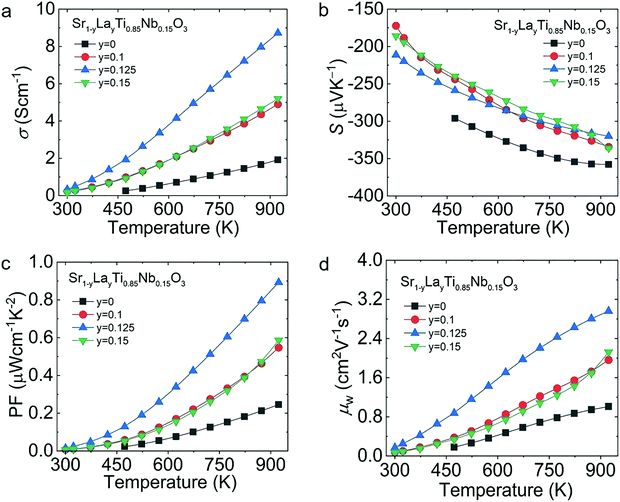 | ||
| Fig. 6 Electrical transport properties of Sr1−yLayTi0.85Nb0.15O3 (y = 0–0.15): (a) σ; (b) S; (c) PF; (d) μW. | ||
To further understand the doping effect of Nb and La in STO, first-principles calculations were conducted. Compared with the matrix of STO, the introduction of La or Nb can move the EF into the conduction band, mainly due to the additional electrons introduced by Nb and La. As a result, the n obviously improved compared with that of pristine STO. It is worth noting that the EF went further into the conduction band with La–Nb co-doping (Fig. 7(c)), and the band gap increased slightly, in accordance with the measured band gap outcome (Fig. 5(b)). Fig. 7(d) shows the corresponding total density of states (TDOS) of Sr8Ti8O24, Sr7LaTi8O24, Sr7LaTi7NbO24 and Sr7LaTi7NbO24, and a clear entrance of EF into the conduction band in doped systems is observed. The TDOS at the EF is non-zero regardless of La, Nb and La–Nb co-doping, indicating that the doped material has metallic conductivity.
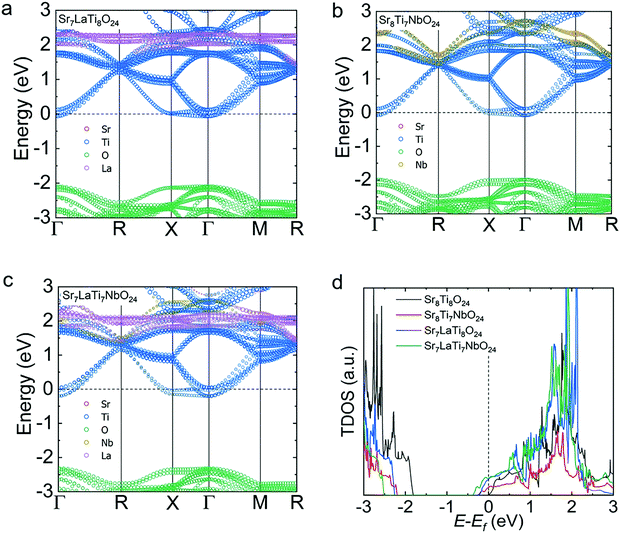 | ||
| Fig. 7 Electronic band structures and TDOS calculated for the SrTiO3-based materials: (a) Sr7LaTi8O24; (b) Sr8Ti7NbO24; (c) Sr7LaTi7NbO24; and (d) TDOS near the bottom of the conduction band. | ||
As displayed in Fig. 8(a), the κtot for Sr1−yLayTi0.85Nb0.15O3 showed a negative correlation with La content in the tested temperature range, going from ∼3.33 W m−1 K−1 in SrTi0.85Nb0.15O3 to ∼2.61 W m−1 K−1 of Sr0.875La0.125Ti0.85Nb0.15O3 at 473 K. The decreased κtot is due to the intensive phonon scattering by the point defects due to the mass contrast and lattice local strain introduced by co-doping. Benefiting from the enhanced electrical properties and the weakened thermal transport, the ZTmax value reached ∼0.033 at 923 K (Fig. 8(b)).
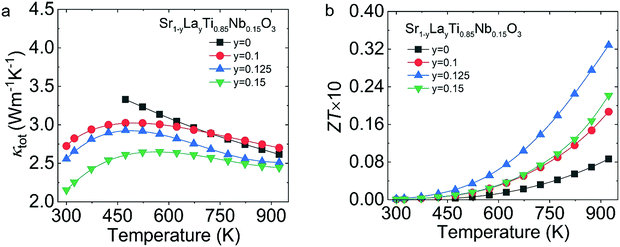 | ||
| Fig. 8 Thermoelectric transport properties of Sr1−yLayTi0.85Nb0.15O3 (y = 0–0.15): (a) κtot; (b) ZT. | ||
2.2. Synergistically enhancing the electrical transport of La–Nb co-doped STO through modulation doping via compositing TiB2
To further synergistically enhance the n and μW over the entire tested temperature range, we composited Sr0.875La0.125Ti0.85Nb0.15O3 with TiB2, which possesses excellent σ (1 × 10⁵ S cm−1), high melting point (3498 K) and an oxidation resistance temperature in air of 1273 K.34,35 This afforded an intermetallic compound with a hexagonal graphite-like two-dimensional network structure, where B and Ti atomic planes appear alternately.36 As depicted in Fig. 9(a), the trend of σ with temperature shows that the semiconductor behavior gradually weakens and the metallic behavior gradually increases with increase in TiB2 concentration (z% from 0% to 5%). Particularly, the σ of Sr0.875La0.125Ti0.85Nb0.15O3 with 1% and 2% TiB2 showed monotonic positive correlation with temperature, while the σ of the 3% TiB2 composite increased first and then decreased, and the electrical properties of the 4% and 5% TiB2 composites monotonously decreased with increasing temperature. Additionally, the S (Fig. 9(b)) decreased from ∼−212 μV K−1 for Sr0.875La0.125Ti0.85Nb0.15O3 to ∼−48 μV K−1 for Sr0.875La0.125Ti0.85Nb0.15O3 + 4% TiB2 at room temperature, and from ∼−321 μV K−1 for Sr0.875La0.125Ti0.85Nb0.15O3 to ∼128 μV K−1 for Sr0.875La0.125Ti0.85Nb0.15O3 + 4% TiB2 at 923 K, indicating the enhancement of electrical transport properties. Therefore, the PF (Fig. 9(c)) of all samples was enhanced over the whole temperature range under investigation, especially for the sample with 4% TiB2 where it reaches the highest value of ∼11 μW cm−1 K−2 at ∼675 K. Fig. 9(d) shows that the introduction of TiB2 could effectively increase the n and the μW, leading to optimization of the σ of STO. The synergic optimization of the μW and n may be due to modulation doping. The different carrier transport properties of three-dimensional modulation doping models and ordinary high-density doping are shown in Fig. 9(e and f). In regular doping, the high-density carrier concentration would reduce μ due to the increased ionized impurity scattering. Comparatively, modulation doping is composed of a high-density carrier concentration phase and a low-density carrier concentration phase, which could depress the ionized impurity scattering and enhance μ, synergistically improving n and retaining a high μ. The modulation doping method has already been utilized in many thermoelectric systems, such as SnSe,37 BiCuSeO,38 p-type SiGe,39 P-type ZnSb,40 and n-type TeSb2.41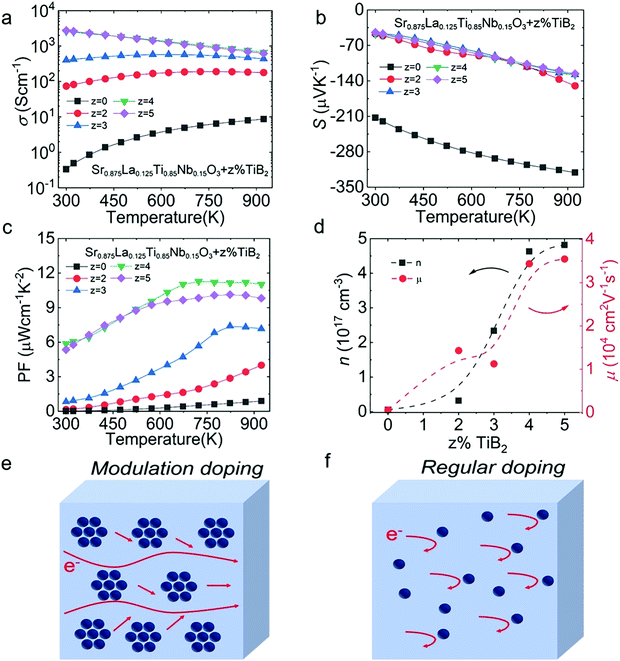 | ||
| Fig. 9 Electrical transport properties for Sr0.875La0.125Ti0.85Nb0.15O3 + z% TiB2 (z = 0–5): (a) σ; (b) S; (c) PF; (d) n and μ. (e) Modulation-doped semiconductor and (f) regular doped semiconductor. | ||
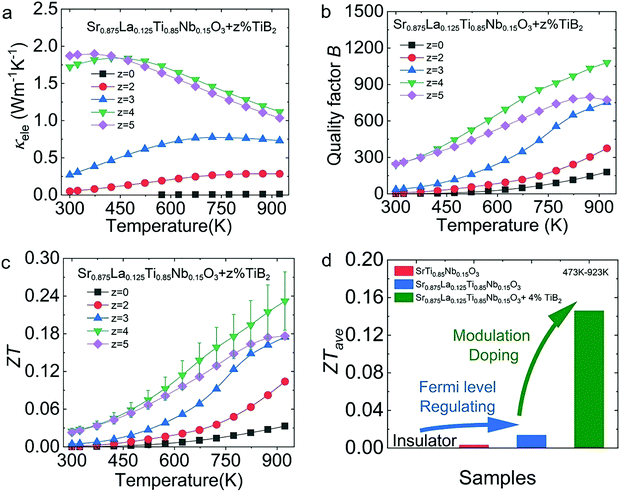
As shown in Fig. 10(a), the electric thermal conductivity (κele) of Sr0.875La0.125Ti0.85Nb0.15O3 + z% TiB2 (z = 0–5) exhibited a significant increase with increasing TiB2 content, going from ∼0 W m−1 K−1 in the Sr0.875La0.125Ti0.85Nb0.15O3 sample to ∼1.72 W m−1 K−1 in the Sr0.875La0.125Ti0.85Nb0.15O3 + 4% TiB2 sample at 300 K. According to Fig. 10(b), the heightened electrical transport properties through modulation doping boost the quality factor (B) of these samples in the tested temperature range. Therefore, the sample with 4% TiB2 obtained a ZTmax value of ∼0.23 at 923 K (Fig. 10(c)), and TiB2 improved the thermoelectric performance of the STO-based materials over the complete tested temperature range. The optimal performance of the Nb-doped, La–Nb co-doped and modulation-doped samples, with ZTave values of ∼0.003, ∼0.013, and ∼0.15 at 473–923 K, respectively (Fig. 10(d)), showed the significant benefits of the synergetic improvement of n and μ.
We compared the thermoelectric performance of the materials in this work with that of other reported work on STO systems, including SrTi0.8Nb0.2O3,31 Sr0.93Bi0.07TiO3,42 (La0.12Sr0.88)0.95TiO3−δ,43 Sr0.87Dy0.07Nd0.06TiO344 and Sr0.92La0.08TiO3,45 as shown in Fig. 11. Due to the significantly heightened σ and PF values over the whole tested temperature range, the ZTmax of our work showed strong competitiveness among the STO systems, indicating that STO has the potential to become an excellent thermoelectric material.
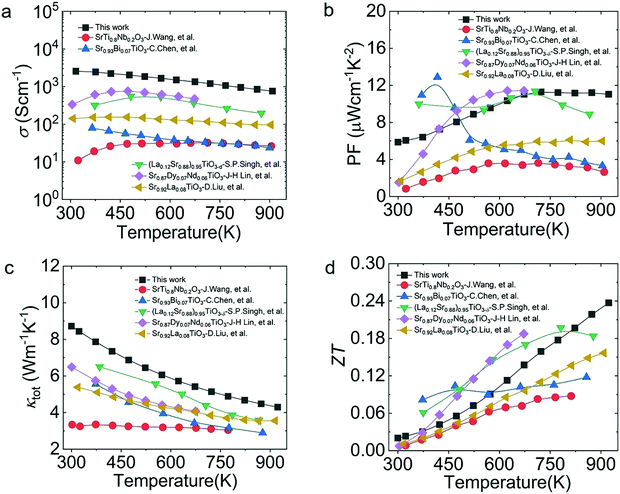 | ||
| Fig. 11 Thermoelectric properties from this work and from other SrTiO3-based materials: (a) σ; (b) PF; (c) κtot; (d) ZT.31,42–45 | ||
3. Conclusion
In this study, the thermoelectric properties of SrTiO3 were gradually enhanced by synergistically improving electrical transport by increasing n and retaining high μ via EF regulation and modulation doping through co-doping and compositing. Firstly, we introduced Nb doping to adjust the EF of the pristine STO material to enter the conduction band, transforming it from an insulator to a semiconductor. Secondly, the La–Nb co-doped samples showed obvious semiconductor behavior even at 300 K due to the enhanced n. Thirdly, TiB2 compositing simultaneously improved the n with high μ in SrTiO3 through modulation doping. Therefore, a promising new kind of n-type STO-based polycrystal was obtained through co-doping and compositing, and the ZTmax value of Sr0.875La0.125Ti0.85Nb0.15O3 + 4% TiB2 reached ∼0.23 at 923 K, with a ZTave ∼0.15 at 473–923 K. Despite the advancements mentioned above, there is still potential for future research progress, such as reducing thermal conductivity through enhanced phonon scattering.Conflicts of interest
There are no conflicts of interest to declare.Acknowledgements
This work was supported by the National Key Research and Development Program of China (2018YFA0702100 and 2018YFB0703600), National Natural Science Foundation of China (52002042), the National Science Fund for Distinguished Young Scholars (51925101), China Postdoctoral Science Foundation (2021M690280), Natural Science Foundation of Chongqing, China, cstc2019jcyj-msxmX0554, National Postdoctoral Program for Innovative Talents (BX20200028), and the high performance computing (HPC) resources at Beihang University.References
- R. Basu and A. Singh, Mater. Today Phys., 2021, 21, 100468 CrossRef CAS.
- G. Tan, W. G. Zeier, F. Shi, P. Wang and M. G. Kanatzidis, Chem. Mater., 2015, 27, 7801–7811 CrossRef CAS.
- Z. G. Chen, X. Shi, L. D. Zhao and J. Zou, Prog. Mater. Sci., 2018, 97, 283–346 CrossRef CAS.
- X. Y. Liu, D. Y. Wang, H. J. Wu, J. F. Wang, Y. Zhang, G. T. Wang, S. J. Pennycook and L. D. Zhao, Adv. Funct. Mater., 2019, 29, 1806558 CrossRef.
- C. Chang, G. J. Tan, J. Q. He, M. G. Kanatzidis and L. D. Zhao, Chem. Mater., 2018, 30, 7355–7367 CrossRef CAS.
- X. L. Shi, H. Wu, Q. Liu, W. Zhou and Z. G. Chen, Nano Energy, 2020, 78, 105195 CrossRef CAS.
- C. Chang, D. Y. Wang, D. S. He, W. K. He, F. Y. Zhu, G. T. Wang, J. Q. He and L. D. Zhao, Adv. Energy Mater., 2019, 9, 1901334 CrossRef.
- B. C. Qin, Y. Xiao, Y. M. Zhou and L. D. Zhao, Rare Met., 2018, 37, 343–350 CrossRef CAS.
- Y. Xiao, D. Y. Wang, B. C. Qin, J. F. Wang, G. T. Wang and L. D. Zhao, J. Am. Chem. Soc., 2018, 140, 13097–13102 CrossRef CAS PubMed.
- D. Wu, Y. L. Pei, Z. Wang, H. Wu, L. Huang, L. D. Zhao and J. He, Adv. Funct. Mater., 2014, 24, 7763–7771 CrossRef CAS.
- Y. T. Qiu, Y. Jin, D. Y. Wang, M. J. Guan, W. K. He, S. Peng, R. H. Liu, X. Gao and L. D. Zhao, J. Mater. Chem. A, 2019, 7, 26393–26401 RSC.
- W. K. He, D. Y. Wang, J. F. Dong, Y. Qiu, L. W. Fu, Y. Feng, Y. J. Hao, G. T. Wang, J. F. Wang, C. Liu, J. F. Li, J. Q. He and L. D. Zhao, J. Mater. Chem. A, 2018, 6, 10048–10056 RSC.
- Y. L. Pei, H. Wu, J. Sui, L. Jing, D. Berardan, C. Barreteau, P. Lin, N. Dragoe, W. S. Liu and J. He, Energy Environ. Sci., 2013, 6, 1750–1755 RSC.
- M. Orihashi, Y. Noda, H. T. Kaibe and I. A. Nishida, Mater. Trans., 2007, 39, 672–678 CrossRef.
- M. A. Ali, S. A. Dar, A. A. AlObaid, T. I. Al-Muhimeed, H. H. Hegazy, G. Nazir and G. Murtaza, J. Phys. Chem. Solids, 2021, 159, 110258 CrossRef CAS.
- E. J. Skoug, J. D. Cain and D. T. Morelli, J. Alloys Compd., 2012, 506, 18–21 CrossRef.
- X. Qian, H. J. Wu, D. Y. Wang, Y. Zhang, J. F. Wang, G. T. Wang, L. Zheng, S. J. Pennycook and L. D. Zhao, Energy Environ. Sci., 2019, 12, 1969–1978 RSC.
- X. X. Zhang, C. Chang, Y. Zhou and L. D. Zhao, Materials, 2017, 10, 198 CrossRef PubMed.
- W. W. Qu, X. X. Zhang, B. F. Yuan and L. D. Zhao, Rare Met., 2018, 37, 79–94 CrossRef CAS.
- N. M. Ferreira, N. R. Neves, M. C. Ferro, M. A. Torres and A. V. Kovalevsky, J. Eur. Ceram. Soc., 2019, 39, 4184–4188 CrossRef CAS.
- C. A. Qi, C. Hnz, B. Yz, A. Hm, C. Xcw and A. Xj, Ceram. Int., 2022, 48, 9014–9023 CrossRef.
- Y. Kodama, N. Murayama and Y. T. Yasukawa, J. Mater. Sci. Lett., 1998, 17, 1999–2001 CrossRef CAS.
- M. A. Carpenter, C. J. Howard, K. S. Knight and Z. Zhang, J. Phys., 2006, 18, 10725–10749 CAS.
- M. Guennou, P. Bouvier, J. Kreisel and D. Machon, Phys. Rev. B: Condens. Matter Mater. Phys., 2010, 81, 054115 CrossRef.
- P. Roy, V. Pal and T. Maiti, Ceram. Int., 2017, 43, 12809–12813 CrossRef CAS.
- Y. Miao, L. Liu, C. Y. Fang, C. Qiqige and A. Wang, J. Alloys Compd., 2016, 665, 7–12 CrossRef.
- J. Wang, B. Y. Zhang, H. J. Kang, L. Yan and L. D. Zhao, Nano Energy, 2017, 35, 387–395 CrossRef CAS.
- O. Naoto and I. Mikio, Composites, Part B, 2016, 88B, 108–113 Search PubMed.
- H. Muta, K. Kurosaki and S. Yamanaka, J. Alloys Compd., 2003, 350, 292–295 CrossRef CAS.
- N. Wang, H. Chen, H. He, W. Norimatsu, M. Kusunoki and K. Koumoto, Sci. Rep., 2013, 3, 3449 CrossRef PubMed.
- J. Wang, X. X. Ye, X. B. Yaer, B. Y. Zhang, W. Ma and L. Miao, Scr. Mater., 2015, 99, 25–28 CrossRef CAS.
- W. K. He, B. C. Qin and L. D. Zhao, Chin. Phys., 2020, 37, 087104 CAS.
- G. J. Snyder, A. H. Snyder, M. Wood, R. Gurunathan, B. H. Snyder and C. Niu, Adv. Mater., 2020, 32, 2001537 CrossRef CAS PubMed.
- X. Zhang, Z. Zhang, W. Wang, J. Shan, H. Che, J. Mu and G. Wang, J. Am. Ceram. Soc., 2017, 100, 3099–3107 CrossRef CAS.
- S. Song, T. Zhang, C. Xie, J. Zhou, R. Li and Q. Zhen, J. Am. Ceram. Soc., 2020, 103, 719–723 CrossRef CAS.
- O. Popov, T. Avramenko and V. Vishnyakov, Mater. Today Commun., 2020, 26, 101756 CrossRef.
- L. D. Zhao, S. H. Lo, Y. Zhang, H. Sun, G. Tan, C. Uher, C. Wolverton, V. P. Dravid and M. G. Kanatzidis, Nature, 2014, 508, 373–377 CrossRef CAS PubMed.
- Y. L. Pei, H. Wu, D. Wu, F. Zheng and J. He, J. Am. Chem. Soc., 2014, 136, 13902–13908 CrossRef CAS PubMed.
- B. Yu, M. Zebarjadi, H. Wang, K. Lukas, H. Wang, D. Wang, C. Opeil, M. Dresselhaus, G. Chen and Z. Ren, Nano Lett., 2012, 12, 2077–2082 CrossRef CAS PubMed.
- M. Amsler, S. Goedecker, W. G. Zeier, G. J. Snyder, C. Wolverton and L. Chaput, Chem. Mater., 2016, 28, 2912–2920 CrossRef CAS.
- M. Koirala, H. Zhao, M. Pokharel, S. Chen and T. Dahal, Appl. Phys. Lett., 2013, 102, 213111 CrossRef.
- C. Cong, A. Mb, A. Fg and A. Fd, J. Materiomics, 2019, 5, 88–93 CrossRef.
- S. P. Singh, N. Kanas, T. D. Desissa, M. Johnsson and K. Wiik, J. Eur. Ceram. Soc., 2019, 40, 401–407 CrossRef.
- J. H. Lin, C. S. Hwang and F. R. Sie, Mater. Res. Bull., 2020, 122, 110650.110651–110650.110658 CrossRef.
- D. Liu, Y. Zhang, H. Kang, J. Li, Z. Chen and T. Wang, J. Eur. Ceram. Soc., 2018, 38, 807–811 CrossRef CAS.
Footnote |
| † Electronic supplementary information (ESI) available. See DOI: 10.1039/d2tc00719c |
| This journal is © The Royal Society of Chemistry 2022 |

