 Open Access Article
Creative Commons Attribution 3.0 Unported Licence
Additively manufactured thermosetting elastomer composites: small changes in resin formulation lead to large changes in mechanical and viscoelastic properties†
Ye
Wang
a,
Ian M.
McAninch
b,
Antoine P.
Delarue
c,
Christopher J.
Hansen
c,
E. Jason
Robinette
b and
Amy M.
Peterson
 *a
*a
aDepartment of Plastics Engineering, University of Massachusetts Lowell, Lowell, MA 01854, USA. E-mail: amy_peterson@uml.edu
bArmy Research Directorate, US Army Combat Capabilities Development Command-Army Research Laboratory, Aberdeen Proving Ground, MD 21005, USA
cDepartment of Mechanical Engineering, University of Massachusetts Lowell, Lowell, MA 01854, USA
First published on 8th December 2022
Abstract
Composites with high loadings of the reinforcement phase are interesting systems for vat photopolymerization forms of additive manfuacturing (AM), since AM enables fabrication of complex structures. This work investigates the effect of resin chemistry and addition of solid reinforcement on mechanical, thermal and viscoelastic properties of thermosetting polymer composites at high solid loading (50 vol%) that were fabricated using digital light processing (DLP). Co-monomers that would preferentially interact with the glass surface and act as surfactant-like additives were added to a base urethane acrylate resin system. Better resin wettability led to higher strength of printed composites, while glass transition temperature remained constant across resin formulations in neat and composite specimens. Addition of co-monomers more substantially affected the mastercurves of composites than neat specimens, with co-monomer addition leading to high stiffnesses at high frequencies. We also compare two approaches for tailoring interfacial interactions (modifying the resin formulation and modifying the reinforcement's surface chemistry) and discuss the relative advantages of each for achieving high performance additively manufactured composites.
Introduction
Additive manufacturing using vat photopolymerization (VP) offers high surface quality, dimensional precision, and the ability to create complex structures with fine details.1–3 In a typical VP process, photopolymerizable materials are contained in a vat and selectively cured in a layer-by-layer fashion through exposure to light. The most common forms of VP are stereolithography (SLA) and digital light processing (DLP).4,5 DLP simultaneously exposes an entire layer to light, while a laser scans across a layer in SLA. Thus, DLP is often faster since the printing time is determined by the vertical dimensions of the target structures.Common photocurable polymer systems used in VP include those capable of free radical polymerization (e.g., meth/acrylates, thiol–ene systems, and addition fragmentation chain transfer systems) and cationic polymerization (e.g., epoxides).1,2,6 These neat polymer systems typically have lower mechanical strength than composite materials, which are more suitable for structural applications. As such, the development of composite materials based on these polymer systems, especially polymer composites with high loading of reinforcements, has received more attention in recent years. Shah et al. developed an acrylate-based resin composite system loaded with 50 vol% hollow glass microspheres for DLP and successfully printed parts with low density and high modulus.7 Lee et al. prepared a photocurable system based on 1,6-hexanediol diacrylate, camphor, and calcium phosphate powders (CaP) and additively manufactured composite parts with 48 vol% CaP powders with high flexural and compressive strength.8 Other solid reinforcements that have been incorporated in VP resins include cordierite powders,9 silicon nitride,10 zirconia,11 aluminium nitride,12 and silicon carbide.13 VP of composites has been shown for fabrication of green bodies that are subsequently de-bound and sintered to form complex metal and ceramic structures.4,14 Challenges associated with VP of highly filled composites include the substantial increase in resin viscosity with solids loading that hinders liquid layer replenishment,7 the requirement to maintain dispersion of the reinforcement phase,7,15 and light scattering that may arise from the presence of secondary phase within the resin.16,17
Formulating the polymer phase with different dispersants or surfactants has been an important area of research for creating high solid loading composites wherein the reinforcement phase is well-dispersed. Kim et al. modified a DLP-based diacrylate resin system with 80 wt% (≈30 vol%) lead zirconate titanate (PZT) powders and different weight percentage (1–3 wt%) of BYK-142 dispersant.15 They observed that 2 wt% of dispersant in the system increased printing precision and surface quality and attributed these positive characteristics to this concentration resulting in the lowest viscosity and highest dispersion stability. Zhang et al. optimized the rheological properties and curing parameters of a photocurable ZrO2–acrylate system with a KOS-110 dispersant at 2 wt% and successfully printed composite part with 55 vol% solids.18 Other dispersants or surfactants that have been investigated for use in VP of composite parts include BYK dispersants,7,19 unsaturated carboxylic acid,20 and polyelectrolytes.21
While different solid reinforcements and many novel formulations modified with dispersants and surfactants have been used for DLP and other VP techniques, fewer reports focused on the role of interfacial interactions between the continuous polymer phase and solid reinforcement phase in high solid loading composites. We previously found that resin wettability (resin contact angle on glass surfaces) was the factor most predictive of the interfacial fracture energy of adhesively bonded structures.22 Interfacial fracture energies were measured via peel testing of bulk acrylate systems with different surfactant-like monomer additives on flat glass plates. When bonding was fully non-covalent, interfacial fracture energy was positively correlated with resin wettability. This current work aims to apply that model system to additively manufactured thermosetting composites with high solid loadings.
In this work, we investigate the effect of resin chemistry and addition of glass microspheres as a solid reinforcement on mechanical, thermal, and viscoelastic properties of thermosetting polymer composites at high solid loading (50 vol%) that were fabricated using DLP. Co-monomers that preferentially interact with the glass surface and act as surfactant-like additives were added to a base urethane acrylate resin system. Tensile and thermomechanical properties were characterized. Printability of complex parts with fine details was demonstrated using one of the highly filled formulations. We also compare two approaches for tailoring interfacial interactions (modifying the resin formulation and modifying the reinforcement's surface chemistry23) and discuss the relative advantages of each for achieving high performance additively manufactured composites.
Experimental
Materials
The base resin system was an aliphatic urethane diacrylate from Allnex (Ebecryl 230) with isobornyl acrylate from Sigma-Aldrich (IBA) as the reactive diluent. Diphenyl (2,4,6-trimethylbenzoyl) phosphine oxide from Sigma-Aldrich (TPO) was chosen as the photoinitiator, and 2,5-bis(5-tert-butyl-benzoxazol-2-yl) thiophene from Sigma-Aldrich (BBOT) served as the UV blocker. In this work, the base resin contained 60.00 wt% Ebecryl 230, 39.44 wt% IBA, 0.40 wt% TPO, and 0.16 wt% BBOT. 2 wt% of either 2-hydroxyethyl methacrylate (HEMA) or 2-ethylhexyl acrylate (EHA) was added to create modified resin systems. Chemical structures for HEMA and EHA are given in the ESI† (Table S1). Ethanol from Fisher Scientific and all other chemicals from Sigma-Aldrich were used as received.Glass microspheres (density of ≈2.53 g cm−3) with two different mean particle diameters from Potters Industries Inc., were selected as the reinforcement phase. Spheriglass A-Glass 2530 (2530 A) has a mean particle diameter of 60–70 μm and Spheriglass A-Glass 5000 (5000 A) has a mean particle diameter of 7–10 μm.
Glass microsphere preparation
Prior to mixing glass microspheres into a resin system, microspheres were rinsed, filtered, dried, cleaned, and sieved. Glass microspheres were rinsed with acetone, ethanol, and DI water and vacuum filtered after each rinsing step. Filtered glass microspheres were dried for 2 h at 120 °C in a vacuum oven (Isotemp™ Model 281 A, Fisher Scientific). A mortar and pestle were used to break apart microsphere agglomerations formed during the drying process. Microspheres (after rinsing, filtering, and drying) were cleaned in a UV Ozone Cleaner (ProCleanerTM Plus, BioForce Nanosciences) for 20 minutes. Then, an electronic test sieve shaker (RO-TAP RX-29-E, W. S. Tyler) and stainless-steel sieves (ASTM E-11 standard, Advantech Manufacturing, Inc.) were used for sieving the glass microspheres for ≈20 minutes to remove any additional agglomerations. A #200 upper mesh and a #325 lower mesh sieves were used for sieving 2530 A glass microspheres, while a single #400 mesh sieve was used with 5000 A microspheres.DLP printing of neat and composite specimens
To avoid air bubble formation and obtain homogenous mixtures, base or modified resin systems were mixed and degassed multiple times using an ARE-310 planetary centrifugal mixer (Thinky Corp, Japan).To create neat samples, the resin system was additionally mixed immediately before DLP printing in a planetary centrifugal mixer (SpeedMixer DAC 600.1 VAC-P, FlackTek Inc.) under vacuum for 5 minutes at 900 rpm. These conditions were chosen to help release air bubbles and ensure mixture homogeneity.
50 vol% glass microspheres were added to composite systems, as a reasonable viscosity was achieved at this volume fraction in previous studies of VP of ceramic slurries.7,9,24 A bimodal microsphere size distribution was used in this work with a weight ratio of 0.6![[thin space (1/6-em)]](https://www.rsc.org/images/entities/char_2009.gif) :
:![[thin space (1/6-em)]](https://www.rsc.org/images/entities/char_2009.gif) 0.4 of 2530 A
0.4 of 2530 A![[thin space (1/6-em)]](https://www.rsc.org/images/entities/char_2009.gif) :
:![[thin space (1/6-em)]](https://www.rsc.org/images/entities/char_2009.gif) 5000 A. This ratio was selected to minimize the viscosity for 50 vol% glass microspheres, although the theory from which this ratio derives assumes no polydispersity in the two microspheres sizes.25,26 2530 A glass microspheres were added first to a resin system and hand-mixed for 5 minutes using a stainless-steel spatula. Then, 5000 A microspheres were added and hand-mixed for an additional 5 minutes. After both 2530 A and 5000 A glass microspheres were added, the whole system was mixed in the SpeedMixer under vacuum for 5 minutes at 900 rpm. All formulations were covered in aluminium foil to prevent direct light exposure before DLP printing.
5000 A. This ratio was selected to minimize the viscosity for 50 vol% glass microspheres, although the theory from which this ratio derives assumes no polydispersity in the two microspheres sizes.25,26 2530 A glass microspheres were added first to a resin system and hand-mixed for 5 minutes using a stainless-steel spatula. Then, 5000 A microspheres were added and hand-mixed for an additional 5 minutes. After both 2530 A and 5000 A glass microspheres were added, the whole system was mixed in the SpeedMixer under vacuum for 5 minutes at 900 rpm. All formulations were covered in aluminium foil to prevent direct light exposure before DLP printing.
An Autodesk Ember (Autodesk Inc.) with a 405 nm UV LED light source was used for printing. In this work, a 50 μm layer thickness was selected for all prints. SolidWorks (Dassault Systèmes) was used to create models and STL files for an ASTM D638 type V tensile bar, a dynamic mechanical analysis (DMA) bar for single cantilever measuring mode, and other more complex structures (resolution print with walls and scaffold-like eight stage mixing element). Print Studio v1.6.5 (Autodesk Inc.) was used to slice geometries, and all structures were oriented such that the largest surface area of any structure was oriented in the x–y plane. Since the light intensity in the vat changes throughout the lifetime of a print window, the UV exposure times were adjusted with each print in order to keep the total irradiation energy constant at approximately 60 mW cm−2 s−1.27,28
After printing, specimens were immersed in isopropyl alcohol (IPA) and sonicated for 10 minutes at room temperature in a digital ultrasonic cleaner to remove any uncured resin. Then, printed specimens were dried with compressed air and post-cured via direct UV exposure to a flood curing lamp (2000-EC UV Series, DYMAX) for 6 minutes.
Tensile testing
Tensile testing was carried out at a pulling speed of 10 mm min−1 in accordance with ASTM D638 on printed type V bars using an Instron 5966 dual column mechanical universal tester equipped with a 10 kN load cell. Five specimens were tested per condition. Young's modulus was calculated based on the first 1% of strain, which is well below the elastic limit of these composites. Toughness was calculated as the area under a given stress–strain curve. Fracture surfaces after tensile testing were imaged via a field-emission scanning electron microscope (JEOL JSM 7401F, JEOL USA Inc.). Specimens were gold sputtered prior to imaging.Dynamic mechanical analysis
A Netzsch DMA 242E in single cantilever mode was used for DMA. For single frequency measurements, printed bars were heated at 3 °C min−1 from −100 °C to 100 °C. The frequency was fixed at 1 Hz and the oscillation amplitude was set at 15 μm. For multi-frequency sweeps, the oscillation amplitude and temperature range were kept the same. Master curves were created from data measured in 3 °C isothermal steps over 3 decades of frequency (0.100, 0.333, 1.000, 3.333, 10.000, and 33.333 Hz).Thermogravimetric analysis and density measurement
Thermogravimetric analysis (TGA) was performed with a Discovery TGA (TA Instruments) to determine the amount of glass microspheres in the printed samples. Specimens were heated from room temperature to 700 °C with a heating rate of 20 °C min−1 under a nitrogen environment.Density measurements are necessary for calculation of glass microsphere volume fractions and molecular weight between crosslinks (Mc). A Sartorius Practum 313-1S precision balance, equipped with a Sartorius density measurement kit (YDK 01), was used to measure density. Samples were weighed in air and water at room temperature, with a precision of 0.001 g.
Results and discussion
Thermogravimetric analysis
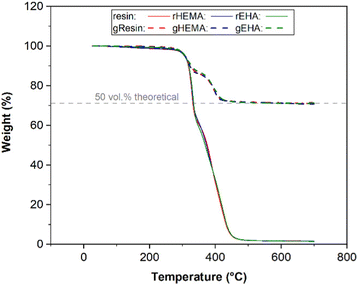
TGA was used to determine the amount of glass microspheres in the printed bars for tensile tests, since any material remaining after degradation of the polymer phase would be glass. Representative TGA curves are presented in Fig. 1. The average onset decomposition temperature of printed neat samples (base and modified resin systems) is 313.5 °C, with the thermosetting polymer network fully decomposing by 455.0 °C.In this study, the target volume fraction of glass microspheres in the printed specimens was 50 vol%. 2530 A and 5000 A glass microspheres have a density of 2.53 g cm−3. The densities for printed base (resin), modified resin with HEMA (rHEMA), and modified resin with EHA (rEHA) are 1.03, 1.06, and 1.05 g cm−3, respectively. The glass weight percentages in composite systems with the base resin (gResin) and resins modified with HEMA (gHEMA) or EHA (gEHA) were measured to be 71.12 wt%, 70.58 wt%, and 70.80 wt%, respectively. Based on these weights, volume fractions for these samples following the same order are calculated to be 50.04 vol%, 50.08 vol%, and 50.09 vol%. Because the variations between 50 vol% theoretical value and experimental volume percentages are relatively small, TGA results confirm that the target volume fraction of 50 vol% is reached for all the printed glass microsphere-filled samples.
Mechanical properties and fractography
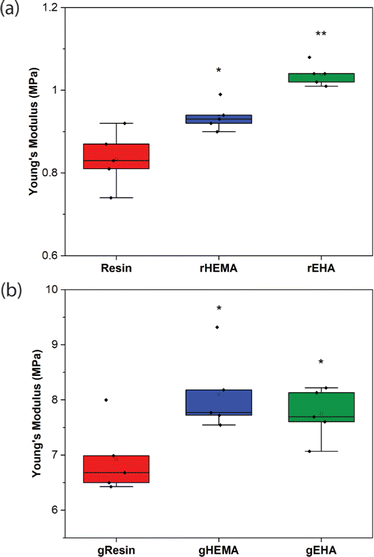
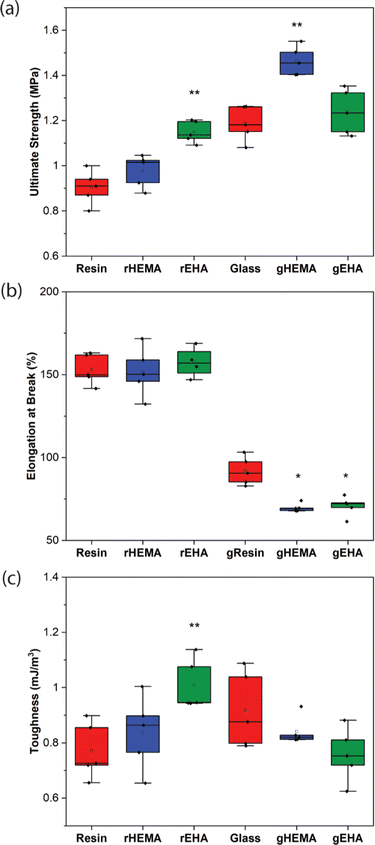
Representative stress–strain curves for DLP-printed neat and glass microsphere-filled samples are presented in Fig. 2. All stress–strain curves are provided in Fig. S1 (ESI†). Results of Young's modulus, elongation at break, fracture strength, ultimate strength, and toughness from tensile testing are summarized in Fig. 3 and 4.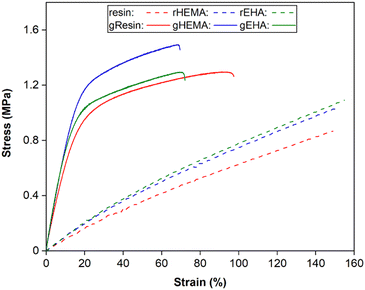 | ||
| Fig. 2 Representative stress–strain curves from tensile testing of neat and glass microsphere-filled samples. | ||
As shown in Fig. 2–4, neat and glass microsphere-filled samples exhibit a range of mechanical properties. Compared with neat samples, all glass microsphere-filled samples have higher Young's modulus and lower elongation and break. Improvements in Young's modulus for composite specimens are expected, since the addition of glass microspheres leads to stiffening of the system.29–31 The addition of glass microspheres also restricts mobility of the thermosetting polymer network and magnifies the strain experienced by the polymer matrix, which result in shorter elongations at break.30,32
For neat polymer systems, Young's modulus and fracture/ultimate strength are statistically significantly different at a 95% confidence interval based on a one-way analysis of variance (ANOVA), as show in Fig. 3(a). The rEHA condition exhibits significantly higher Young's modulus, strength, and toughness than the other two systems. However, no significant differences are observed for elongation at break. Addition of different monomers to the base resin system leads to more complex polymer network structures and different crosslink densities. Mc values are calculated based on DMA in the next section, and higher crosslink density/lower Mc in the modified resin systems are associated with increased Young's modulus and strength.
Young's modulus, elongation at break, and fracture/ultimate strength of composite systems are statistically significantly different at a 95% confidence interval. Furthermore, the composite with a HEMA-modified resin systems (gHEMA) exhibits a fracture strength that is significantly higher than gEHA, which indicates that changes to interfacial interactions contribute to tensile properties, particularly because rHEMA has a similar strength to the base resin. HEMA monomers contain –OH groups that can hydrogen bond to glass microsphere surfaces and further improve the overall mechanical performance.33,34 However, 2-ethylhexyl groups from EHA monomers tend to repel glass surfaces, leading to lower modulus and strength for gEHA than gHEMA. Young's modulus for gEHA is higher than gResin's, indicating glass prefers EHA to the base resin.
Another way to assess these systems is to evaluate the effect of glass microsphere addition to a given resin system. The differences between the composites are larger in magnitude than for the neat polymer systems when comparing base and HEMA-containing formulations, but smaller when comparing base and EHA-containing formulations. For example, rHEMA's Young's modulus is 12.5% higher than the base resin and gHEMA's Young's modulus is 17.3% higher than gResin, while rEHA's Young's modulus is 25% higher than the base resin and gEHA's Young's modulus is only 11.6% higher than gResin. Similarly, rHEMA is 8.7% stronger than the base resin and gHEMA is 23.8% stronger than gResin, but rEHA is 15.2% stronger than the base resin and gEHA is 7.4% stronger than gResin. These differences indicate that interactions between the glass and resin additives are important to modulating mechanical properties.
Printed composite samples behave similarly to adhesively-bonded structures: better wettability leads to higher strength of printed composites or higher interfacial fracture energies of adhesively-bonded structures. In previous work, we showed that the interfacial fracture energy between resins with HEMA and glass is higher than between resins with EHA and glass,22 similar to what is reported here. In other previous work, we found that when only non-covalent bonding is available for the composite, decreasing resin contact angles on silane-functionalized surfaces led to stiffer and stronger composites.23,35 In comparing all of these studies, we observe that surface functionalization leads to more pronounced changes in wettability and mechanical (adhesive and tensile) properties. One likely reason for this difference is that silane coupling agents are able to achieve complete coating of a surface, while migration of resin additives to the glass surface is less effective. For example, use of an amine silane coupling agent on glass fibers with a similar silanization process to what was used in Wang et al. resulted in an amine surface concentration of 0.32 amines nm−2.23,35,36 To achieve the same surface concentration of HEMA, only 0.11 wt% of the resin would need to be HEMA if all of the HEMA migrated to the glass surface. A homogeneous distribution of HEMA throughout the polymer network would provide approximately 0.066 HEMA nm−2. While it is not possible to quantify the amount of HEMA or EHA at the glass-resin interface, it is reasonable to assume that it is between 0.066 and 0.32 molecules nm−2. The reduced efficiency of glass surface coating for resin additives is likely due to their compatibility with other resin components, which reduces the driving force for monomer diffusion to the glass surface.
Micrographs of fracture surfaces of the three composite systems are shown in Fig. 5. The fracture surface for the base resin composite, as shown in Fig. 5(a), exhibits more interfacial debonding than the modified resin composites, indicating worse compatibility between the thermosetting polymer matrix and glass microspheres. These results are consistent with the inferior mechanical performance shown in Fig. 2–4. Meanwhile, fewer or no obvious defects are observed on the fracture surfaces of modified resin composites, as shown in Fig. 5(b) and (c).
Dynamic mechanical analysis
Results from DMA single frequency measurements, including average glass transition temperatures (Tg) for printed neat and glass microsphere-filled samples, are shown in Fig. 6 and Table 1. Tg is given as the temperature at the peak in loss modulus (E′′) and all values are in a similar range of approximately −45 °C. The broad loss modulus peaks around Tg in all samples are due to complex and heterogeneous polymer networks.37,38 The presence of shoulders between −20 °C and 0 °C in the loss modulus curves of microsphere-filled specimens is consistent with network heterogeneity and possible phase separation.39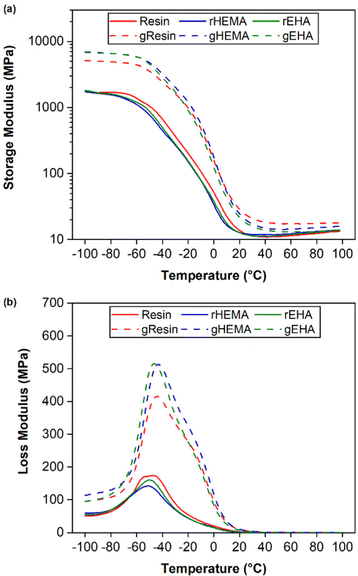 | ||
| Fig. 6 DMA of printed specimens under single cantilever mode at 1 Hz. (a) storage modulus (E′) and (b) loss modulus (E′′). | ||
| T g (°C) | E′ at −80 °C (GPa) | E a (kJ mol−1) | |
|---|---|---|---|
| Resin (neat) | −44.3 ± 0.6 | 1.69 ± 0.25 | 168.7 |
| rHEMA | −46.8 ± 2.3 | 1.55 ± 0.50 | 189.7 |
| rEHA | −46.9 ± 0.4 | 1.60 ± 0.52 | 183.1 |
| gResin | −45.7 ± 1.5 | 4.95 ± 0.76 | 170.4 |
| gHEMA | −43.4 ± 0.8 | 6.39 ± 0.37 | 180.0 |
| gEHA | −46.1 ± 1.6 | 6.18 ± 0.34 | 162.2 |
The HEMA-modified resin composite (gHEMA) has the highest glassy storage modulus. Glassy storage moduli of base (gResin) and EHA-modified resin (gEHA) composites are ≈70% and ≈79% of the result for gHEMA. These results provide further evidence that the interfacial interactions between HEMA-modified resins and glass microspheres are stronger than those between the base resin or EHA-modified resin and glass microspheres, consistent with bulk adhesion measurements.22 Similar to tensile testing results, composite samples have higher glassy storage moduli than those of neat samples due to the stiffening effect of glass microspheres.34,40
Rubber elasticity theory is typically used to estimate Mcviaeqn (1):
 | (1) |
To further investigate thermal transitions and network structures, multi-frequency sweeps were performed on neat and glass microsphere-filled systems, as shown in Fig. S2–S7 (ESI†). Changes in molecular conformation require thermal energy, which is directly related to the thermal transitions of polymers. To determine whether the Tg calculated from the temperature at the peak of E′′ corresponds to an α transition (i.e., glass transition) or other transitions (i.e., β or γ- transition), Arrhenius activation energy (Ea) values were calculated according to eqn (2):
 | (2) |
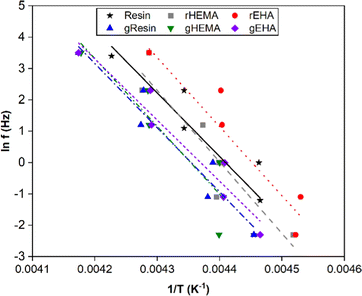 | ||
| Fig. 7 Natural log of frequency vs. 1/T for determination of Arrhenius activation energies for the base and modified resin systems. | ||
Time-temperature superposition (TTS) was used to investigate viscoelastic properties of printed neat and microsphere-filled systems. This principle allows for the construction of mastercurves in order to predict properties beyond experimentally accessible time scales. To describe TTS, the Williams–Landel–Ferry (WLF) equation is used,45 which is expressed as:
 | (3) |
As shown in Fig. 8(a), the multi-frequency responses of all systems can be successfully shifted to form mastercurves. All resin systems provide similar mastercurves. With higher E′ at higher frequencies, the glass-reinforced composites behave more like elastic solids. gHEMA and gEHA show strong similarity across the frequency range, while gResin shows lower stiffness, especially at higher frequencies. This behavior is consistent with the higher Young's moduli and glassy E′ observed in gHEMA and gEHA as compared to gResin. These results show a correlation between improved resin wettability (lower resin contact angle) and higher E′ at higher frequencies. Based on the results from single and multi-frequency sweeps, we can tailor impact and other high frequency behaviors by changing the resin formulation or adding solid reinforcements and controlling their interfacial interactions through resin formulation.
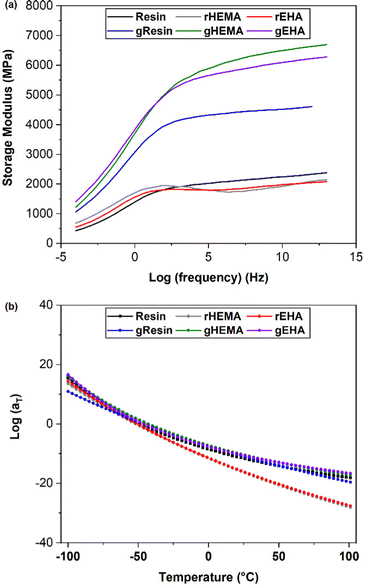 | ||
| Fig. 8 (a) Mastercurves for printed neat and glass microsphere filled systems. (b) WLF shift factors for printed neat and glass microsphere filled systems fit to the WLF equation. | ||
Print resolution assessment
In order to demonstrate the printability of one of the thermosetting resin systems filled with glass microspheres, a resolution testing structure with a range of different thicknesses of vertical walls and trenches7 was printed using the gHEMA formulation, which contained 50 vol% glass microspheres and is shown in Fig. 9. Walls can be resolved down to 425.6 μm (Fig. 9(b)). The thinnest printable trench has a thickness of 464.3 μm (Fig. 9(c)). Compared with the original CAD design of the resolution print with walls and trenches (Fig. S8, ESI†), all successfully printed walls are oversized by ≈ 6% and the vertical trenches are undersized by ≈ 7%. This phenomenon is likely due to the light scattering from the 50 vol% glass microspheres.A mixing element with eight scaffold-based stages, shown in Fig. 10, was also printed with the gHEMA resin. Each stage has the same design, but is rotated 90° as compared to the adjacent stages. Struts could be successfully fabricated orthogonal to and at diagonals to the build surface. Similar to the resolution print, struts were oversized, with a designed thickness of 0.5 mm and printed thickness of 0.55 ± 0.02 mm.
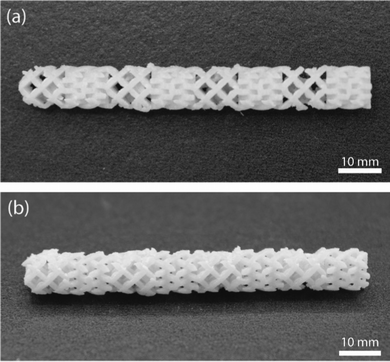 | ||
| Fig. 10 Additively manufactured complex composite structure. (a) Top-down view and (b) side view of an experimental mixing element with eight stages. | ||
Conclusions
In this work, we used DLP to fabricate specimens, including UV-curable acrylate polymer networks and printed composites with 50 vol% glass microspheres. Instead of using dispersants, we investigated the addition of co-monomers that preferentially interact with the glass surface to a base urethane acrylate resin system and studied the effects of polymer formulation and glass reinforcement on a range of properties.When distinct resin formulations and glass microsphere incorporation are available, interfacial interactions affect the mechanical and viscoelastic properties of DLP printed parts. Interestingly, Tg does not seem to be affected by these relatively small changes in resin formulation or by the substantial addition of 50 vol% glass microspheres. Different resin formulations lead to changes in molecular weight between crosslinks, which further affects the mechanical properties of printed neat samples. The addition of glass microspheres with 50 vol% loading result in further stiffening of printed parts.
Previous work showed that resins chemistries affect the interfacial fracture energies of adhesively bonded structures and that resin wettability was predictive of interfacial fracture energy.22 In other previous work, we demonstrated that changes to glass microsphere surface chemistry led to interface-mediated mechanical properties.23 In this work, we extend the principles from both of those reports and show that increasing resin wettability to the glass reinforcement surfaces through resin modification leads to stronger and stiffer composite materials. It is not always practical or feasible to functionalize a reinforcement's surface, so this work demonstrates that improvements in composite stiffness and strength can be made through improving resin wettability. Complex structures with high solid loading and tailorable performance can be achieved through additive manufacturing.
Author contributions
Conceptualization: Y. W., A. M. P., E. J. R.; funding acquisition: C. J. H., A. M. P.; methodology: Y. W., A. P. D., I. M. M., A. M. P.; formal analysis, investigation: Y. W., A. P. D.; project administration: C. J. H., A. M. P.; supervision: C. J. H., A. M. P.; writing-original draft: Y. W., A. M. P.; writing-review & editing: C. J. H., A. M. P., I. M. M., E. J. R.Conflicts of interest
There are no conflicts to declare.Acknowledgements
The authors acknowledge the U.S. Army Research Laboratory for financial support under a Cooperative Agreement, contract W911NF-19-2-0100.References
- H. Quan, T. Zhang, H. Xu, S. Luo, J. Nie and X. Zhu, Bioact. Mater., 2020, 5, 110–115 CrossRef PubMed.
- G. A. Appuhamillage, N. Chartrain, V. Meenakshisundaram, K. D. Feller, C. B. Williams and T. E. Long, Ind. Eng. Chem. Res., 2019, 58, 15109–15118 CrossRef CAS.
- C. Mendes-Felipe, J. Oliveira, I. Etxebarria, J. L. Vilas-Vilela and S. Lanceros-Mendez, Adv. Mater. Technol., 2019, 4, 1800618 CrossRef.
- S. C. Ligon, R. Liska, J. Stampfl, M. Gurr and R. Mulhaupt, Chem. Rev., 2017, 117, 10212–10290 CrossRef CAS PubMed.
- A. Bagheri and J. Jin, ACS Appl. Polym. Mater., 2019, 1, 593–611 CrossRef CAS.
- S. C. Ligon-Auer, M. Schwentenwein, C. Gorsche, J. Stampfl and R. Liska, Polym. Chem., 2016, 7, 257–286 RSC.
- D. M. Shah, J. Morris, T. A. Plaisted, A. V. Amirkhizi and C. J. Hansen, Addit. Manuf., 2021, 37, 101736 CAS.
- Y.-H. Lee, J.-B. Lee, W.-Y. Maeng, Y.-H. Koh and H.-E. Kim, J. Eur. Ceram. Soc., 2019, 39, 4358–4365 CrossRef CAS.
- Z. Chen, J. Li, C. Liu, Y. Liu, J. Zhu and C. Lao, Ceram. Int., 2019, 45, 11549–11557 CrossRef CAS.
- Y. Liu, L. Cheng, H. Li, Q. Li, Y. Shi, F. Liu, Q. Wu and S. Liu, Ceram. Int., 2020, 46, 14583–14590 CrossRef CAS.
- M. Borlaf, N. Szubra, A. Serra-Capdevila, W. W. Kubiak and T. Graule, J. Eur. Ceram. Soc., 2020, 40, 1574–1581 CrossRef CAS.
- L. Lin, H. Wu, Y. Xu, K. Lin, W. Zou and S. Wu, Mater. Chem. Phys., 2020, 249, 122969 CrossRef CAS.
- G. Ding, R. He, K. Zhang, M. Xia, C. Feng and D. Fang, Ceram. Int., 2020, 46, 4720–4729 CrossRef CAS.
- G. Varghese, M. Moral, M. Castro-García, J. J. López-López, J. R. Marín-Rueda, V. Yagüe-Alcaraz, L. Hernández-Afonso, J. C. Ruiz-Morales and J. Canales-Vázquez, Bol. Soc. Esp. Ceram. Vidrio, 2018, 57, 9–18 CrossRef CAS.
- I. Kim, S. Kim, A. Andreu, J.-H. Kim and Y.-J. Yoon, Addit. Manuf., 2022, 52, 102659 CAS.
- T. Hafkamp, G. van Baars, B. de Jager and P. Etman, Mechatronics, 2018, 56, 220–241 CrossRef.
- G. Mitteramskogler, R. Gmeiner, R. Felzmann, S. Gruber, C. Hofstetter, J. Stampfl, J. Ebert, W. Wachter and J. Laubersheimer, Addit. Manuf., 2014, 1–4, 110–118 Search PubMed.
- K. Zhang, R. He, C. Xie, G. Wang, G. Ding, M. Wang, W. Song and D. Fang, Ceram. Int., 2019, 45, 12189–12195 CrossRef CAS.
- I. L. d Camargo, M. M. Morais, C. A. Fortulan and M. C. Branciforti, Ceram. Int., 2021, 47, 11906–11921 CrossRef CAS.
- Y. Wei, D. Zhao, Q. Cao, J. Wang, Y. Wu, B. Yuan, X. Li, X. Chen, Y. Zhou, X. Yang, X. Zhu, C. Tu and X. Zhang, ACS Biomater. Sci. Eng., 2020, 6, 1787–1797 CrossRef CAS PubMed.
- K. Li and Z. Zhao, Ceram. Int., 2017, 43, 4761–4767 CrossRef CAS.
- Y. Wang, C. J. Hansen, I. M. McAninch, E. J. Robinette and A. M. Peterson, ACS Appl. Polym. Mater., 2022, 4, 4244–4253 CrossRef CAS.
- Y. Wang, A. Delarue, I. M. McAninch, C. J. Hansen, E. J. Robinette and A. M. Peterson, ACS Appl. Polym. Mater., 2022, 4, 6477–6486 CrossRef CAS.
- W. Zhou, D. Li and Z. Chen, Int. J. Adv. Des. Manuf. Technol., 2010, 52, 575–582 CrossRef.
- C. Servais, R. Jones and I. Roberts, J. Food Eng., 2002, 51, 201–208 CrossRef.
- C. R. Wildemuth and M. C. Williams, Rheol. Acta, 1984, 23, 627–635 CrossRef CAS.
- J. Bennett, Addit. Manuf., 2017, 18, 203–212 CAS.
- D. Xue, Y. Wang and D. Mei, J. Manuf. Process., 2019, 39, 106–113 CrossRef.
- M. D. Kiran, H. K. Govindaraju, T. Jayaraju and N. Kumar, Mater. Today: Proc., 2018, 5, 22421–22424 CAS.
- H. Unal and A. Mimaroglu, J. Reinf. Plast. Compos., 2016, 23, 461–469 CrossRef.
- A. C. Moloney, H. H. Kausch, T. Kaiser and H. R. Beer, J. Mater. Sci., 1987, 22, 381–393 CrossRef CAS.
- J. Móczó and B. Pukánszky, J. Ind. Eng. Chem., 2008, 14, 535–563 CrossRef.
- C. J. T. Landry, B. Coltrain, D. M. Teegarden, T. E. Long and V. K. Long, Macromolecules, 1996, 29, 4712–4721 CrossRef CAS.
- S. Wong, R. Shanks and A. Hodzic, Compos. Sci. Technol., 2004, 64, 1321–1330 CrossRef CAS.
- Y. Wang, C. J. Hansen, C.-C. Wu, E. J. Robinette and A. M. Peterson, RSC Adv., 2021, 11, 31142–31151 RSC.
- A. M. Peterson, R. E. Jensen and G. R. Palmese, ACS Appl. Mater. Interfaces, 2013, 5, 815–821 CrossRef CAS PubMed.
- J. M. Sadler, A.-P. T. Nguyen, F. R. Toulan, J. P. Szabo, G. R. Palmese, C. Scheck, S. Lutgen and J. J. La Scala, J. Mater. Chem. A, 2013, 1, 12579–12586 RSC.
- R. E. Jensen, G. R. Palmese and S. H. McKnight, Int. J. Adhes. Adhes., 2006, 26, 103–115 CrossRef CAS.
- Ş. Tatiana, B. Ryan, A. Ivanković and N. Murphy, Int. J. Adhes. Adhes., 2020, 101, 102630 CrossRef.
- C. G. Robertson, C. J. Lin, M. Rackaitis and C. M. Roland, Macromolecules, 2008, 41, 2727–2731 CrossRef CAS.
- G. Jeong, C. H. Park, B.-Y. Kim, J. Kim, S.-D. Park, H. Yang and W. S. Lee, ACS Appl. Polym. Mater., 2020, 2, 5228–5237 CrossRef CAS.
- P. J. Scott, V. Meenakshisundaram, N. A. Chartrain, J. M. Sirrine, C. B. Williams and T. E. Long, ACS Appl. Polym. Mater., 2019, 1, 684–690 CrossRef CAS.
- P. J. Flory, J. Chem. Phys., 1977, 66, 5720–5729 CrossRef CAS.
- B. Wunderlich, Thermal Analysis of Polymeric Materials, Springer Berlin, Heidelberg, 2005 Search PubMed.
- M. L. Williams, R. F. Landel and J. D. Ferry, J. Am. Chem. Soc., 1955, 77, 3701–3707 CrossRef CAS.
Footnote |
| † Electronic supplementary information (ESI) available: Tensile testing results, dynamic mechanical analysis frequency sweeps, and design of resolution print. See DOI: https://doi.org/10.1039/d2ma00892k |
| This journal is © The Royal Society of Chemistry 2023 |

