 Open Access Article
Creative Commons Attribution 3.0 Unported Licence
Methane conversion and hydrogen production over TiO2/WO3/Pt heterojunction photocatalysts†
Saulo Amaral
Carminati
 *a,
Eliane Ribeiro
Januário
 a,
Arthur Pignataro
Machado
b,
Patrícia Ferreira
Silvaino
a,
Jorge Moreira
Vaz
a and
Estevam Vitorio
Spinacé
a,
Arthur Pignataro
Machado
b,
Patrícia Ferreira
Silvaino
a,
Jorge Moreira
Vaz
a and
Estevam Vitorio
Spinacé
 *a
*a
aInstituto de Pesquisas Energéticas e Nucleares, IPEN-CNEN/SP, Av. Prof. Lineu Prestes, 2242-Cidade Universitaria, São Paulo, 05508-000, Brazil. E-mail: saulocarminati89@gmail.com; espinace@ipen.br
bLaboratório de Nanotecnologia e Energia Solar, Instituto de Química, Universidade Estadual de Campinas, Campinas, 13083-970, SP, Brazil
First published on 27th November 2023
Abstract
Along with the advantages of mild reaction conditions, simple operation, and low energy consumption, the photocatalytic conversion of methane in the presence of water presents great potential in facilitating direct methane conversion into value-added chemicals and H2 generation. In this work, TiO2/WO3 heterojunction photocatalysts modified with Pt nanoparticles were synthesized and their performances towards methane conversion into ethane (C2H6) and hydrogen (H2) in the presence of water were evaluated. The ternary photocatalysts were characterized by X-ray diffraction, UV-vis, scanning and transmission electron microscopy and X-ray photoelectron spectroscopy. The highly active TiO2/WO3/Pt photocatalyst achieved C2H6 and H2 production rates of 1.18 mmol g−1 h−1 and 57 mmol g−1 h−1, respectively. These values were 37% (for C2H6) and 34% (for H2) higher than those produced by a TiO2/Pt photocatalyst. The results show that the presence of WO3 in a very small concentration on TiO2 with the introduction of Pt as a co-catalyst contributes to achieving higher activities towards both C2H6 and H2 evolution.
Introduction
It is common sense that the rise in global population increases the demand for energy, which is mainly met by fossil resources, like coal, natural gas or oil.1 The consumption of fossil fuels and the emission of CO2 and other greenhouse gases have increased since the pre-industrial era, presenting one of the most pressing world challenges. The scientific and industrial community efforts over the last few decades have been spurred towards developing CO2-free emission technologies.2,3Methane (CH4), a potent greenhouse gas and a ubiquitous natural carbon resource, has been mainly used as an energy supply. It has the most robust C–H bonds (439 kJ mol−1) with the highest activation barrier among hydrocarbon molecules,4 requiring high temperatures and pressures to achieve high conversion rates, thereby making its conversion more challenging.5 Only about 10% of methane is utilized for chemical production to synthesize a variety of high-value-added chemicals.6 In this sense, the catalytic conversion of CH4 into multicarbon (C2+) products under mild conditions has received worldwide attention in the last few years.7 While many approaches have been followed over the years,8 photocatalysis is a promising game-changer. Employing solar energy would be one of the possible alternatives to overcome drawbacks associated with the thermodynamic barrier for the direct conversion of methane under mild conditions.9,10
Photocatalytic dehydrogenative coupling of methane in the presence of water has been recently reported in gas, liquid and gas–liquid–solid systems.11 Here, photocatalytic water splitting into H2 and methane conversion to the more valuable product C2H6 (ethane) are involved in the same reaction system, where CH4 is the sacrificial agent for holes.12 Ishimaru and co-workers13 investigated the effect of adding water vapor on the C2H6 formation rate over a Pd/Ga2O3 photocatalyst during CH4 conversion and the results showed that water promoted a substantial improvement in the C2H6 (selectivity > 80%) and H2 production (AQE = 14.4%). Despite progress, additional efforts must be done to bridge the gap between experimental studies and industrial implementation, which remains extremely challenging.14
Many kinds of semiconductor-based photocatalysts, such as TiO2,15 GaN,16,17 Ga2O3,18,19 BiVO420 and ZnO,21 have been developed for various types of methane conversion, including direct and indirect routes, tuning the product selectivity. The CH4 conversion and the selectivity of C2H6 are both low on pristine TiO2 due to poor separation efficiency of the photogenerated carriers, resulting in the production of undesired but thermodynamically favorable overoxidized products (i.e., CO and CO2).14
Among many semiconductors, it is well known that commercial TiO2 (P25) is taken as a proof-of-concept model for direct conversion of methane (CH4) toward value-added multicarbon (C2 +) compounds,22 either through non-oxidative23 or oxidative routes.24 To overcome the poor performance of TiO2 under visible light and high recombination rate of the charge carriers, strategies like ion doping and heterojunction construction have shown great results in photocatalysis.25 In particular, heterojunction systems have been attempted as an effective strategy for enhancing the overall photocatalytic efficiency of TiO2-based photocatalysts.26 For heterojunctions, the incorporation of alternative semiconductors such as WO3 may synergistically improve the photocatalytic efficiency of TiO2 under visible light irradiation, resulting from optical and electronic property modification.27,28 Additionally, the use of various co-catalysts is proven to be an effective approach to augment charge carrier separation.29
In this work, we investigated the photocatalytic properties of TiO2/WO3 heterojunction photocatalysts towards methane conversion into ethane (C2H6) and hydrogen in the presence of water through a gas–solid–liquid photocatalytic reaction system. To either promote better charge separation and more active sites for H2 production, Pt nanoparticles were deposited over the heterojunction photocatalyst surface. This work takes a step forward and presents for the first time the study of C2H6 photogeneration from CH4 conversion concomitantly with hydrogen evolution over photocatalysts based on TiO2/WO3 modified with Pt to increase the charge carrier separation under mild conditions. Different concentrations of WO3 were utilized and the photocatalytic activities were evaluated.
Experimental and discussion
Materials and methods
Titanium(IV) dioxide P25 (Degussa) was used as the support material. Ammonium tungstate hydrate ((NH4)10(H2W12O42)·4H2O), ethanol (C2H6O), isopropyl alcohol (C3H8O), nitric acid (HNO3), ethylene glycol (C2H6O2), and chloroplatinic acid (H2PtCl6·6H2O) were used. Deionized water used in the experiments was purified to 18.2 MΩ cm resistivity using an ultra-pure Milli-Q Millipore system.Sample preparation
For the synthesis of TiO2/WO3/Pt, a proper amount of TiO2 (P25 Degussa) was added into a 250 mL round-bottom flask containing 250 mL of ethylene glycol/water 3![[thin space (1/6-em)]](https://www.rsc.org/images/entities/char_2009.gif) :
:![[thin space (1/6-em)]](https://www.rsc.org/images/entities/char_2009.gif) 1 v/v solution. The suspension was stirred for 10 min and then sonicated for another 10 min. A desired aliquot of H2PtCl6·6H2O aqueous solution and a proper amount of the as-synthesized WO3 were added dropwise with continuous stirring until complete homogenization, to obtain 500 mg of material varying the WO3 concentration (0.1, 1, 3, 6, 12 and 25%). The Pt concentration was set to 0.5%, as it was the best amount of Pt previously tested by the group. The system was stirred under reflux at 180 °C for 1 h and then, the material was washed, centrifuged and dried at 80 °C for 2 h.
1 v/v solution. The suspension was stirred for 10 min and then sonicated for another 10 min. A desired aliquot of H2PtCl6·6H2O aqueous solution and a proper amount of the as-synthesized WO3 were added dropwise with continuous stirring until complete homogenization, to obtain 500 mg of material varying the WO3 concentration (0.1, 1, 3, 6, 12 and 25%). The Pt concentration was set to 0.5%, as it was the best amount of Pt previously tested by the group. The system was stirred under reflux at 180 °C for 1 h and then, the material was washed, centrifuged and dried at 80 °C for 2 h.
 | (1) |
Characterization of the materials
The crystalline structure of the materials was analyzed by X-ray diffraction (XRD) using Cu Kα radiation (λ = 0.15418 nm) and the XRD patterns were recorded on a Rigaku Miniflex II apparatus, with scanning at 2θ from 20° to 90° with 0.05 step and 2 s count. The UV-Vis diffuse reflectance spectra were recorded using a UV-Visible spectrophotometer with a wavelength range of 200–800 nm. The Pt content (wt%) was determined by wavelength-dispersive X-ray fluorescence (WD-XRF) spectroscopy on Rigaku Supermini equipment (Pd source, 50 kV–4 mA) using a calibration curve. The morphology of the photocatalysts was evaluated by transmission electron microscopy (TEM) at an acceleration voltage of 200 kV and the images were collected on a JEOL equipment model JEM 2100F. A scanning electron microscope (SEM) equipped with an energy dispersive X-ray spectroscopy (EDX) unit was used for elemental mapping. The valence states of each element were studied by X-ray photoelectron spectroscopy (XPS, Thermo Fisher Scientific) with an Al Kα X ray source (hν = 1486.6 eV). The photoluminescence (PL) spectra of the solid photocatalysts were taken with an Ocean Optics 2000 luminescence spectrometer + USB spectrometer with a CCD camera. The excitation wavelength was 265 nm and the spectra were recorded at room temperature over the range of 200–1000 nm, with the scanning speed at 1000 nm min−1, and the PMT voltage was 650 V.Results and discussion
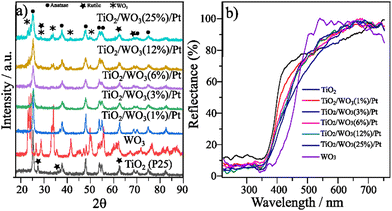
Commercial TiO2 (P25) comprises both anatase and rutile phases with an estimated composition of 84.2% anatase and 15.8% rutile.10 The XRD patterns of TiO2, WO3 and TiO2/WO3/Pt with 0.5 wt% of Pt varying the amount of WO3 are displayed in Fig. 1a. Given the low Pt content of the samples, no peaks different from those found in the TiO2 or TiO2/WO3 matrix were observed in the XRD patterns of the as-prepared photocatalysts. It can be observed that the anatase phase (JCPDS 00-021-1272, labelled •) predominates in the crystalline structure of TiO2 in all materials with a small rutile increment (labelled ).12 Upon WO3 incorporation (labelled
  ), the peaks of the monoclinic phase type (JCPDS 00-043-1035) of WO3 could be clearly seen only for TiO2/WO3 samples with 12% and 25%.30 Since the materials were not further calcined, the anatase/rutile proportion remained the same, as indicated by the XRD patterns. The synthesized photocatalysts were also characterized by UV-vis diffuse reflectance spectroscopy (DRS), and the sample spectra are shown in Fig. 1b. It is possible to notice that the TiO2 photocatalyst activation occurs around 400 nm of UV light. Upon WO3 incorporation, by increasing the concentration of WO3 in the composite, the reflectance tends to show a red shift, resulting from the combination of the two materials absorption with further contribution in the visible range of the small amount of Pt incorporated.
The optical band gap (Eg) of the as-prepared photocatalysts was determined by the Kubelka–Munk plots (ESI† (Fig. S1 and Table S1)). The Eg values of 3.10 and 2.68 eV agree with previous reports for TiO2 (P25)31,32 and WO3,33,34 respectively. The photocatalysts with a lower amount of WO3 (1% and 3%) did not change the Eg when compared with pristine TiO2. The TiO2/WO3/Pt photocatalysts with 6, 12 and 25% showed Eg values of 3.03, 3.02 and 2.93 eV, respectively, proving their capacity to additionally absorb parts of the visible light.
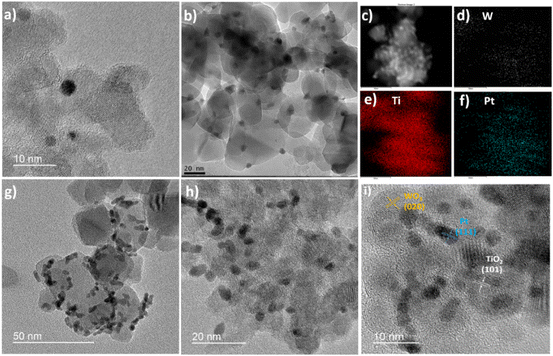
Fig. 2 shows the morphology of the as-prepared photocatalysts using TiO2 (P25 Degussa) as the support material, characterized by TEM. In Fig. 2a, it can be seen that Pt nanoparticles have a spherical shape, with nanoparticle sizes in the range of 2–5 nm. Fig. 2b shows the TEM images of the TiO2/WO3 heterojunction photocatalyst, with 6% of WO3. WO3 exhibits an irregular shape with sizes in the range of 5–15 nm. Additionally, the WO3 did not cover the entire surface of TiO2, but was deposited randomly around its surface.
Fig. 2c–f depicts the TiO2/WO3/Pt ternary composite morphology with the EDS mapping image, where WO3 (0.1 wt%) and Pt nanoparticles seem to be more agglomerated. The element distributions confirm the presence of Ti, O, W and Pt under high magnification. The EDX spectrum of the TiO2/WO3/Pt photocatalyst is shown in Fig. S2. The crystal structure information was further investigated by HRTEM. Fig. 2g–i show the morphology of the as-prepared TiO2/WO3/Pt ternary composite.
It can be observed that Pt nanoparticles are well distributed throughout the material. The clear lattice fringes with the spacings of 0.35 nm, 0.23 nm and 0.39 nm in a high-resolution TEM (HRTEM) image can be assigned to the (101), (111) and (020) crystal planes of TiO2, Pt and WO3 nanoparticles, respectively.35,36
The XPS analysis was used to determine the surface composition and the chemical valence state of the elements in the as-prepared samples, as shown in Fig. 3a–d. The XPS survey spectrum of the ternary composite is shown in Fig. 3a, indicating the presence of Ti, O, W and Pt elements. The survey spectrum of pristine TiO2 can be found in the ESI† (Fig. S3). In the Ti high-resolution spectrum (Fig. 3b), the peaks at 465.29 eV correspond to Ti2p1/2 and 459.57 eV to Ti2p3/2, respectively. Furthermore, the distance of the two peaks indicates the presence of Ti4+.37 The W4f (Fig. 3c) peaks split into two peaks at 36.26 eV (W4f5/2) and 38.17 eV (W4f7/2), indicating the presence of W6+. The peaks at 74.78 eV and 71.42 eV (Fig. 3d) correspond to Pt 4f5/2 and Pt 4f7/2, respectively.38 The peak shapes can be attributed to nanoparticles with Pt0 chemical state. No different oxidation states of Pt were observed, indicating the total reduction of Pt4+ to Pt0.
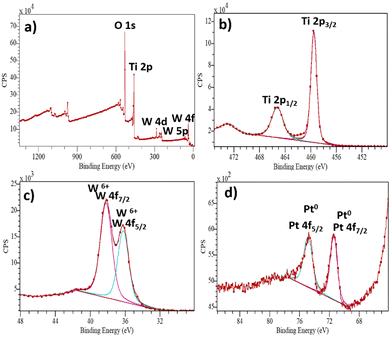 | ||
| Fig. 3 XPS spectra of the TiO2/WO3/Pt photocatalyst: (a) typical survey, (b) Ti 2p, (c) W4f and (d) Pt 4f. | ||
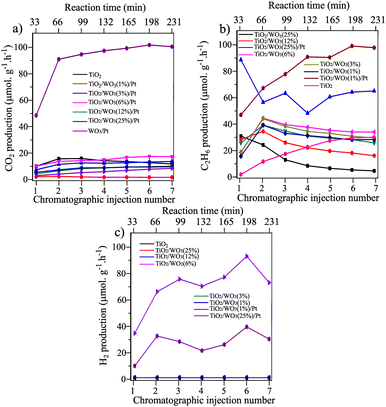
The effect of the improved charge separation by loading Pt nanoparticles on TiO2/WO3 in a heterojunction configuration could be evaluated by the photocatalytic methane conversion with simultaneous hydrogen evolution under UV illumination (75 mg of photocatalyst + 250 mL of ultrapure water, methane flow 25 mL min−1). Fig. 4 shows the CO2, C2H6 and H2 evolution rates (μmol g−1 h−1) over 7 injections into the GC-MS system under illumination (total irradiation time = 4 h). Prior to Pt deposition on TiO2/WO3, the optimum amount of WO3 was previously evaluated by the photocatalytic experiments. The results have shown that the CO2 evolution rate was more affected by the materials with higher amounts of WO3 (12 and 25%), where CO2 production was decreased by 69% by TiO2/WO3(12%) and 49% by TiO2/WO3(25%), compared with pristine TiO2 (P25), as shown in Fig. 4a. The C2H6 production was even more affected by higher amounts of WO3 and it is clearly observed that the production rate decreases constantly from the first to the last injection, reaching values lower than those by pristine TiO2, suggesting that the WO3 concentration should be lower. The TiO2/WO3 with 1, 3 and 6% of WO3 generated higher amounts of C2H6 with comparable values for CO2 with pristine P25. As depicted in Fig. 4c, no H2 evolution was achieved by the pristine TiO2 and TiO2/WO3 photocatalysts.
Observing the photocatalytic activity of the materials after Pt loading, the beneficial effect of combining the TiO2/WO3 heterostructure with the addition of Pt as a co-catalyst was clearly evidenced. The Pt loading on TiO2/WO3(25%) significantly decreased the CO2 and enhanced the C2H6 production, accompanied by H2 generation. The decrease in CO2 production rate was evidence that the undesired overoxidation to CO2 was inhibited after Pt loading. However, both C2H6 and H2 production did not show stability throughout the reaction, with a rapid decrease in their production within the first three injections, suggesting that the Pt nanoparticles should be incorporated in TiO2/WO3 with lower concentration of WO3.
The rapid decrease in the C2H6 and H2 evolution rate produced by the TiO2/WO3(25%)/Pt photocatalyst within the first three injections (Fig. 4b and c) may be assigned to the possible W6+ reduction to W5+ by receiving electrons from the conduction band (CB) of TiO2 upon illumination,39–41 decreasing their availability to drive the desired chemical reactions. Therefore, the electron transfer from the CB of TiO2 to the CB of WO3 with the subsequent reduction process of W6+ was competitive with the coupling reactions. This led to a rapid decrease in the C2H6 evolution rate accompanied by a photocatalyst colour change from light yellow to dark blue.
After the deposition of Pt nanoparticles on the TiO2/WO3(1%) material, a substantial increase in all products was observed, with better stability over the injections. The increased C2H6 production was highly different compared with TiO2/WO3(25%)/Pt, with a continuous rise during irradiation. The same behaviour is observed for CO2 and H2 production, with a boosted production of both products from the first to the second injection, accompanied by a gradual increase in their production. Considering that the photocatalytic activity of TiO2/WO3/Pt heterojunction photocatalysts showed a better performance when the WO3 concentration is very low, Pt loading was carried out on TiO2/WO3 with 0.1% of WO3 and the results are presented in Fig. 5.
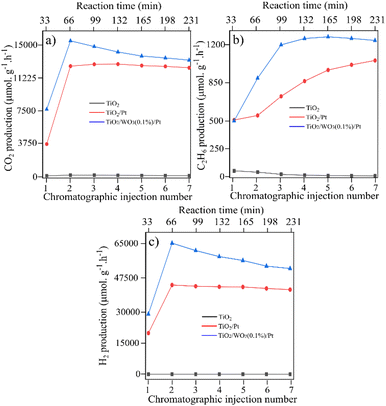 | ||
| Fig. 5 CH4 conversion towards the products over TiO2, TiO2/WO3 and TiO2/WO3/Pt photocatalysts towards (a) C2H6, (b) CO2 and (c) H2 generation. The TiO2 used as support was commercial P25 Degussa. | ||
Fig. 5 shows the photocatalytic activity over pristine TiO2 (P25), TiO2/Pt and TiO2/WO3(0.1%)/Pt photocatalysts. Here, both TiO2/Pt and TiO2/WO3(0.1%)/Pt photocatalysts presented a boosted photoactivity towards CO2, C2H6 and H2 evolution rate compared with pristine TiO2 (P25). In Fig. 5a, it is observed that the CO2 produced by Pt-based photocatalysts was very close, but the C2H6 and H2 production showed a substantial difference. For both the TiO2/Pt and TiO2/WO3(0.1%)/Pt photocatalysts, a continuous increase in C2H6 production is observed, but it is more pronounced for TiO2/WO3(0.1%)/Pt, reaching values 2.4 times higher from the first (510 μmol g−1 h−1) to the third injection (1196 μmol g−1 h−1).
The H2 evolution rate was dramatically improved by Pt loading on TiO2/WO3 with 0.1% of WO3. From the first to the second injection, the H2 production rate was increased by 115% and 119% by the TiO2/Pt (from 20![[thin space (1/6-em)]](https://www.rsc.org/images/entities/char_2009.gif) 175 μmol g−1 h−1 to 43
175 μmol g−1 h−1 to 43![[thin space (1/6-em)]](https://www.rsc.org/images/entities/char_2009.gif) 469 μmol g−1 h−1) and TiO2/WO3(0.1%)/Pt (from 29
469 μmol g−1 h−1) and TiO2/WO3(0.1%)/Pt (from 29![[thin space (1/6-em)]](https://www.rsc.org/images/entities/char_2009.gif) 230 μmol g−1 h−1 to 64
230 μmol g−1 h−1 to 64![[thin space (1/6-em)]](https://www.rsc.org/images/entities/char_2009.gif) 069 μmol g−1 h−1) photocatalysts, respectively. The results suggest that the WO3 concentration in the ternary composite in a very small content is a key point for boosting both C2H6 and H2 production, while maintaining the same amount of CO2 and CO evolution. These results indicate that, by decreasing the amount of WO3, charge carrier recombination is inhibited, and hence the photogenerated electrons become more available to drive the coupling reactions, instead of promoting W6+ reduction, with the additional Pt effect on collecting them. In contrast, the over-loading of WO3 domains clearly produced a decrease of the photocatalytic efficiency.
069 μmol g−1 h−1) photocatalysts, respectively. The results suggest that the WO3 concentration in the ternary composite in a very small content is a key point for boosting both C2H6 and H2 production, while maintaining the same amount of CO2 and CO evolution. These results indicate that, by decreasing the amount of WO3, charge carrier recombination is inhibited, and hence the photogenerated electrons become more available to drive the coupling reactions, instead of promoting W6+ reduction, with the additional Pt effect on collecting them. In contrast, the over-loading of WO3 domains clearly produced a decrease of the photocatalytic efficiency.
Different works have also shown a significant improvement in charge transfer between TiO2 and WO3, reaching better photocatalytic performances when the WO3 concentration is less than 1%.42,43 It has been demonstrated that higher WO3 content increases the concentration of recombination centers for electron/hole pairs, contributing to lowering the photoactivity of TiO2–WO3-based photocatalysts.44
Karácsonyi and co-workers45 showed that significant differences in the photocatalytic performance of the TiO2/WO3/(Pt or Au) photocatalysts towards oxalic acid degradation were observed only through the position of the noble metal, if the co-catalyst is deposited on TiO2 or on WO3. It was demonstrated that, by changing the WO3 concentration from 1 to 33%, none of the ternary composites reached H2 values higher than TiO2/Pt (without WO3). In our work, our results indicate that an optimum WO3 content should be lower than 1% to achieve a beneficial effect towards C2H6 and H2 from CH4 conversion in the presence of water.
The production rates of the main products (C2H6, CO, CO2 and H2) generated during the photocatalytic tests are summarized in Table 1. The table also depicts the generation of propane (C3H8), but in minor quantity and the selectivity of the products. Comparing TiO2/Pt with the TiO2/WO3(0.1%)/Pt photocatalyst, it can be observed that similar amounts of CO and CO2 were achieved. However, the incorporation of 0.1% WO3 to form the heterojunction system increased the C2H6 and H2 production by 37 and 34%, respectively. This behaviour may be associated with the better charge carrier separation promoted by the interaction between the two semiconductors.46,47 By receiving electrons from the CB of TiO2 and injecting holes into its valence band (VB), the presence of WO3 in a small content may significantly decrease the charge carrier recombination in both semiconductors,48 giving holes and electrons more probability to drive the coupling reactions. Additionally, the boosted hydrogen production could only be possible after the presence of Pt nanoparticles. From the viewpoint of selectivity, CO2 is the dominant product generated, reaching 93.2 and 91.2% among the main products produced by TiO2/Pt and TiO2/WO3(0.1%)/Pt photocatalysts, respectively. The higher C2H6 selectivity for TiO2/WO3(0.1%)/Pt (8.5%) compared with TiO2/Pt (6.5%) implies the more efficient formation of ˙CH3 by the photogenerated holes of WO3.
| Photocatalyst | Product formation rates (μmol g−1 h−1) | Product selectivity (%) | |||||||
|---|---|---|---|---|---|---|---|---|---|
| C2H6 | C3H8 | CO | CO2 | H2 | C2H6 | C3H8 | CO | CO2 | |
| a The Pt concentration in all photocatalysts was set at 0.5% as the best condition previously tested. | |||||||||
| TiO2 (P25) | 45 | 4.0 | 46 | 177 | — | 16.5 | 1.5 | 16.9 | 65.1 |
| TiO2/WO3 (1%) | 60 | 8.1 | 30 | 134 | — | 25.9 | 3.5 | 12.9 | 57.7 |
| TiO2/WO3 (3%) | 66 | 9.2 | 36 | 133 | — | 27.0 | 3.8 | 14.7 | 54.5 |
| TiO2/WO3 (6%) | 69 | 7.1 | 29 | 234 | — | 20.3 | 2.1 | 8.6 | 69.0 |
| TiO2/WO3 (12%) | 11 | 0.7 | 40 | 189 | — | 4.6 | 0.3 | 16.6 | 78.5 |
| TiO2/WO3 (25%) | 23 | 1.3 | 6.7 | 29 | — | 38.3 | 2.2 | 11.2 | 48.3 |
| TiO2/Pta | 866 | 25 | 20 | 12![[thin space (1/6-em)]](https://www.rsc.org/images/entities/char_2009.gif) 425 425 |
42![[thin space (1/6-em)]](https://www.rsc.org/images/entities/char_2009.gif) 500 500 |
6.5 | 0.2 | 0.1 | 93.2 |
| WO3/Pta | 5.8 | 0.6 | 6.4 | 29 | — | 13.9 | 1.4 | 15.3 | 69.4 |
| TiO2/WO3 (0.1%)/Pta | 1183 | 33 | 20 | 12![[thin space (1/6-em)]](https://www.rsc.org/images/entities/char_2009.gif) 745 745 |
57![[thin space (1/6-em)]](https://www.rsc.org/images/entities/char_2009.gif) 014 014 |
8.5 | 0.2 | 0.1 | 91.2 |
| TiO2/WO3 (1%)/Pta | 158 | 8.0 | 12 | 1446 | 4814 | 16.5 | 1.5 | 16.9 | 65.1 |
| TiO2/WO3 (25%)/Pta | 109 | 17 | 19 | 96 | 1847 | 25.9 | 3.5 | 12.9 | 57.7 |
To further investigate the possible reasons for the enhanced photocatalytic activity of TiO2/WO3(0.1%)/Pt towards C2H6 and H2 evolution, the PL spectra of pristine TiO2 (P25), TiO2/Pt and TiO2/WO3(0.1%)/Pt were evaluated, as shown in Fig. 6. The peak located at 440 nm is mainly originated from the recombination of photogenerated electrons in oxygen vacancies or crystal defects in TiO2.49 Among the samples, pristine TiO2 (P25) displays the highest PL signal. The TiO2/Pt and TiO2/WO3(0.1%)/Pt reduced the PL intensity by 66 and 83%, respectively, compared to pristine TiO2. The better charge transfer between TiO2 and WO3 can significantly accelerate the carrier separation and suppress the fast recombination of the photoexcited electron–hole pair, which is a key factor in the photocatalytic reaction.50,51 This evidence together with the results shown in Table 1 clearly demonstrates the synergistic effect of charge separation promoted by WO3 together with the charge transfer promoted by Pt.
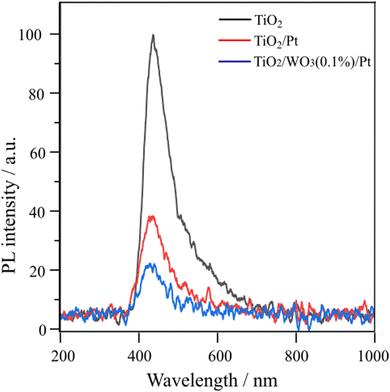 | ||
| Fig. 6 Room-temperature PL emission spectra of pristine TiO2 (P25), TiO2/Pt and TiO2/WO3/Pt photocatalysts (excitation wavelength at 265 nm). | ||
More recently, Sato and co-workers52 have shown that, combining real-time mass spectrometry and operando infrared absorption spectroscopy with ab initio molecular dynamics simulations, the C–H bond breaking of CH4 can be effectively enhanced in the presence of water, preventing the overstabilization of the intermediates. In addition, the water-assisted4 effects contribute to improving the photocatalytic conversion rates at ambient temperatures and pressures. In our work, combining methane conversion in the presence of water using a TiO2/WO3/Pt heterojunction under mild conditions collected all the advantages to boost the conversion of CH4 to C2H6 concomitantly with an increase in H2 evolution, although CO2 is still the main product coming from CH4 conversion.
The proper alignment of the energy levels of the VB and CB in TiO2 and WO3 promoting the charge transfer between them is displayed in Fig. 7. Upon illumination, both TiO2 and WO3 semiconductors absorb energy higher than their bandgap values, generating electron/hole pairs. The formation of a TiO2/WO3 heterojunction provides the thermodynamic driving force for the direct electron transfer from the CB of TiO2 into the CB of WO3, whereas holes in the VB of WO3 move to the VB of TiO2, thereby inhibiting deleterious charge carrier recombination.53 By introducing Pt nanoparticles, efficient cooperation between the charge separation through the heterojunction system and the collection of electrons over Pt sites is achieved.54
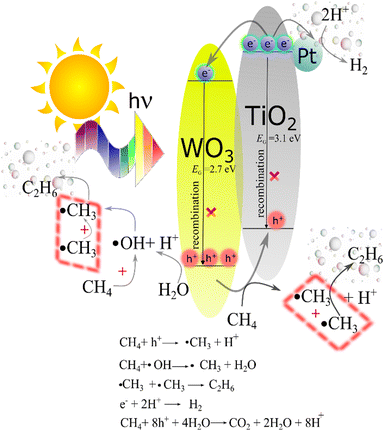 | ||
| Fig. 7 Energy diagram depicting the charge carrier flux in the TiO2/WO3/Pt ternary photocatalyst under illumination, inhibiting charge carrier recombination towards CH4 conversion and H2 production. | ||
Fig. 7 also shows the photocatalytic processes of the main products achieved in our system. Firstly, ˙CH3 radicals are formed from water reacted with h+. Afterwards, the following coupling of ˙CH3 is responsible for C2H6 production, while electrons (e−) at the Pt sites reduce H+ species to form H2. The overoxidation of CH4 towards CO2 is carried out by holes, being the main product of the overall reaction.
Yu and co-workers55 also describe the role of Pt in promoting the activation of CH4 molecules to form ˙CH3 radicals over TiO2/Pt photocatalysts during direct methane conversion and hydrogen evolution in a photocatalytic system. They show that the subsequent coupling of ˙CH3 brings up the C2H6 product, while H2 is generated through H+ reaction with electrons.
In our work, efficient charge carrier separation was obtained through the combination of a TiO2/WO3 heterojunction system in cooperation with Pt co-catalysts to promote higher C2H6 and H2 generation. Here, TiO2/Pt and TiO2/WO3(0.1%)/Pt photocatalysts generated equal values of CO2, while C2H6 and H2 production presented a substantial improvement, demonstrating the beneficial effect of combining charge carrier transfer through the heterojunction of TiO2/WO3 with the additional role of Pt on promoting boosted CH4 conversion.
Conclusions
Owing to the introduction of WO3 and Pt, the TiO2/WO3/Pt heterojunction photocatalyst exhibited better performance over CH4 conversion into C2H6 and H2 compared to the pristine materials. Pristine TiO2 (P25) nanoparticles were proved to be ineffective in driving CH4 conversion with no H2 production. This study showed that the presence of WO3 in a low concentration is an efficient way to benefit the C2H6 formation rate due to better charge separation and by introducing Pt nanoparticles, H2 generation was achieved. The synergistic effect between the materials contributed to the selective coupling of CH4 towards C2H6 and H2 production. Herein, we described the achievement of a new promising candidate material towards methane conversion with simultaneous generation of hydrogen through a non-thermal heterogeneous catalysis of methane under mild conditions. Notwithstanding this, CO2 remains the primary product generated from methane. The pursuit of enhancing photocatalyst activity and refining selectivity toward the desired products remains an ongoing imperative. This work may be helpful for extending the possibilities towards the design of future nanomaterials for methane coupling with hydrogen generation in the presence of water simultaneously in one system.Author contributions
S. A. C. performed the synthesis and characterization of the materials with further photocatalytic tests, and writing. E. R. J. collaborated in analyses, and discussion of results. P. S. F. participated in the catalyst preparation and photocatalytic tests. A. P. M. contributed with PL measurements and discussion of the results. J. M. V. and E. V. S. designed the study and reviewed the paper. All authors have read and agreed to the published version of the manuscript.Conflicts of interest
There are no conflicts to declare.Acknowledgements
The authors gratefully acknowledge São Paulo Research Foundation (FAPESP – grant numbers 2017/11937-4, 2018/04596-9, 2018/04595-2, 2021/01896-4 and 2023/01980-0) for the financial support and fellowship, Brazilian National Council for Scientific Development (CNPq – Grant numbers 305622/2020-0 and 407967/2022-2), Shell and ANP (Brazilian National Oil, Natural Gas and Biofuels Agency) through R&D levy regulation. We thank LNNano for XPS measurements (proposal no. 20221012) and TEM (proposal no. 20210567). We also thank Prof. Ana Flavia Nogueira from LNES (Laboratório de Nanotecnologia e Energia Solar) at the University of Campinas (UNICAMP) for providing access to the PL spectrometer.References
- M. Z. Jacobson, Energy Environ. Sci., 2009, 2, 148–173 RSC
.
- J. R. McKone, D. C. Crans, C. Martin, J. Turner, A. R. Duggal and H. B. Gray, Inorg. Chem., 2016, 55, 9131–9143 CrossRef CAS PubMed
.
- T. Shi, D. Sridhar, L. Zeng and A. Chen, Electrochem. Commun., 2022, 135, 107220 CrossRef CAS
.
- H. Sato, A. Ishikawa, H. Saito, T. Higashi, K. Takeyasu and T. Sugimoto, Commun. Chem., 2023, 6, 8 CrossRef CAS PubMed
.
- J. Zhao, H. Yan and J. Zeng, Chem Catal., 2022, 2, 1521–1523 CrossRef CAS
.
- M. Ishimaru, F. Amano, C. Akamoto and S. Yamazoe, J. Catal., 2021, 397, 192–200 CrossRef CAS
.
- Y. Tang, Y. Li and F. (Feng) Tao, Chem. Soc. Rev., 2022, 51, 376–423 RSC
.
- S. Wu, X. Tan, J. Lei, H. Chen, L. Wang and J. Zhang, J. Am. Chem. Soc., 2019, 141, 6592–6600 CrossRef CAS PubMed
.
- F. He, F. Ma, T. Li and G. Li, Chin. J. Catal., 2013, 34, 2263–2270 CrossRef CAS
.
- J. A. Pinedo-Escobar, J. Fan, E. Moctezuma, C. Gomez-Solís, C. J. Carrillo Martinez and E. Gracia-Espino, ACS Omega, 2021, 6, 11840–11848 CrossRef CAS PubMed
.
- S. Wu, L. Wang and J. Zhang, J. Photochem. Photobiol., C, 2021, 46, 100400 CrossRef CAS
.
- L. Yu and D. Li, Catal. Sci. Technol., 2017, 7, 635–640 RSC
.
- M. Ishimaru, F. Amano, C. Akamoto and S. Yamazoe, J. Catal., 2021, 397, 192–200 CrossRef
.
- Y. Liu, Y. Chen, W. Jiang, T. Kong, P. H. C. Camargo, C. Gao and Y. Xiong, Research, 2022, 2022, 9831340 Search PubMed
.
- H. Song, X. Meng, S. Wang, W. Zhou, S. Song, T. Kako and J. Ye, ACS Catal., 2020, 10, 14318–14326 CrossRef
.
- K. Dutta, M. Shahryari and J. Kopyscinski, Ind. Eng. Chem. Res., 2020, 59, 4245–4256 CrossRef
.
- L. Li, S. Fan, X. Mu, Z. Mi and C.-J. Li, J. Am. Chem. Soc., 2014, 136, 7793–7796 CrossRef PubMed
.
- S. P. Singh, A. Anzai, S. Kawaharasaki, A. Yamamoto and H. Yoshida, Catal. Today, 2021, 375, 264–272 CrossRef CAS
.
- E. R. Januario, S. A. Carminati, A. Tofanello, B. L. da Silva, P. F. Silvaino, A. P. Machado, J. M. Vaz and E. V. Spinacé, Sustainable Energy Fuels, 2023, 7, 4288–4296 RSC
.
- S. Murcia-López, K. Villa, T. Andreu and J. R. Morante, Chem. Commun., 2015, 51, 7249–7252 RSC
.
- A. P. Machado, S. A. Carminati, E. R. Januário, P. S. Ferreira, J. M. Vaz and E. V. Spinacé, Methane, 2023, 2, 44–55 CrossRef
.
- S. J. Armaković, M. M. Savanović and S. Armaković, Catalysts, 2022, 13, 26 CrossRef
.
- W. Zhang, C. Fu, J. Low, D. Duan, J. Ma, W. Jiang, Y. Chen, H. Liu, Z. Qi, R. Long, Y. Yao, X. Li, H. Zhang, Z. Liu, J. Yang, Z. Zou and Y. Xiong, Nat. Commun., 2022, 13, 2806 CrossRef CAS PubMed
.
- D. R. Aireddy, A. Roy, D. A. Cullen and K. Ding, Catal. Today, 2023, 416, 113977 CrossRef CAS
.
- Z. Liu, B. Xu, Y.-J. Jiang, Y. Zhou, X. Sun, Y. Wang and W. Zhu, ACS Environ. Au, 2023, 3(5), 252–276 CrossRef CAS PubMed
.
- G. Yuniar, W. H. Saputera, D. Sasongko, R. R. Mukti, J. Rizkiana and H. Devianto, Molecules, 2022, 27, 5496 CrossRef CAS PubMed
.
- Y. Wang, H. Fu, X. Yang, X. An, Q. Zou, S. Xiong and D. Han, J. Mater. Sci., 2020, 55, 14415–14430 CrossRef CAS
.
- K. Kighuta, A.-I. Gopalan, D.-G. Lee, S.-W. Kim, S.-S. Park, D.-E. Lee, K.-P. Lee and W.-J. Kim, J. Environ. Chem. Eng., 2022, 10, 108224 CrossRef CAS
.
- J. Yang, D. Wang, H. Han and C. Li, Acc. Chem. Res., 2013, 46, 1900–1909 CrossRef CAS PubMed
.
- M. Kang, J. Liang, F. Wang, X. Chen, Y. Lu and J. Zhang, Mater. Res. Bull., 2020, 121, 110614 CrossRef CAS
.
- H. Yaghoubi, Z. Li, Y. Chen, H. T. Ngo, V. R. Bhethanabotla, B. Joseph, S. Ma, R. Schlaf and A. Takshi, ACS Catal., 2015, 5, 327–335 CrossRef CAS
.
- D. Cani, J. C. van der Waal and P. P. Pescarmona, Appl. Catal., A, 2021, 621, 118179 CrossRef CAS
.
- F. Raziq, A. Aligayev, H. Shen, S. Ali, R. Shah, S. Ali, S. H. Bakhtiar, A. Ali, N. Zarshad, A. Zada, X. Xia, X. Zu, M. Khan, X. Wu, Q. Kong, C. Liu and L. Qiao, Adv. Sci., 2022, 9, 2102530 CrossRef CAS PubMed
.
- M. Zych, K. Syrek, L. Zaraska and G. D. Sulka, Molecules, 2020, 25, 2916 CrossRef CAS PubMed
.
- Y. Wang, H. Fu, X. Yang, X. An, Q. Zou, S. Xiong and D. Han, J. Mater. Sci., 2020, 55, 14415–14430 CrossRef CAS
.
- N. Kunthakudee, T. Puangpetch, P. Ramakul and M. Hunsom, ACS Omega, 2022, 7(9), 7683–7695 CrossRef CAS PubMed
.
- B. Gong, X. Luo, N. Bao, J. Ding, S. Li and J. Yi, Surf. Interface Anal., 2014, 46, 1043–1046 CrossRef CAS
.
- Y. Wang, H. Fu, X. Yang, X. An, Q. Zou, S. Xiong and D. Han, J. Mater. Sci., 2020, 55, 14415–14430 CrossRef CAS
.
- L. Zhang, M. Qin, W. Yu, Q. Zhang, H. Xie, Z. Sun, Q. Shao, X. Guo, L. Hao, Y. Zheng and Z. Guo, J. Electrochem. Soc., 2017, 164, H1086–H1090 CrossRef CAS
.
- N. M. Makwana, R. Quesada-Cabrera, I. P. Parkin, P. F. McMillan, A. Mills and J. A. Darr, J. Mater. Chem. A, 2014, 2, 17602–17608 RSC
.
- A. Habtamu and M. Ujihara, RSC Adv., 2023, 13, 12926–12940 RSC
.
- J. Lee and W.-K. Jo, Catalysts, 2017, 7, 97 CrossRef
.
- M. V. Dozzi, S. Marzorati, M. Longhi, M. Coduri, L. Artiglia and E. Selli, Appl. Catal., B, 2016, 186, 157–165 CrossRef
.
- B. Grbić, N. Radić, S. Stojadinović, R. Vasilić, Z. Dohčević-Mitrović, Z. Šaponjić and P. Stefanov, Surf. Coat. Technol., 2014, 258, 763–771 CrossRef
.
- É. Karácsonyi, L. Baia, A. Dombi, V. Danciu, K. Mogyorósi, L. C. Pop, G. Kovács, V. Coşoveanu, A. Vulpoi, S. Simon and Z. Pap, Catal. Today, 2013, 208, 19–27 CrossRef
.
- I. A. Castro, G. Byzynski, M. Dawson and C. Ribeiro, J. Photochem. Photobiol., A, 2017, 339, 95–102 CrossRef
.
- L. Zhang, J. Guo, B. Hao and H. Ma, Opt. Mater., 2022, 133, 113035 CrossRef
.
- N. Moghni, H. Boutoumi, H. Khalaf, N. Makaoui and G. Colón, J. Photochem. Photobiol., A, 2022, 428, 113848 CrossRef
.
- X. Fan, J. Wan, E. Liu, L. Sun, Y. Hu, H. Li, X. Hu and J. Fan, Ceram. Int., 2015, 41, 5107–5116 CrossRef
.
- I. A. Castro, G. Byzynski, M. Dawson and C. Ribeiro, J. Photochem. Photobiol., A, 2017, 339, 95–102 CrossRef
.
- F. M. Pesci, G. Wang, D. R. Klug, Y. Li and A. J. Cowan, J. Phys. Chem. C, 2013, 117, 25837–25844 CrossRef PubMed
.
- H. Sato, A. Ishikawa, H. Saito, T. Higashi, K. Takeyasu and T. Sugimoto, Commun. Chem., 2023, 6, 8 CrossRef PubMed
.
- F. Pinto, A. Wilson, B. Moss and A. Kafizas, J. Phys. Chem. C, 2022, 126, 871–884 CrossRef
.
- H. Gao, P. Zhang, J. Hu, J. Pan, J. Fan and G. Shao, Appl. Surf. Sci., 2017, 391, 211–217 CrossRef CAS
.
- L. Yu, Y. Shao and D. Li, Appl. Catal., B, 2017, 204, 216–223 CrossRef CAS
.
Footnote |
| † Electronic supplementary information (ESI) available. See DOI: https://doi.org/10.1039/d3ma00844d |
| This journal is © The Royal Society of Chemistry 2024 |

