 Open Access Article
Creative Commons Attribution 3.0 Unported Licence
Phase behavior of patchy colloids confined in patchy porous media
Yurij V.
Kalyuzhnyi
 *a,
Taras
Patsahan
ab,
Myroslav
Holovko
a and
Peter T.
Cummings
c
aInstitute for Condensed Matter Physics of the National Academy of Sciences of Ukraine, 1 Svientsitskii Street, UA-79011 Lviv, Ukraine. E-mail: yukal@icmp.lviv.ua
bLviv Polytechnic National University, 12 S. Bandera Street, UA-79013 Lviv, Ukraine
cSchool of Engineering and Physical Sciences, Heriot-Watt University, Edinburgh EH14 4AS, UK
First published on 19th January 2024
Abstract
A simple model for functionalized disordered porous media is proposed and the effects of confinement on self-association, percolation and phase behavior of a fluid of patchy particles are studied. The media are formed by randomly distributed hard-sphere obstacles fixed in space and decorated by a certain number of off-center square-well sites. The properties of the fluid of patchy particles, represented by the fluid of hard spheres each bearing a set of the off-center square-well sites, are studied using an appropriate combination of the scaled particle theory for the porous media, Wertheim's thermodynamic perturbation theory, and Flory–Stockmayer theory. To assess the accuracy of the theory a set of computer simulations have been performed. In general, predictions of the theory appeared to be in good agreement with the computer simulation results. Confinement and competition between the formation of bonds connecting the fluid particles, and connecting fluid particles and obstacles of the matrix, gave rise to a re-entrant phase behavior with three critical points and two separate regions of the liquid–gas phase coexistence.
1. Introduction
Porous materials, both natural (e.g., zeolites, biological tissues, rocks and soil) and artificial (e.g., ceramics, synthetic zeolites, cement, and silica aerogels), are ubiquitous. They are relevant to a broad range of applications, e.g., catalysis and sensing, gas storage and separation, adsorption, drug delivery, biomaterial immobilization, environmental remediation, molecular recognition, energy storage, etc.1–28 In most of the earlier applications of porous materials, conventional porous materials, such as zeolites, silica aerogels or activated carbon, were used.29–35 Due to the emergence of new classes of porous materials, which include metal–organic frameworks,36–40 porous organosilicas,41,42 porous polymers43–48 and covalent organic frameworks,48–50 substantial advances in the field have been achieved over the last few decades. In particular, due to their well-developed porosity and tunable surface chemistry these composite organic–inorganic porous materials can be relatively easily functionalized, i.e. the properties of the inner surface of the pores can be appropriately modified by decorating it with different functional groups, organic and inorganic moieties, etc. Functionalized porous materials offer a number of new opportunities to achieve the desirable properties for a diverse range of industrial applications51 and thus a detailed and deep understanding of the mechanisms and effects of confinement on the properties of the fluids adsorbed in the porous media is essential for their development.Over the past several decades substantial progress in the theoretical description of fluids adsorbed in disordered porous media has been achieved.52–57 Most of the theoretical studies are based on the application of the approach developed by Madden and Glandt58,59 and Given and Stell.60 In these studies a porous medium is modeled as a quenched disordered configuration of the particles and the properties of the fluid adsorbed in the medium are described using the so-called replica Ornstein–Zernike (ROZ) theory.58–60 Subsequently the theory was extended and applied to the study of the properties of a number of different fluids confined in the porous media, including site–site fluids,61–63 associating fluids,64–69 fluids with Coulomb interactions70–74 and inhomogeneous systems.75,76 The ROZ theory appears to be very useful and is able to provide relatively accurate predictions for the structure and thermodynamic properties of the fluid adsorbed in disordered porous media. However, the solution of the ROZ equation requires application of numerical methods, i.e. none of the ROZ closures proposed so far are amenable for an analytical solution. In addition, straightforward application of the ROZ approach for phase equilibrium calculations is limited by the absence of a convergent solution to the ROZ equation in a relatively large region of thermodynamic states. Recently, a theoretical approach enabling one to analytically describe the properties of hard-sphere fluid adsorbed in the hard-sphere matrix, formed by the fluid of hard spheres quenched at equilibrium, has been developed.54,77–81 The theory is based on the appropriate extension of the scaled particle theory.82 The hard-sphere fluid is routinely used as a reference system in a number of thermodynamic perturbation theories. In particular, a fluid of hard spheres confined in the hard-sphere matrix was used as a reference system in the framework of the Barker–Henderson perturbation theory,83,84 high-temperature approximation,85 Wertheim's thermodynamic perturbation theory (TPT),81,86–89 associative mean spherical approximation90–93 and the collective variable method.94–96
In the current paper we propose a simple model for functionalized disordered porous media and study the effects of confinement on the clusterization, percolation and phase behavior of a fluid of patchy particles. The media are represented by the disordered matrix of the hard-sphere obstacles bearing a certain number of off-center square-well sites (patches). Due to a strong, short-range attraction between the patches, the obstacles can bond to the fluid particles, and the fluid particles have the ability to form a network. The theoretical model is constructed by combining SPT for the porous media54,79–81 and Wertheim's TPT for the associating fluids.97–99 To assess the accuracy of the theory proposed we generated a set of computer simulation data and compared them against our theoretical predictions.
This paper is organized as follows. In section 2 we describe the interaction potential model and present the theory. In section 3 we briefly describe details of the computer simulations. Section 4 contains results and their discussion. Our conclusions are provided in section 5.
2. The model and theory
Patchy colloids are modeled as a one-component hard-sphere fluid with the particles decorated by the set of n1 square-well bonding sites (patches) located on the surface. The fluid is confined in the porous media represented by the matrix of the patchy hard-sphere obstacles, quenched at hard-sphere fluid equilibrium. Each of the obstacles has on its surface n0 square-well bonding sites (patches). The pair potential Uij(12), which describes the interaction between the colloidal particles and between the colloidal particles and obstacles is given by | (1) |
 | (2) |
1 and 2 stand for the position and orientation of the particles 1 and 2, the indices i and j take the values (i, j) = (1, 1), (1.0), and (0, 1) and denote either fluid particles (i = 1) or matrix obstacles (i = 0), the indices K and L denote patches and take the values A, B, C, …. U(hs)ij(r) is the hard-sphere potential between the particles of the sizes σi and σj, z12 is the distance between the corresponding sites, and εij and ωij are the depth and width of the square-well potential. Note that εij and ωij are independent of the type of patches.
The properties of the model are calculated by combining Wertheim's thermodynamic perturbation theory (TPT) for associating fluids97–99 and the scaled particle theory (SPT), extended to describe a hard-sphere fluid adsorbed in the hard-sphere matrix.54,79,80 According to Wertheim's TPT Helmholtz free energy of the system A can be written in the following form
| A = Aref + ΔAas, | (3) |
 | (4) |
 | (5) |
| 4πX0ρ1σ013n1X1T01(as)g(ref)01 + X0 − 1 = 0, | (6) |
 | (7) |
![[f with combining tilde]](https://www.rsc.org/images/entities/i_char_0066_0303.gif) ij(as)(r) is the orientationally averaged Mayer function for the square-well site–site potential
ij(as)(r) is the orientationally averaged Mayer function for the square-well site–site potential | (8) |
The chemical potential, μ, and pressure, P, of the system are calculated using standard thermodynamic relations, i.e.
| μ = μref + Δμas, P = Pref + ΔPas | (9) |
 | (10) |
Coexisting densities of the low-density (ρ(l)1) and high-density (ρ(h)1) phases at a certain temperature T follow from the solution of the set of two equations:
| μ(T,ρ(l)1) = μ(T,ρ(h)1), P(T,ρ(l)1) = P(T,ρ(h)1), | (11) |
The reference system is represented by the hard-sphere fluid confined in the hard-sphere matrix. The properties of this reference system are calculated using corresponding extension of the scaled particle theory.54,79–81 Closed form analytical expressions for the Helmholtz free energy of the reference system Aref and the chemical potential μref are presented in the Appendix.
3. Details of computer simulations
Monte Carlo (MC) computer simulations were performed for the model of the patchy particles confined in a patchy hard-sphere matrix, according to the model presented in section 2. We consider the hard-sphere particles of fluid and matrix with diameters of σ0 and σ1, respectively. We study the particles with different numbers of patches, which are symmetrically arranged on the surface of particles at a distance of half the diameter from its center. As shown in Fig. 1, the patches in a two-patch particle are located diametrically opposed to each other, in a three-patch particle they form an equilateral triangle, and in four-patch model, the patches are in vertices of a regular tetrahedron. Monte Carlo simulations have been carried out using the conventional Metropolis algorithm in the canonical ensemble (NVT)100 for a two-component mixture of a patchy matrix and fluid particles taking into account both the translational and rotational moves of the fluid particles, while for the matrix particles, all degrees of freedom have been frozen. To handle the orientations and rotations of the patchy particles the quaternion representation100 is employed.3.1. Calculation of the fraction of m-times bonded fluid
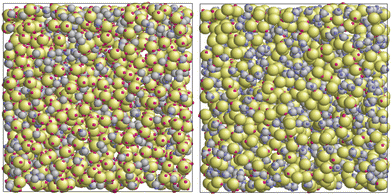
The simulations have been performed in a cubic box of size L with the periodic boundary condition applied. The size of the box has been chosen to be equal to L = 24σ1, where σ1 is a diameter of the fluid particles. Each simulation run has been started from a random configuration of fluid particles, both in their positions and orientations. Configurations of the matrix particles were random as well; however, they were the same for each of the systems studied at the given matrix density ρ0 and for each set of fluid parameters. The maximum trial displacement at each translational move of a fluid particle is limited to the distance of 0.1σ1. Each rotational move of a particle is performed around a random axis within the maximum rotation angle of 0.1 radians. The trial move ratios were taken to be 50% for translations and 50% for the rotations.The width ωij of the square-well potential is assumed to be 0.119σ1 for all patch–patch interactions ensuring formation of only one bond per patch. The depth εij is also taken to be the same for all the square-well potentials, assuming that the matrix particles are functionalized with the same groups as the fluid particles, or at least they lead to the association between the fluid and the matrix particles with the energy close to that observed between the fluid particles. In Fig. 2 some snapshots with examples of the simulated systems are shown.
Each simulation process was conducted in two stages, equilibration and production runs, and both runs took 106 simulation steps, where the simulation step consisted of N trial translational and rotational moves of the fluid particles. It appeared to be sufficient for producing reliable data, which were obtained for two values of the packing fractions of the matrix particles η0 = πρ0σ03/6, i.e. η0 = 0.1 and 0.2 and different number densities of the fluid particles ranging from  up to
up to  , where N1 is the number of fluid particles and V = L3 is the volume of the simulation box. The packing fraction of the matrix is an inverse characteristic to the porosity φ0 = 1 − η0, which is the basic quantity describing a porous medium, ρ0 = N0/V, N0 is the number of matrix particles and the diameter σ0 = 1.5σ1 was set larger than that of the fluid particles. In all simulations, the value of the temperature T* = kBt/ε11 was T* = 0.12, surpassing the critical temperature of the present model fluids studied in bulk.101 This ensures that the critical temperature of these model fluids, being confined in the matrix, is lower than T* = 0.12.81 To accelerate the simulations the linked-cells algorithm was used with a cell size of 2.0 σ1.100 During the production run a number of bonds between the fluid and matrix particles were collected at each 10 simulation step and averaged along the simulation in order to calculate the fraction of m-times bonded fluid x1(m) and matrix x0(m) particles and to compare them with our theoretical predictions.
3.2. Estimation of the percolation threshold
The percolation threshold line for the system of patchy particles in a matrix is estimated using MC simulation in an NVT ensemble in the temperature range T* = 0.085–0.12. For these temperatures the associative interaction between patches becomes significant, and the formation of particle clusters of different sizes can appear. Due to a low probability of dissociation events, it is difficult to accurately sample a configurational space for systems using the conventional sets of MC trial moves. Thus, we extended it by an additional type of move consisting of the removal of a particle and its immediate random insertion into the simulation box. Consequently, a particle associated with one cluster can “jump” to the other cluster, if it is energetically favorable. The modified MC algorithm improves the ability to sample the configuration space of the system in the given range of temperatures, which are assumed still higher than the critical temperature. For lower temperatures it is expedient to use schemes employing biased MC moves.100,102 The rule of the acceptance of the jump trial moves in our scheme was the same as that of the translational or rotational moves. The trial move ratios were determined to be 25% for translation, 50% for rotations, and 25% for jumps. Since the acceptance rate appeared to be small we increased the number of steps in the equilibration and production runs by up to 107. The cluster analysis was performed based on the system configurations stored at each 1000th step of the production run. The depth-first search algorithm was employed to partition the patchy particles into different clusters. Two colloidal particles are assumed to be connected if the distance between their patches is less than ω11. A cluster is defined as an uninterrupted sequence of interconnected particles. We assumed that for a given configuration the state of percolation was achieved if a cluster of the infinite size under the periodic boundary conditions was formed. We calculated the temperature and density plane using a step of ΔT = 0.005 and Δρ = 0.01, respectively, and the density coordinates of the percolation threshold line at a certain temperature
  was calculated as
  . Here
  and
and  and
and  are the densities with less and more than 50% of the configurations percolating, respectively.
4. Results and discussion
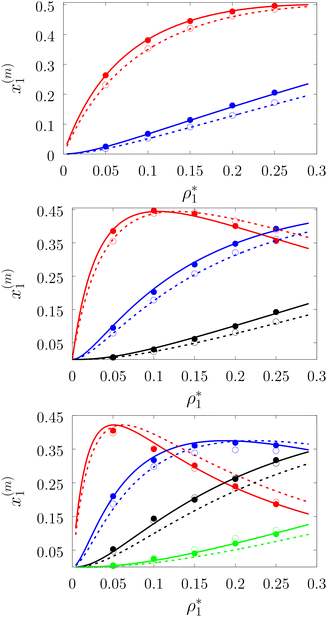
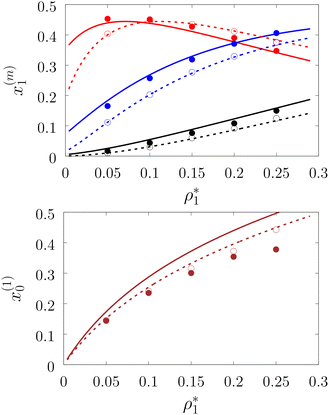
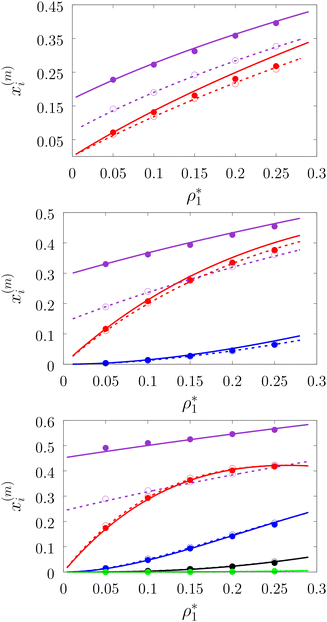
To systematically access accuracy of the theory we studied the properties of several versions of the model. We considered the models with different numbers of the attracting sites and different values of the density of the fluid and matrix particles. These versions are denoted as LiMj, where i and j are the number of sites on the fluid and matrix particles. We also considered two values for the matrix packing fraction and one value of the temperature, i.e. η0 = 0.1 and 0.2 and T* = kBT/ε11 = 0.12. The other parameters of the model are: σ0 = 1.5σ1, ω11 = ω01 = 0.119σ1 and ε01 = ε11.In Fig. 3–6 we compared the theoretical and computer simulation results for the fraction of m times bonded fluid x1(m) and matrix x0(m) particles as a function of the fluid density ρ1. The latter quantity was calculated using the following equation99
 | (12) |
Fig. 3 shows our results for the models with matrix particles without patches and fluid particles with 2, 3 and 4 patches, i.e. models L2M0, L3P0, and L4P0. The agreement between the theoretical and the computer simulation predictions for the models L2M0 and L3M0 at both values of the matrix packing fraction, η0 = 0.1 and 0.2, was very good. For the model L4M0 and the lower value of η0 = 0.1 the results of the theory were less accurate and the agreement with the exact computer simulation results was only semi-quantitative. However with the increase of the matrix packing fraction η0 = 0.2 the agreement between the theory and the computer simulation became almost as good as in the case of the other models. Our results for the models with patches on both fluid and matrix particles are presented in Fig. 4 and 6. In Fig. 4 we compare our theoretical results against the computer simulation results for the model L3M1. Here one can observe very good agreement between the theory and the simulation for x1(1)x1(2) and x1(3) for both values of the matrix packing fraction η0. The theoretical predictions for the fraction of singly bonded matrix particles x0(1) are accurate for the lower values of η0 = 0.1. At η0 = 0.2 the theoretical results are less accurate. While computer simulations predicted a slight decrease in x0(1) upon the increase of η0, theoretical calculations showed that it increased. As η0 increased the average distance between the matrix particles decreased and the number of obstacles with the patch blocked by the nearest neighboring obstacles increased. This effect, which is not accounted for in the framework of the present version of the TPT, caused a slight decrease of x0(1). On the other hand this effect was less pronounced for the models L1M1, L1M2 and L1M4 (Fig. 6) and the corresponding theoretical results were in very good agreement with the computer simulation results. This good agreement was observed in the fraction of the m times bonded fluid and matrix particles for both values of the matrix packing fraction η0. Thus with the increase of the matrix packing fraction η0 and the number of the patches on the fluid particles n1 the first order TPT became less accurate. Further improvement of the theory can be achieved using higher-order versions of the TPT.
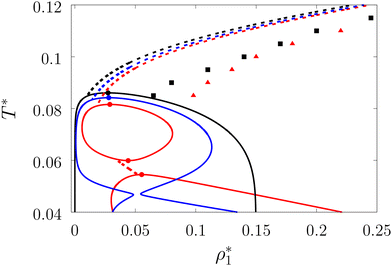
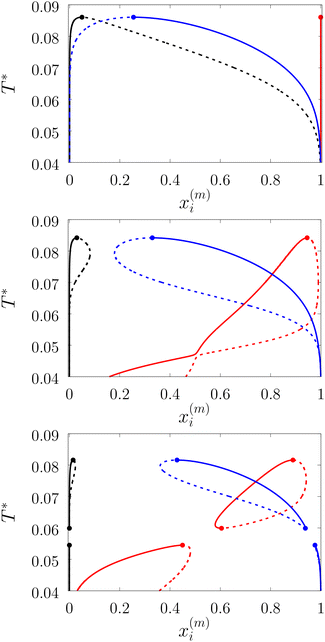
In Fig. 5 and 7 we present a liquid–gas phase diagram and percolation threshold lines for the model L3M1 with different values for the ratio between the strength of attractive fluid–fluid and fluid–matrix interactions. In addition in Fig. 5 we show our computer simulation results for the percolation lines. These lines separate the ρ vs. T plane into percolating and non-percolating regions, i.e. in the latter region the particles form finite size clusters and in the former these clusters form an infinite network. Our calculation of the percolation threshold lines is based on the extension of Flory–Stockmayer (FS) theory.101,103–105 According to earlier studies104,106 percolation threshold lines for the model at hand are defined by the equality p11 = 1/2, where p11 is the probability of forming the bonds between the fluid particles, i.e.
 | (13) |
We considered the following values for the hard-sphere size of the matrix obstacles, i.e. σ0 = 1.388σ1 and for the width and depth of the potential well (2): ω01 = 0.1σ1 and ε01 = 0, 0.77ε11 and 0.825ε11. Our computer simulations for the percolation threshold lines were carried out for the lowest and highest values of the potential well depth, i.e. ε01 = 0 and ε01 = 0.825ε11. This model was studied in the simulation box of size L = 16σ1 using the scheme described in subsection 2 All the rest of the potential model parameters were the same as those used before. This choice of parameters allowed us to study the effects due to the competition between the formation of the bonds connecting the fluid particles, and the fluid particles and the matrix particles. While the formation of the 3-dimensional network of bonds connecting the fluid particles caused gas–liquid phase separation, the bonding of the fluid and matrix particles suppressed it. For the model with ε01 = 0 the phase diagram was of the usual form, i.e. the difference between the coexisting densities of the gas and liquid phases increased on decreasing temperature (Fig. 5). Here, since the density of the gas phase ρ1, gas lower than the density of the liquid phase ρ1, liq the fraction of the free (or 3 time bonded) particles in the gas phase x(0)1, gas (x(3)1, gas) was larger (lower) than the corresponding fractions in the liquid phase (Fig. 7, top panel). As one would expect of the fractions of free matrix particles we had x(0)0, gas = x(0)0, liq = 1, where x(0)0, gas and x(0)0, liq denoted fractions of free (nonbonded) particles of the matrix, which confined the fluid particles either in the gas phase or in the liquid phase, respectively. An increase of ε01 caused changes in the phase diagram topology. For the model with ε01 = 0.77ε11 the phase diagram exhibited re-entrant phase behavior, i.e. the decrease of the temperature in the range of approximately 0.065 ≥ T* ≥ 0.046 resulted in the reduction of the difference in the coexisting gas and liquid densities (Fig. 5). This effect was caused by the increased bonding of the fluid particles and matrix obstacles, which destroyed the three-dimensional network formed by the fluid particles and suppressed the phase separation. In this range of temperatures the fraction of free obstacles x(0)0 in both phases rapidly decreased (Fig. 7, intermediate panel). At the same time, while the fractions of the free and three time bonded fluid particles in the liquid phase did not change much, in the gas phase they approached the liquid phase values (Fig. 7, intermediate panel). This behavior reflects the process of breaking the bonds between the fluid particles and their substitution by the bonds formed between the fluid particles and obstacles of the matrix. Upon reaching a sufficient bonding degree of the matrix obstacles this process slowed down and with further decrease of the temperature (T* < 0.046), the three-dimensional network formed by the fluid particles became stronger. As a result the difference between the coexisting gas and liquid densities increased with the temperature decrease (Fig. 5). Similar behavior can be observed of the model with ε01 = 1.835ε11. However, stronger fluid-matrix attraction completely suppressed the phase separation in the range of the temperature 0.060 ≤ T* ≤ 0.0545. As a result we had the phase diagram with two separate regions of the liquid–gas phase coexistence: the region at higher temperatures had the upper and lower critical points (Fig. 5 and 7) and the region at lower temperatures had the usual liquid–gas type of the critical point. These critical points and the liquid branches of the phase diagrams are located inside the percolating region (Fig. 5). The corresponding percolation line consists of two branches, i.e. high-temperature branch and low-temperature branch. The former branch is located at higher temperatures with the cluster fluid phase above and the percolating fluid phase below the percolation threshold line. The latter branch is located at lower temperatures and connects the high-temperature and low-temperature regions of the phase diagram. Here the percolating fluid phase occurs above the percolation threshold line and the cluster fluid phase occurs below the percolation threshold line. For the model with ε01 = 0 the percolation threshold line was of the usual shape and the increase of ε01 (ε01 = 0077, 0.825) caused only a slight shift in the direction of lower temperature and higher density. The corresponding computer simulation results demonstrated similar qualitative behavior; however, the quantitative agreement between theory and simulation was rather poor: the theoretical predictions for the temperature of percolation transition at lower densities  was about 15–20% higher than those of the simulation. According to previous studies the predictions of the FS approach for the percolation threshold line of the patchy colloids in the bulk conditions were relatively accurate.107 The observed quantitative disagreement between theory and simulation was due to the inability of the present version of the FS approach to account for the effects of heterogeneity caused by the presence of the random porous media. Finally, we note that recently the phase behavior of the patchy colloids adsorbed in the attractive random porous medium has been studied.88,89 In these studies the medium was represented as a matrix of hard-sphere obstacles with the attractive Yukawa interaction between the centers of the fluid and matrix particles. Similar to the present study, confinement caused the system to undergo re-entrant liquid–gas phase separation. However competition between the Yukawa interaction and bonding did not cause the phase diagram to be separated into two (or more) regions. Taking into account the good agreement between the theoretical and computer simulation predictions for the fractions X0 and X1 and the fact that these are the only quantities that enter into expressions for the Helmholtz free energy ΔAas (eqn (4)) and the probability of forming the bonds p11 (eqn (13)) there are good reasons to believe that our theory is accurate enough to at least qualitatively predict the peculiarities of the phase behavior discussed above. In a subsequent paper we are planning to systematically investigate the phase behavior and percolation properties of the model using an extension of the aggregation-volume-bias MC method108,109 and the theory developed herein.
5. Conclusions
In this work we proposed a simple model of functionalized disordered porous media represented by a matrix of hard-sphere fluid particles quenched at equilibrium and decorated by a certain number of off-center square-well sites. The model was used to study the effects of confinement on the clusterization, percolation and phase behavior of the fluid of the patchy particles adsorbed in such porous media. The study was carried out by combining Wertheim's TPT for associating fluids, SPT for the porous media and Flory–Stockmayer theory of polymerization. A set of computer simulation data has been generated and used to assess the accuracy of the theory. Very good agreement between theoretical and computer simulation predictions was observed for the fractions of the m-times bonded fluid and matrix particles almost in all the cases studied. The results of the fraction of the m-times bonded matrix particles for the model with fluid particles bearing more than one patch were slightly less accurate. Theoretical predictions for the percolation threshold lines were only qualitatively accurate. Further improvement of the theory can be achieved using higher-order versions of the TPT and correcting the FS approach to account for the heterogeneity of the porous media.The liquid–gas phase diagram and percolation threshold line for the model with three-patch fluid particles and one-patch matrix particles were calculated and analyzed. It is demonstrated that confinement can substantially change the shape of the phase diagram. Bonding between the fluid particles causes the formation of a network and bonding of the fluid particles to the obstacles suppresses this process. Competition between these two effects define the shape of the phase diagram and gives rise to a re-entrant phase behavior with three critical points and two separate regions of the liquid–gas phase coexistence.
Conflicts of interest
There are no conflicts to declare.Appendix: Expressions for Helmholtz free energy, chemical potential and pressure of the hard-sphere fluid confined in the hard-sphere matrix
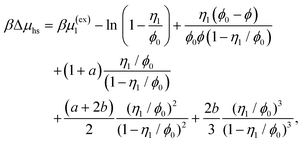
The reference system is represented by the hard-sphere fluid confined in the hard-sphere matrix. Detailed description of the properties of such system using SPT was carried out earlier.54,79–81 Based on these studies we have the following expressions for the Helmholtz free energy ΔAhs and for the contact values of the radial distribution functions g(hs)10(r) and g(hs)11(r) for the hard-sphere fluid adsorbed in the hard-sphere matrix, i.e. | (14) |
 | (15) |
 | (16) |
 | (17) |
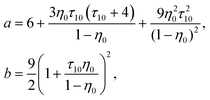
η 0 = πρ0σ03/6, φ0 = 1−η0, η1 = πρ1σ13/6 and ϕ = exp(−βμ1(ex)).
Here
 | (18) |
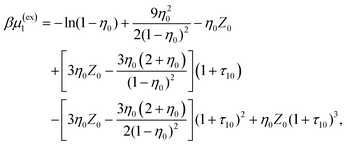 | (19) |
Z 0 = (1 + η0 + η02)/(1 − η0)3, τ1j = σ1/σj and j = 0, 1.
Acknowledgements
YVK acknowledges the financial support through the MSCA4Ukraine project, which is funded by the European Union, and TP and MH gratefully acknowledge the financial support from the National Research Foundation of Ukraine (project no. 2020.02/0317). YVK expresses his gratitude to the Vanderbilt University, where part of this research was conducted, for the hospitality.References
- A. Corma, Chem. Rev., 1997, 97, 2373–2420 CrossRef CAS PubMed.
- A. Vinu, T. Mori and K. Ariga, Sci. Technol. Adv. Mater., 2006, 7, 753–771 CrossRef CAS.
- I. Slowing, B. Trewyn, S. Giri and V.-Y. Lin, Adv. Funct. Mater., 2007, 17, 1225–1236 CrossRef CAS.
- Handbook of Heterogeneous Catalysis, ed. G. Ertl, H. Knözinger, F. Schüth and J. Weitkamp, Wiley, 2008 Search PubMed.
- S. P. Adiga, C. Jin, L. A. Curtiss, N. A. Monteiro-Riviere and R. J. Narayan, Wiley Interdiscip. Rev.: Nanomed. Nanobiotechnol., 2009, 1, 568–581 CAS.
- A. Corma, H. García and F. X. L. i Xamena, Chem. Rev., 2010, 110, 4606–4655 CrossRef CAS PubMed.
- P. Stroeve and N. Ileri, Trends Biotechnol., 2011, 29, 259–266 CrossRef CAS PubMed.
- P. Misaelides, Microporous Mesoporous Mater., 2011, 144, 15–18 CrossRef CAS.
- R. Dawson, A. I. Cooper and D. J. Adams, Prog. Polym. Sci., 2012, 37, 530–563 CrossRef CAS.
- J. Rouquerol, F. Rouquerol, P. Llewellyn, G. Maurin and K. S. Sing, Adsorption by powders and porous solids: principles, methodology and applications, Academic press, 2013 Search PubMed.
- J. Liu, L. Chen, H. Cui, J. Zhang, L. Zhang and C.-Y. Su, Chem. Soc. Rev., 2014, 43, 6011–6061 RSC.
- T. Zhang and W. Lin, Chem. Soc. Rev., 2014, 43, 5982–5993 RSC.
- L. Canham, Handbook of porous silicon, Springer International Publishing Berlin, Germany, 2014 Search PubMed.
- N. Pal and A. Bhaumik, RSC Adv., 2015, 5, 24363–24391 RSC.
- Y. Li, H. Xu, S. Ouyang and J. Ye, Phys. Chem. Chem. Phys., 2016, 18, 7563–7572 RSC.
- J. Liang, Z. Liang, R. Zou and Y. Zhao, Adv. Mater., 2017, 29, 1701139 CrossRef PubMed.
- T. Kumeria, S. J. P. McInnes, S. Maher and A. Santos, Expert Opin. Drug Delivery, 2017, 14, 1407–1422 CrossRef CAS PubMed.
- G. Danda and M. Drndić, Curr. Opin. Biotechnol., 2019, 55, 124–133 CrossRef CAS PubMed.
- Q. Wang and D. Astruc, Chem. Rev., 2020, 120, 1438–1511 CrossRef CAS PubMed.
- L. Miao, Z. Song, D. Zhu, L. Li, L. Gan and M. Liu, Mater. Adv., 2020, 1, 945–966 RSC.
- Y. Li and J. Yu, Nat. Rev. Mater., 2021, 6, 1156–1174 CrossRef CAS.
- N. Hosono and T. Uemura, Acc. Chem. Res., 2021, 54, 3593–3603 CrossRef CAS PubMed.
- R. Moretta, L. D. Stefano, M. Terracciano and I. Rea, Sensors, 2021, 21, 1336 CrossRef CAS PubMed.
- G. Singh, R. Bahadur, J. M. Lee, I. Y. Kim, A. M. Ruban, J. M. Davidraj, D. Semit, A. Karakoti, A. H. A. Muhtaseb and A. Vinu, Chem. Eng. J., 2021, 406, 126787 CrossRef CAS.
- R. Saha, B. Mondal and P. S. Mukherjee, Chem. Rev., 2022, 122, 12244–12307 CrossRef CAS PubMed.
- M. Hadden, D. Martinez-Martin, K.-T. Yong, Y. Ramaswamy and G. Singh, Materials, 2022, 15, 2111 CrossRef CAS PubMed.
- B. Yue, S. Liu, Y. Chai, G. Wu, N. Guan and L. Li, J. Energy Chem., 2022, 71, 288–303 CrossRef CAS.
- A. Popat, S. B. Hartono, F. Stahr, J. Liu, S. Z. Qiao and G. Q. M. Lu, Nanoscale, 2011, 3, 2801 RSC.
- R. M. Milton, in Zeolite Synthesis, ed. M. L. Occelli and H. E. Robson, American Chemical Society, 1989, ch. 1, pp. 1–10 Search PubMed.
- S. Wang and Y. Peng, Chem. Eng. J., 2010, 156, 11–24 CrossRef CAS.
- M. Xia, Z. Chen, Y. Li, C. Li, N. M. Ahmad, W. A. Cheema and S. Zhu, RSC Adv., 2019, 9, 20941–20953 RSC.
- W. Gu and G. Yushin, Wiley Interdiscip. Rev.: Energy Environ., 2013, 3, 424–473 Search PubMed.
- S. S. Kistler, Nature, 1931, 127, 741–741 CrossRef CAS.
- C. T. Kresge, M. E. Leonowicz, W. J. Roth, J. C. Vartuli and J. S. Beck, Nature, 1992, 359, 710–712 CrossRef CAS.
- D. Zhao, J. Feng, Q. Huo, N. Melosh, G. H. Fredrickson, B. F. Chmelka and G. D. Stucky, Science, 1998, 279, 548–552 CrossRef CAS PubMed.
- H. Li, M. Eddaoudi, M. O'Keeffe and O. M. Yaghi, Nature, 1999, 402, 276–279 CrossRef CAS.
- M. Wen, G. Li, H. Liu, J. Chen, T. An and H. Yamashita, Environ. Sci.: Nano, 2019, 6, 1006–1025 RSC.
- T. L. Easun, F. Moreau, Y. Yan, S. Yang and M. Schröder, Chem. Soc. Rev., 2017, 46, 239–274 RSC.
- J.-R. Li, R. J. Kuppler and H.-C. Zhou, Chem. Soc. Rev., 2009, 38, 1477 RSC.
- X. Zhang, Z. Chen, X. Liu, S. L. Hanna, X. Wang, R. Taheri-Ledari, A. Maleki, P. Li and O. K. Farha, Chem. Soc. Rev., 2020, 49, 7406–7427 RSC.
- N. Mizoshita, T. Tani and S. Inagaki, Chem. Soc. Rev., 2011, 40, 789–800 RSC.
- A. Modak, J. Mondal, V. K. Aswal and A. Bhaumik, J. Mater. Chem., 2010, 20, 8099 RSC.
- N. B. McKeown, B. Gahnem, K. J. Msayib, P. M. Budd, C. E. Tattershall, K. Mahmood, S. Tan, D. Book, H. W. Langmi and A. Walton, Angew. Chem., Int. Ed., 2006, 45, 1804–1807 CrossRef CAS PubMed.
- D. Wu, F. Xu, B. Sun, R. Fu, H. He and K. Matyjaszewski, Chem. Rev., 2012, 112, 3959–4015 CrossRef CAS PubMed.
- D. Chandra and A. Bhaumik, J. Mater. Chem., 2009, 19, 1901 RSC.
- H. Ou, W. Zhang, X. Yang, Q. Cheng, G. Liao, H. Xia and D. Wang, Environ. Sci.: Nano, 2018, 5, 169–182 RSC.
- Y. Xu, S. Jin, H. Xu, A. Nagai and D. Jiang, Chem. Soc. Rev., 2013, 42, 8012 RSC.
- S. Das, P. Heasman, T. Ben and S. Qiu, Chem. Rev., 2017, 117, 1515–1563 CrossRef CAS PubMed.
- S.-Y. Ding and W. Wang, Chem. Soc. Rev., 2013, 42, 548–568 RSC.
- K. Geng, T. He, R. Liu, S. Dalapati, K. T. Tan, Z. Li, S. Tao, Y. Gong, Q. Jiang and D. Jiang, Chem. Rev., 2020, 120, 8814–8933 CrossRef CAS PubMed.
- R. Yadav, T. Baskaran, A. Kaiprathu, M. Ahmed, S. V. Bhosale, S. Joseph, A. H. Al-Muhtaseb, G. Singh, A. Sakthivel and A. Vinu, Chem. – Asian J., 2020, 15, 2588–2621 CrossRef CAS PubMed.
- M. L. Rosinberg, in New Approaches to Problems in Liquid State Theory. NATO Science Series, ed. C. Caccamo, J. Hansen and G. Stell, Springer, Dordrecht, 1999, vol. 529, pp. 245–278 Search PubMed.
- L. Sarkisov and P. R. V. Tassel, J. Phys.: Condens. Matter, 2008, 20, 333101 CrossRef.
- M. Holovko, T. Patsahan and W. Dong, Pure Appl. Chem., 2013, 85, 115–133 CrossRef CAS.
- M. Holovko, V. Shmotolokha and T. Patsahan, in Physics of Liquid Matter: Modern Problems. Springer Proceedings in Physics, ed. L. Bulavin and N. Lebovka, Springer, Cham, 2015, vol. 171, ch. 1, pp. 3–30 Search PubMed.
- W. Dong and X. Chen, Sci. China: Phys., Mech. Astron., 2018, 61, 70501 Search PubMed.
- O. Pizio, in Computational Methods in Surface and Colloid Science, ed. M. Borowko, CRC Press, United States, 2019, ch. 6, pp. 293–345 Search PubMed.
- W. G. Madden and E. D. Glandt, J. Stat. Phys., 1988, 51, 537–558 CrossRef.
- W. G. Madden, J. Chem. Phys., 1992, 96, 5422–5432 CrossRef CAS.
- J. A. Given and G. Stell, J. Chem. Phys., 1992, 97, 4573–4574 CrossRef.
- A. Kovalenko and F. Hirata, J. Chem. Phys., 2001, 115, 8620–8633 CrossRef CAS.
- D. Chandler, J. Phys.: Condens. Matter, 1991, 3, F1–F8 CrossRef.
- A. P. Thompson and E. D. Glandt, J. Chem. Phys., 1993, 99, 8325–8329 CrossRef CAS.
- A. Trokhymchuk, O. Pizio, M. Holovko and S. Sokolowski, J. Chem. Phys., 1997, 106, 200–209 CrossRef CAS.
- G. A. Orozco, O. Pizio, S. Sokolowski and A. Trokhymchuk, Mol. Phys., 1997, 91, 625–634 CAS.
- O. Pizio, Y. Duda, A. Trokhymchuk and S. Sokolowski, J. Mol. Liq., 1998, 76, 183–194 CrossRef.
- P. Padilla, O. Pizio, A. Trokhymchuk and C. Vega, J. Phys. Chem. B, 1998, 102, 3012–3017 CrossRef CAS.
- B. M. Malo, O. Pizio, A. Trokhymchuk and Y. Duda, J. Colloid Interface Sci., 1999, 211, 387–394 CrossRef CAS PubMed.
- T. Urbic, V. Vlachy, O. Pizio and K. Dill, J. Mol. Liq., 2004, 112, 71–80 CrossRef CAS.
- B. Hribar, O. Pizio, A. Trokhymchuk and V. Vlachy, J. Chem. Phys., 1997, 107, 6335–6341 CrossRef CAS.
- B. Hribar, O. Pizio, A. Trokhymchuk and V. Vlachy, J. Chem. Phys., 1998, 109, 2480–2489 CrossRef CAS.
- B. Hribar, V. Vlachy, A. Trokhymchuk and O. Pizio, J. Phys. Chem. B, 1999, 103, 5361–5369 CrossRef CAS.
- V. Vlachy, H. Dominguez and O. Pizio, J. Phys. Chem. B, 2004, 108, 1046–1055 CrossRef CAS.
- B. Hribar-Lee, M. Lukšič and V. Vlachy, Annu. Rep. Prog. Chem., Sect. C: Phys. Chem., 2011, 107, 14 RSC.
- O. Pizio and S. Sokolowski, Phys. Rev. E: Stat. Phys., Plasmas, Fluids, Relat. Interdiscip. Top., 1997, 56, R63–R66 CrossRef CAS.
- A. Kovalenko, S. Sokołowski, D. Henderson and O. Pizio, Phys. Rev. E: Stat. Phys., Plasmas, Fluids, Relat. Interdiscip. Top., 1998, 57, 1824–1831 CrossRef CAS.
- M. Holovko and W. Dong, J. Phys. Chem. B, 2009, 113, 6360–6365 CrossRef CAS PubMed.
- W. Chen, W. Dong, M. Holovko and X. S. Chen, J. Phys. Chem. B, 2010, 114, 1225–1225 CrossRef CAS PubMed.
- T. Patsahan, M. Holovko and W. Dong, J. Chem. Phys., 2011, 134, 074503 CrossRef CAS PubMed.
- M. Holovko, T. Patsahan and W. Dong, Condens. Matter Phys., 2017, 20, 33602 CrossRef.
- Y. V. Kalyuzhnyi, M. Holovko, T. Patsahan and P. T. Cummings, J. Phys. Chem. Lett., 2014, 5, 4260–4264 CrossRef CAS PubMed.
- H. Reiss, H. L. Frisch and J. L. Lebowitz, J. Chem. Phys., 1959, 31, 369–380 CrossRef CAS.
- M. Holovko, T. Patsahan and V. Shmotolokha, Condens. Matter Phys., 2015, 18, 13607 CrossRef.
- A. Nelson, Y. Kalyuzhnyi, T. Patsahan and C. McCabe, J. Mol. Liq., 2020, 300, 112348 CrossRef CAS.
- T. V. Hvozd and Y. V. Kalyuzhnyi, Soft Matter, 2017, 13, 1405–1412 RSC.
- T. V. Hvozd, Y. V. Kalyuzhnyi and P. T. Cummings, J. Phys. Chem. B, 2018, 122, 5458–5465 CrossRef CAS PubMed.
- T. Hvozd, Y. V. Kalyuzhnyi and V. Vlachy, Soft Matter, 2020, 16, 8432–8443 RSC.
- T. V. Hvozd, Y. V. Kalyuzhnyi, V. Vlachy and P. T. Cummings, J. Chem. Phys., 2022, 156, 161102 CrossRef CAS PubMed.
- T. Hvozd, Y. V. Kalyuzhnyi and V. Vlachy, Soft Matter, 2022, 18, 9108–9117 RSC.
- M. Holovko and Y. V. Kalyuzhnyi, Mol. Phys., 1991, 73, 1145–1157 CrossRef.
- H. Krienke, J. Barthel, M. Holovko, I. Protsykevich and Y. Kalyushnyi, J. Mol. Liq., 2000, 87, 191–216 CrossRef CAS.
- M. Holovko, T. Patsahan and O. Patsahan, J. Mol. Liq., 2017, 228, 215–223 CrossRef CAS.
- M. Holovko, T. Patsahan and O. Patsahan, J. Mol. Liq., 2017, 235, 53–59 CrossRef CAS.
- M. F. Holovko, O. Patsahan and T. Patsahan, J. Phys.: Condens. Matter, 2016, 28, 414003 CrossRef CAS PubMed.
- O. V. Patsahan, T. M. Patsahan and M. F. Holovko, Phys. Rev. E, 2018, 97, 022109 CrossRef CAS PubMed.
- O. Patsahan, T. Patsahan and M. Holovko, J. Mol. Liq., 2018, 270, 97–105 CrossRef CAS.
- M. S. Wertheim, J. Stat. Phys., 1986, 42, 459–476 CrossRef.
- M. S. Wertheim, J. Stat. Phys., 1986, 42, 477–492 CrossRef.
- M. S. Wertheim, J. Chem. Phys., 1987, 87, 7323–7331 CrossRef CAS.
- M. P. Allen and D. J. Tildesley, Computer Simulation of Liquids, Oxford University Press, 2017 Search PubMed.
- E. Bianchi, P. Tartaglia, E. Zaccarelli and F. Sciortino, J. Chem. Phys., 2008, 128, 144504 CrossRef PubMed.
- S. Wierzchowski and D. A. Kofke, J. Chem. Phys., 2001, 114, 8752–8762 CrossRef CAS.
- E. Bianchi, P. Tartaglia, E. L. Nave and F. Sciortino, J. Phys. Chem. B, 2007, 111, 11765–11769 CrossRef CAS PubMed.
- D. de las Heras, J. M. Tavares and M. M. T. da Gama, Soft Matter, 2011, 7, 5615 RSC.
- J. M. Tavares, P. I. C. Teixeira, M. M. T. da Gama and F. Sciortino, J. Chem. Phys., 2010, 132, 234502 CrossRef CAS PubMed.
- S. Roldán-Vargas, F. Smallenburg, W. Kob and F. Sciortino, J. Chem. Phys., 2013, 139, 244910 CrossRef PubMed.
- Y. Kalyuzhnyi, C. Iacovella, H. Docherty, M. Holovko and P. Cummings, J. Stat. Phys., 2011, 145, 481–506 CrossRef CAS.
- B. Chen and J. I. Siepmann, J. Phys. Chem. B, 2001, 105, 11275–11282 CrossRef CAS.
- J. Russo, J. Tavares, P. Teixeira, M. T. Da Gama and F. Sciortino, Phys. Rev. Lett., 2011, 106, 085703 CrossRef CAS PubMed.
| This journal is © The Royal Society of Chemistry 2024 |


