Continuous flow synthesis and crystallization of modafinil: a novel approach for integrated manufacturing†
Diana V.
Silva-Brenes‡
 ab,
Shailesh
Agrawal‡
 a,
Vilmalí
López-Mejías
 ac,
Jorge
Duconge
d,
Cornelis P.
Vlaar
 d,
Jean-Christophe M.
Monbaliu
 *be and
Torsten
Stelzer
 *ad
*ad
aCrystallization Design Institute, Molecular Sciences Research Center, University of Puerto Rico, San Juan, Puerto Rico 00926, USA. E-mail: torsten.stelzerupr.edu
bCenter for Integrated Technology and Organic Synthesis, MolSys Research Unit, University of Liège, B-4000 Liège Sart Tilman, Belgium. E-mail: jc.monbaliu@uliege.be
cDepartment of Chemistry, University of Puerto Rico, Río Piedras Campus, San Juan, Puerto Rico 00931, USA
dDepartment of Pharmaceutical Sciences, University of Puerto Rico, Medical Sciences Campus, San Juan, Puerto Rico 00936, USA
eWEL Research Institute, Avenue Pasteur 6, B-1300 Wavre, Belgium
First published on 8th August 2024
Abstract
This study reports efforts toward the integrated advanced manufacturing of the anti-narcoleptic drug modafinil. It showcases a holistic approach from flow synthesis to purification via continuous crystallization. The integration strategy included a necessary optimization of the reported flow synthesis for modafinil, enabling prolonged operation and consistent crude quality. The reactor effluents were subsequently processed downstream for purification utilizing two single stage mixed suspension mixed product removal crystallizers. The first stage was an antisolvent cooling crystallization, providing refined modafinil with >98% yield. The second cooling crystallization delivered crystalline modafinil with >99% purity in the required polymorphic form I suitable for formulation.
Introduction
Continuous manufacturing has transformed the operation of modern industry because of processing enhancement, including, e.g., lower costs, increased consumer satisfaction, and product availability. In the context of pharmaceuticals, continuous manufacturing, when implemented correctly, has the potential through process intensification to improve product quality, process control, and scale-up as well as to reduce space, energy, material consumption, and the time to market while also enabling the promise of the green chemistry principles.1–4 Furthermore, continuous pharmaceutical manufacturing strongly aligns with regulatory authorities' mission of making society less vulnerable to supply interruptions and drug shortages.5 Surprisingly, however, the implementation of truly continuous end-to-end manufacturing of pharmaceuticals from molecule generation to formulated drug products has been slow to take off.4When applied to the production of active pharmaceutical ingredients (APIs), continuous manufacturing can be grouped into continuous synthesis (CS), using flow chemistry for the generation of API molecules and continuous crystallization (CC) for purification and solid formation of APIs suitable for formulation.6 CS has caught the imagination of scientists worldwide to increase safety, explore new reaction conditions, and reduce synthesis time.7–13 Similarly, CC offers relative to batch crystallization generally superior quality control, smaller footprint, and lower costs, while eliminating known batch-to-batch variability issues.14–18 However, developing a CC integrated with multistep CS is not straightforward and often entails significant chemical and technological challenges.18 Crudes obtained from telescoped multistep CS strategies lead to complex reaction mixtures accumulating, e.g., excess reagents, impurities, and solvents carried over from one step to the next one that generally cannot be fully removed by work up steps prior to crystallization.12,19–23 Especially, the immediate CC after the last CS step is impacted by the complexity of the reaction mixture.24 The presence of impurities and complex solvent mixtures is known to significantly impact both the thermodynamics and kinetics of crystallization processes, altering, e.g., the solubility, yield, purity, solid form, nucleation and growth rates.14,23–27 Despite the development of inline purification methods28 to prepare more conducive feeds for CC, efforts on integrated end-to-end continuous manufacturing of APIs had remained scarce.18,29 To reap the benefits of CS developments, close collaboration between the organic chemists and crystallization experts has been recommended to tackle this rarely reported challenge in CS–CC process integration efforts for end-to-end continuous drug substance manufacturing from molecule generation to the crystalline API suitable for drug product formulation.6,24
Pioneering work by the Novartis-Massachusetts Institute of Technology Center for Continuous Manufacturing resulted in the first integrated end-to-end continuous manufacturing process toward aliskiren hemifumarate, including multistep synthesis, purification, and formulation.30 A series of flow platforms capable of on demand preparation for numerous different drugs followed in the subsequent years.22,31,32 The second and third generations of these flow platforms featured crystallization steps in continuous mode.31,32 These tremendous research efforts emphasized the main hurdles associated with CC of crude APIs obtained from CS. For instance, a streamlined CS–CC process targeting ciprofloxacin was reported in 2017 by Lin et al.33 Upstream operations involved a five-step CS with an overall yield of 60%. Further CS optimization was necessary to enable direct connection to downstream CC.34 Progressively incremental refinements were reported,31,32,35 ultimately yielding ciprofloxacin with a purity of 79% (LCAP, liquid chromatography area percent). Nevertheless, more than 60 unknown impurities in the crude of ciprofloxacin deleteriously impacted the thermodynamics and kinetics in the subsequent CC employing a mixed suspension mixed product removal crystallizer (MSMPRC). Impurity control was key for the development of a successful CS–CC operation for this API.23 The control was achieved by an intermediate purification by liquid–liquid extraction and by taking advantage of the zwitterionic nature of ciprofloxacin to carefully optimize pH-controlled crystallization steps.34,35 This strategy led to a marked improvement in the CC process, and the final API was obtained with impurities below the USP value (<0.07% HPLC).34
In this work, we report efforts towards the development of a continuous end-to-end synthesis and purification process for the anti-narcoleptic modafinil (1), also used to give support through energy-depriving conditions.36,37 The upstream flow synthesis used in this work is based on a previously reported CS.38 Some improvements have been made to this protocol to increase the stability of the CS platform and the purity of the crude to facilitate its downstream integration. These optimizations of the CS procedure avoided additional purification, solvent switches, or concentration steps. Therefore, the CC is developed starting from a challenging crude solution including all impurities and unreacted starting materials from the upstream reactions, as well as the mixtures of solvents that resulted from the telescoped synthesis of 1. The downstream purification approach consisted of two CC steps utilizing two single stage MSMPRCs. This strategy delivered 1 according to US Pharmacopeia quality standards (≥99%, total impurities ≤1%, individual impurities ≤0.5%39 in the required commercial polymorphic form I.40–42
Results and discussion
Flow synthesis optimization
We previously reported the fully telescoped three-step synthesis in which 1 was obtained with ∼80% purity.38 This previous report mostly revolved around the improvement of economics, process intensification, and the reliance on widely available starting materials. There were no attempts to integrate in-line purifications, solvent switches, or concentration steps for its incorporation to a downstream purification. Therefore, it resulted in a crude solution, which included all impurities, unreacted starting materials and a mixture of solvents. Despite the excellent results previously reported,38 the CS–CC integration required strategical alterations.Despite taking precautions upon scale up, the published telescoped synthesis would occasionally clog the reactors.38 Resolving the clogging issue became especially relevant because relatively large amounts of crude 1 solution were needed (∼600 mL) for the development and execution of the CC protocols. This demanded running the CS more than nine times, each for ∼2 h to obtain sufficient crude 1 for the CC study. As a side note, the relatively large quantity of crude 1 solution required for the development of a downstream process derives from the fact that, to date, no satisfying and robust off-the-shelf μL/mL-scale CC equipment is available that matches the typically small-scale outputs for flow syntheses reported.18,29,38,43 Generally, customized ∼30 mL crystallization setups20,44–46 or novel prototypes43,47 are employed to tackle this bottleneck in developing integrated API manufacturing processes during R&D29 as reported in this study.
To address the clogging issues that were observed upon repeated reactions with increased duration, we identified that the most frequent cause were occasional temperature variations in the line delivering the 2-chloroacetamide (feed A, Fig. S1†). In the original design a heated syringe with a supersaturated solution of 2-chloroacetamide at 70 °C with a flow rate of 0.0625 mL min−1 was used.38 This allowed the concentration of the corresponding feed solution to be increased from ∼0.5 M (solubility limit at room temperature) to 1.5 M.
In general, working at high concentrations in the first steps of telescoped reactions is essential to avoid very dilute product solutions at the final step, which complicates the subsequent CC process. However, occasional decreases in temperature in the tubing from the pump to the heated reaction zone led to sporadic clogging due to crystallized 2-chloroacetamide. Even if crystallization of 2-chloroacetamide did not clog the reactor, it resulted in fluctuations in the concentration of 2-chloroacetamide, which resulted in sub-stoichiometric amounts of this reagent. The unreacted sodium thiosulfate could then reach R2 and upon contact with formic acid formed solid sulfur (Fig. 1). The occurrences were immediately evident due to the characteristic yellow solid visible through the PFA tubing that led to insurmountable clogging. To resolve the clogging problems in this step, it was discovered that a 0.75 M solution of both 2-chloroacetamide and sodium thiosulfate in a single feed solution did not form a precipitate, even after extended storage times. Pumping of this solution through a PFA coil at 120 °C for 2 min provided a consistent quantitative conversion in this first reaction step. This modification also allowed the elimination of one pump compared to the previous report,38 reducing the total to only 5 pumps needed for the 3-step synthesis of 1 (Fig. 1).
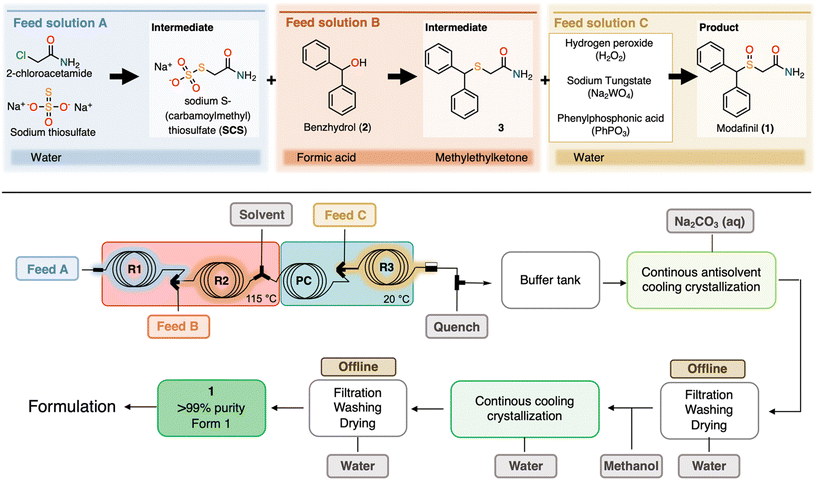 | ||
| Fig. 1 Top: three-step continuous flow synthesis of modafinil (1). Bottom: process flow diagram for synthesis and purification of 1 with all major unit operations leading to 1 in >99% purity (HPLC), including the microfluidic flow setup optimized from the literature.38 | ||
Despite this change, occasional clogging still occurred after ∼10–15 min of runtime at the mixer before R3. Sometimes white solids were also observed in the cooling loop PC before (Fig. 1). Closer examination of the telescoped system revealed pulsations in the pump delivering the solvent (MEK) between R2 and R3 (Fig. 1). It was hypothesized that these fluctuations caused the formation of very small precipitate of 3, eventually clogging the mixer before R3 (Fig. 1). Changing the corresponding pump from an HPLC pump to a syringe pump (less prone to pulsation) resulted in a smooth reaction that ran without clogging for the entire duration of the feed solutions (∼2 h when using 25 mL syringes). In addition, these two pump and feed/addition changes resulted in improved conversion in R2 and a more stable effluent stream after R3 to give 1 with increased purity compared to the previously reported data, summarized in Table 1 and Fig. 2.38 None of the changes made were related to the chemical parameters (reaction temperature, equivalents, etc.) but rather to the flow setup used to execute the reaction. Table S2† summarizes the set-up changes made between the published telescoped synthesis38 and the current study.
| %Area (HPLC)a | |||||||
|---|---|---|---|---|---|---|---|
| Peak # | Compound | Ref. 38b | This workc | 4 week storaged | Post Cr1e | Post washf | Post Cr2g |
| a %Area relates to the HPLC chromatogram at a detection wavelength of 220 nm, following USP recommendations.39 b Literature data represent the average and standard deviations for several sampling points during a single run of the reaction.38 c Analysis based on liquid samples from flow synthesis. n.d. stands for not detected. d Analysis of crude 1 (liquid sample) from flow synthesis campaign (this work) after storage for four weeks at 4 °C until Cr1 was conducted. e Analysis based on solid samples crystallized in this work. The CS and Cr1 data for this work corresponds to the cumulative average and standard deviation for campaigns performed at different days. Values are average of all Cr1 experiments once steady state was reached as summarized in Table 2 below. f Analysis based on solid samples crystallized in this work. g Values once steady state was reached. h This entry contained all unidentified signals detected by HPLC. | |||||||
| 1 | 1 | 80.7 ± 2.1 | 86.3 ± 0.9 | 83.6 | 90.7 ± 0.6 | 92.0 | 99.5 |
| 2 | 5 | 7.5 ± 0.3 | 7.3 ± 0.3 | 8.4 | 1.1 ± 0.5 | 1 | 0.32 |
| 3 | 6 | 0.66 ± 0.03 | 0.65 ± 0.04 | 0.68 | 0.73 ± 0.06 | 0.66 | 0.17 |
| 4 | 3 | 0.9 ± 0.7 | 3.5 ± 0.5 | 3.7 | 4.6 ± 0.4 | 4.5 | n.d. |
| 5 | 2 | 5.1 ± 0.9 | 2.1 ± 0.7 | 2.8 | 2.0 ± 0.6 | 1.5 | n.d. |
| 6 | 8 | 0.2 ± 0.1 | n.d. | 0.8 | 0.5 ± 0.3 | n.d. | n.d. |
| 7 | 4 | 1.8 ± 0.4 | n.d. | n.d. | n.d. | n.d. | n.d. |
| 8 | 7 | 0.4 ± 0.3 | n.d. | n.d. | n.d. | n.d. | n.d. |
| Other | Otherh | 2.7 ± 0.5 | 0.1 ± 0.3 | n.d. | n.d. | 0.4 | n.d. |
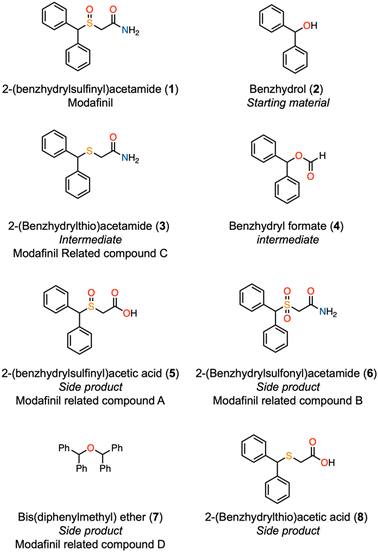 | ||
| Fig. 2 Structures of the main impurities related to modafinil (1). See also Table 1. | ||
With a consistent flow synthesis of 1 in hand, to obtain a homogeneous solution suitable for CC development, the final quench of excess H2O2 after step R3 (Fig. 1), initially reported with solid sodium sulfite,38 was performed with a 2 M aqueous solution of the sulfite. The quench flow rate was adjusted so that 3 equivalents of sodium sulfite were added for each mole of excess hydrogen peroxide in the output solution. The combined stream for each campaign was collected in buffer tanks under stirring to ensure rapid mixing (Fig. 1), thus avoiding potential overoxidation and formation of the problematic impurity 6.38 The tank was placed in an ice bath to avoid the temperature increase due to the exothermic quench reaction. Compared to the previously reported flow synthesis of 1,38 the output solutions obtained had an increased purity (86.3% vs. 80.7% of 1 by HPLC) and greater reproducibility (0.9% vs. 2.1% standard deviation of 1 by HPLC), with no new impurities being detected (Table 1). The solutions were relatively stable for ≥30 days, and subsequently used for the development of a continuous antisolvent crystallization process.
Development of continuous antisolvent cooling crystallization (Cr1)
![[thin space (1/6-em)]](https://www.rsc.org/images/entities/char_2009.gif) :
:![[thin space (1/6-em)]](https://www.rsc.org/images/entities/char_2009.gif) 35
35![[thin space (1/6-em)]](https://www.rsc.org/images/entities/char_2009.gif) :
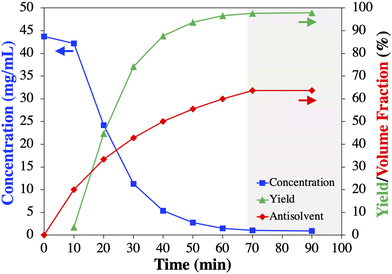
:![[thin space (1/6-em)]](https://www.rsc.org/images/entities/char_2009.gif) 22 (v/v/v). For details see section 4 in the ESI.† This artificially prepared solvent mixture was then utilized to measure the solubility of 1 and its crystallization behavior upon adding aqueous saturated sodium carbonate as the antisolvent. These experiments allowed to determine the antisolvent content and process temperature that led to a theoretical yield of >90% for the first continuous antisolvent cooling crystallization (Cr1, Fig. 3). Fig. 3a shows that the solubility of 1 decreases with decreasing temperature and increasing percentage (v/v) of antisolvent, allowing to reach the desired theoretical yield (>90%, Fig. 3b). Based on these results, preliminary batch screening experiments of crude 1 solutions were conducted.
22 (v/v/v). For details see section 4 in the ESI.† This artificially prepared solvent mixture was then utilized to measure the solubility of 1 and its crystallization behavior upon adding aqueous saturated sodium carbonate as the antisolvent. These experiments allowed to determine the antisolvent content and process temperature that led to a theoretical yield of >90% for the first continuous antisolvent cooling crystallization (Cr1, Fig. 3). Fig. 3a shows that the solubility of 1 decreases with decreasing temperature and increasing percentage (v/v) of antisolvent, allowing to reach the desired theoretical yield (>90%, Fig. 3b). Based on these results, preliminary batch screening experiments of crude 1 solutions were conducted.
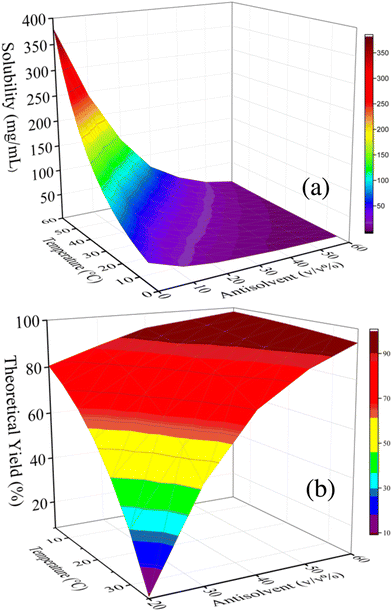 | ||
Fig. 3 a. Surface plots for (a) the solubility of commercial modafinil (1) in the ternary solvent system MEK + formic acid + water [43![[thin space (1/6-em)]](https://www.rsc.org/images/entities/char_2009.gif) : :![[thin space (1/6-em)]](https://www.rsc.org/images/entities/char_2009.gif) 35 35![[thin space (1/6-em)]](https://www.rsc.org/images/entities/char_2009.gif) : :![[thin space (1/6-em)]](https://www.rsc.org/images/entities/char_2009.gif) 22 (v/v/v)] as function of temperature and antisolvent (aqueous saturated sodium carbonate) content correlated with exponential equations (Fig. S7†) and (b) theoretical yield of 1 in a theoretical crystallization process as a function of temperature and antisolvent content for a feed concentration of 43 mg mL−1. 22 (v/v/v)] as function of temperature and antisolvent (aqueous saturated sodium carbonate) content correlated with exponential equations (Fig. S7†) and (b) theoretical yield of 1 in a theoretical crystallization process as a function of temperature and antisolvent content for a feed concentration of 43 mg mL−1. | ||
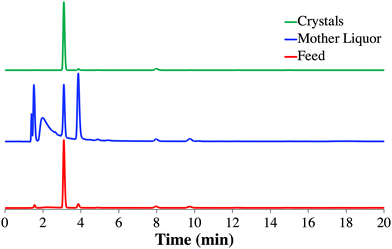
Though these chromatograms are normalized for illustration purposes (based on maximum peak intensity), it can be observed that the peaks corresponding to impurities present in the feed (red) disappeared or are reduced in intensity in the isolated 1 crystals (green). Specifically, the designed crystallization process resulted in a significant reduction of impurity 5 (eluting at ∼3.9 min) indicated by the relatively larger peak intensity in the mother liquor (blue) compared to the smaller intensity of 1 (eluting at ∼3.1 min) as a result of the high yielding crystallization process (Fig. 4). On the other hand, the impurity 3 (eluting at ∼8 min) is not purged in this first crystallization step, making a common second recrystallization step necessary to comply with USP purity requirements.22,24,31,32 The untreated (not normalized) chromatograms for Cr1 are shown in Fig. S12.†
Based on these results, it was decided, without claiming an optimized process, to establish the residence time for Cr1 at 1 h and slightly increase the antisolvent content to 65% (v/v) to maximize the yield.
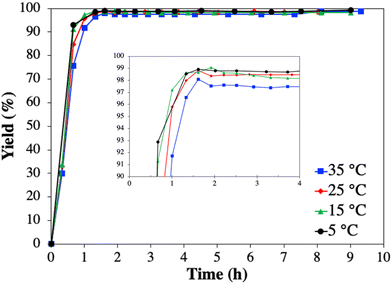
The results of all Cr1 experiments with respect to feed and mother liquor concentration, as well as yield and purity are summarized in Table 2. The average mother liquor concentration of 1 in all four Cr1 experiments reached a steady state at 0.6 ± 0.1 mg mL−1. This value is very close to the solubility (Fig. 2) and marginally subceeds the value obtained in the preliminary batch experiments (1.0 ± 0.1 mg mL−1), due to the slightly increased antisolvent content of 65% (v/v).
| Cr1 | T (°C) | Feed (mg mL−1) | Mother liquora (mg mL−1) | Yielda (%) | Purityb (%) |
|---|---|---|---|---|---|
| a Values are average of all samples once steady state was reached. b Values are from samples taken from all solids collected per experiment once steady state was reached. c Average of all Cr1 experiments. | |||||
| 1 | 35 | 31.7 | 0.7 ± 0.2 | 97.7 ± 0.5 | 89.9 |
| 2 | 25 | 36.5 | 0.6 ± 0.1 | 98.5 ± 0.1 | 91.3 |
| 3 | 15 | 32.3 | 0.5 ± 0.1 | 98.4 ± 0.3 | 90.7 |
| 4 | 5 | 30.3 | 0.4 ± 0.1 | 98.8 ± 0.2 | 91.2 |
| Averagec | 32.7 ± 2.7 | 0.6 ± 0.1 | 98.4 ± 0.5 | 90.8 ± 0.6 | |
Table 2 shows that the effect of decreasing temperature on the yield and purity is negligible between 25 to 5 °C. Only experiment Cr1-1, conducted at 35 °C, resulted in slightly lower values than the average. The limited temperature dependency on the final yield is due to the diminishing solubility dependency with increasing antisolvent volume fraction (Fig. 3a). However, it seems that decreasing the temperature from 35 to 15 °C slightly accelerates the desuperaturation, thus, achieving the maximum yield faster (Fig. 6 inset). This qualitative assessment is based on the common understanding that with decreasing temperature the supersaturation is increasing and thus its depending kinetics (nucleation, growth) as long as the mass transport phenomena are not limiting, which seems to be obtained <15 °C.25,48 In average all Cr1 experiments resulted in a yield and purity of 1 of 98.4 ± 0.5% and 90.8 ± 0.6%, respectively (Table 2), thus, similar to the batch screening experiment. Though Cr1 improved the purity of 1 compared to the feed, the desired purity level to comply with USP requirements (≥99%, total impurities ≤1%, individual impurities ≤0.5%) was not achieved in Cr1 (Table 1).39 Thus, a second CC process (Cr2) was developed, which is common practice to meet USP requirements.22,24,31,32
Development of continuous cooling crystallization (Cr2)
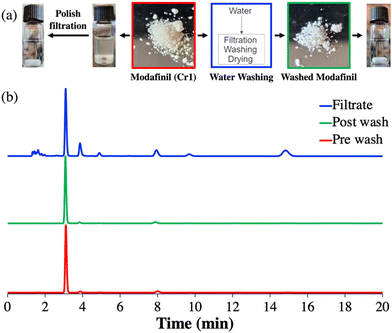
To identify the cause of these particulates the up- and downstream teams reviewed all available data obtained after Cr1 and hypothesized that the cloudiness was caused by water soluble impurities, e.g., sodium carbonate (not traced by HPLC), which were added in the aqueous antisolvent solution or other process impurities that co-precipitated during Cr1.25,55,56 Thus, it was concluded that a re-slurrying of the 1 crystals from Cr1 with chilled water (∼4 °C) will remove these impurities (Table 1).
Indeed, after the slurry was filtered and the recovered solids were dried at 50 °C under reduced pressure overnight, a visual color change of the pre-yellowish to the post-whitish crystals could be observed, resulting in a clear solution upon dissolution (Fig. 7a). In addition, HPLC analysis of the crystals before and after the treatment step as well as the filtrate, revealed the decrease of peak intensities for some impurities while their intensity relative to 1 increased in the washing liquid as shown in the normalized chromatograms in Fig. 7b. Based on these preliminary results and without further optimization of the washing step, all 1 crystals recovered from the Batch Cr1 experiments were pooled together (∼10 g) and slurried with chilled (∼4 °C) water (100 mL) for 5 min under gentle magnetic stirring. Thereafter, the slurry was filtered (Buchner funnel, filter paper, Grade 454, VWR) and dried under reduced pressure at 50 °C overnight. Applying this washing protocol, increased the purity of 1 crystals from 90.7 ± 0.6% (post Cr1) to 92.0% (post wash, Table 1). Specifically, 8 (peak 6, eluting at ∼15 min) was completely removed (Table 1). The loss of 1 in the filtrate (chilled water) was not quantified, but based on the reported solubility of 1 in water,54 the loss can be assumed to be <1% (<0.6 mg mL−1).
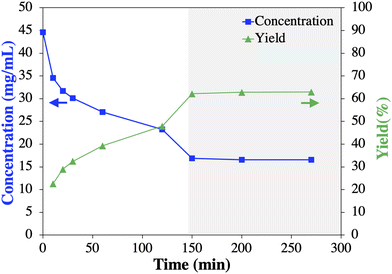
To further advance the Cr2 process development with scarce crude 1, an unseeded batch experiment (50 mL) with commercial 1 was performed to provide a residence time estimation for Cr2 by tracking the desupersaturation curve (Fig. 8). While aware of the influence of impurities on crystallization kinetics (typically decreasing),14,25–27 the initial results described below proved valuable towards the implementation of a successful Cr2 process. Fig. 8 shows that the mother liquor concentration of 1 plateaued after ∼150 min, indicating (i) equilibrium was achieved with an experimental yield of 62.2% and (ii) crystallization kinetics for 1 is rather slow. It can further be determined that the experimental yield for Cr2 designed as a mere cooling crystallization (Fig. 8) will be lower compared to a possible antisolvent (water) cooling crystallization with a theoretical yield of ≥90% (based on solubility data54 Fig. S9†). However, during preliminary batch antisolvent cooling crystallization experiments, agglomeration formation of 1 was observed (Fig. S10†). In general, agglomerates represent a challenge for crystallization as it may lead to diminished overall purity of the crystallized material due to the entrapment of the impurity-rich mother liquor.25,55,56 Common strategies to prevent agglomeration formation include, e.g., (i) changing (anti)solvent(s), (ii) improving fluid dynamic conditions, or (iii) reducing supersaturation.25 The change of (anti)solvent(s) was excluded due to the solid form and solubility constraints discussed above. Fluid dynamic in the MSMPRC was assumed sufficient. However, a significant impact of the supersaturation on the agglomeration formation of 1 from methanol and water was proven in preliminary experiments (Fig. S10†). Briefly, subjective micrograph assessments showed that the prevalence of agglomeration formation was increasing with increasing supersaturation by increasing the antisolvent content and decreasing the crystallization temperature. For instance, multi-stage MSMPRCs with distributed antisolvent addition and decreasing temperature per stage would allow lowering the supersaturation per stage to prevent agglomeration formation of 1 while enabling yield maximation.46 This suggested strategy assumes that the impurity rejection is not altered and, thus, needs to be experimentally tested. In addition, the yield may be increased by mother liquor recycling.46 However, implementing these strategies to prevent agglomeration formation of 1 and increase the Cr2 yield was considered an optimization task via experimental and process systems engineering approaches that were beyond the scope of this study.20,23,57,58 Thus, the purity and proof-of-concept Cr2 with crude 1 able to deliver 1 in >99% purity (HPLC), according to the impurity thresholds indicated by the USP monograph,39 was given a higher priority due to the limited feed solution of 1 after Cr1 available for Cr2 (225 mL) and the time constraints of the study. This decision was also made in the light of the proven impurity rejection of the sole cooling crystallization process meeting USP purity standards39 and the generation of the desired polymorphic form I.41,42
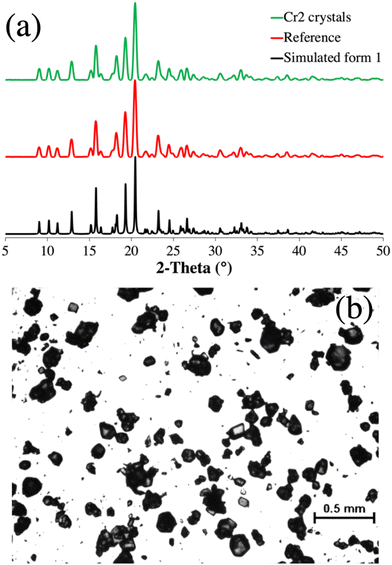 | ||
| Fig. 9 a. Powder X-ray diffractograms of modafinil (1). From bottom to top: simulated polymorphic form I (black, reference code = 236078)59 obtained from the Cambridge Structural Database,60 reference “as received” (red), and Cr2 crystals (green) b. Representative optical micrograph of 1 crystals obtained from Cr2. | ||
Conclusion
This investigation reports on one of the rare case studies aimed at addressing the need for integrated end-to-end manufacturing of drug substances from CS for isolation and purification via CC to obtain the desired crystalline API, here modafinil (1). About 90% of all APIs require crystallization to obtain the desired purity and material attributes associated with the solid form (e.g., polymorph) and physical attributes (e.g., size, morphology). These properties are important as they alter the performance of the API in formulated drug products. While demonstrating the capability of the integrated strategy to purify 1 from synthesized crude in compliance with the USP (>99% purity) and in the polymorphic form I suitable for formulation, this proof-of-concept study also highlights challenges along the way. At the forefront of these challenges is the urgent need for close collaborations between organic chemists and crystallization experts. Though flow chemistry technologies have already reached commercial readiness, there is a critical gap between the CS advancements compared to CC studies, often conducted with commercial (purified) APIs. To accomplish the benefits of integrated API manufacturing, this hiatus in combined R&D represents a major obstacle and requires the development of CC processes in sync with CS processes through collaborations and the financial support for the underlying interdisciplinary science that enables viable CS–CC process development beyond case-to-case studies.Experimental
General information
Acetone, benzhydrol, 2-chloroacetamide, ethanol, ethyl acetate, formic acid (FA), isopropanol (IPA), methanol, methyl ethyl ketone (MEK), methyl tert-butyl ether (MTBE), modafinil (for reference purpose), phenylphosphonic acid, sodium carbonate, sodium thiosulfate, and sodium tungstate were purchased from commercial sources. Details of the suppliers, CAS numbers, and purity as provided by the chemical suppliers are described in the ESI† (section 2.1). 2-[(Diphenylmethyl)sulfinyl]acetic acid and 2-(benzhydrylsulfinyl)acetamide were synthesized following previously published protocols.38 Ultra-high purified water (18.23 MOhm cm−1, pH = 5.98, and mV = 57.3) was obtained from a water purification system (Aries Filterworks, Gemini). All materials were used as received without additional purification.Microfluidic setup for the flow synthesis
The microfluidic setup (Fig. 1) was constructed from high-purity PFA (perfluoroalkoxy polymer) tubing (1.58 mm outer diameter [OD], 0.762 inner diameter [ID]) equipped with Super Flangeless™ PEEK (polyether ether ketone) connectors and ferrules (IDEX/Upchurch Scientific). Feed and collection lines consisted of PFA tubing (OD 1.58 mm, ID 0.750 mm) equipped with Super Flangeless™ PEEK connectors and ferrules (IDEX/Upchurch Scientific). The reactors were connected using either a PEEK T-mixer, PEEK Y-mixer, or a high-pressure mixing Tee equipped with an ultra-high molecular weight polyethylene (UHMWPE) frit (IDEX). Liquid feeds were handled at room temperature using Chemyx Fusion 6000 syringe pumps equipped with stainless steel syringes or a single syringe pump (Fisherbrand™, Fisher Scientific) equipped with plastic syringes (25 mL with Luer Lock, B Braun Injekt). The coiled microfluidic setup was submerged in oil or water baths to control the temperature with two VWR® Advanced Magnetic Hotplates equipped with an external Pt-100 temperature sensor. Downstream pressure was controlled with a back pressure regulator from Zaiput Flow Technologies (BPR-10) mounted after reaction step 3 (R3). A setup comparison of the optimized flow synthesis scheme (Fig. 1) with the previously reported microfluidic system is provided in Fig. S1.† Fig. S2 and S3† show the assembled reactor coils and complete upstream setup, respectively.Crystallization setup
Continuous antisolvent/cooling crystallization experiments of purified (commercial) and crude 1 were conducted in a single stage mixed suspension mixed product removal crystallizer (MSMPRC). The crystallizer consisted of a 50 mL, 5-neck jacketed flask (Ace Glass) equipped with a half-moon-shaped PTFE stirrer blade (Ace Glass) and overhead stirrer (J-Kem Scientific, OHS-1 M) at 300 rpm (Fig. S4†). The MSMPRC was temperature controlled using a recirculating bath (Julabo, F32-ME). The feed solution, antisolvent, and product withdrawal were conducted via programmable peristaltic pumps (Masterflex L/S, Cole-Parmer). The peristaltic pumps for feed and antisolvent were equipped with 1/8 × 3/16" PFA tubing and flexible Chem-Durance Bio Pump Tubing, L/S 13 in the pump heads (all Masterflex L/S, Cole-Parmer). The working volume in the MSMPRC was controlled by the position of the outlet dip tube (5/32" ID × 1/4"OD PFA tubing with flexible Chem-Durance Bio Pump Tubing, L/S 16 in the pump head [all Masterflex L/S, Cole-Parmer]) utilizing an intermittent withdrawal scheme.46 Briefly, the outlet peristaltic pump (Masterflex L/S, Cole-Parmer) was programmed to withdraw 10% of the working volume every one tenth of the residence time for 20 s of discharge time at a maximum pump flow rate of 80 mL min−1 to limit undesired size classification of crystals upon withdrawal.46Fully concatenated upstream process to modafinil
Modafinil (1) was produced via a telescoped three-step flow synthesis process (Fig. 1) optimized from our previous work38 to facilitate integration with the subsequent purification via two CC steps. Briefly, an aqueous feed A solution containing both 2-chloroacetamide (0.75 M) and sodium thiosulfate (0.75 M) was pumped at a rate of 0.125 mL min−1 through reactor 1 (R1) consisting of a PFA capillary coil (ID 0.762 mm, length 0.55 m) with an internal volume of 0.25 mL and residence time (τ) of 2 min. The output of R1 was directly connected to a high-pressure mixing Tee equipped with (UHMWPE) frit (IDEX), where it was combined with a Feed B solution composed of benzhydrol in formic acid (0.6 M) pumped at 0.125 mL min−1. The resulting mixture was pumped through R2 (PFA capillary coil, ID 0.508 mm, length 4.93 m, 1 mL internal volume, τ = 4 min). Both R1 and R2 were placed in an oil bath at 115 °C. The output of R2 was connected to a Y-mixer, where it was combined with the solvent methyl ethyl ketone (MEK) pumped at a flow rate of 0.08 mL min−1. The output of this Y-mixer was connected to a PFA coil (PC, ID 0.762 mm length 0.88 m, 0.4 mL internal volume, τ = 1.6 min), placed in a water bath at 20 °C. PC was used to allow the reaction to cool before entering a high-pressure arrow mixer, where it was combined with a feed C solution composed of 15% hydrogen peroxide containing sodium tungstate (4 mol%) and phenylphosphonic acid (4.5 mol%). This feed C solution was delivered at a flow rate of 0.0241 mL min−1 at which 1.5 equivalents H2O2 is present. The resulting mixture was pumped through R3 (PFA capillary coil, ID 0.508 mm, length 2.47 m, 0.5 mL internal volume, τ = 1.4 min). A back pressure regulator was used at the outlet of R3 to maintain the pressure in the telescoped microfluidic system at 7 bar. The output solution was immediately quenched using a T-mixer. The quenched solution was composed of aqueous sodium sulfite (25 g mL−1) at a flow rate of 0.0241 mL min−1 to match the equivalents of hydrogen peroxide. The effluent of nine synthesis campaigns (∼2 h per campaign) were collected under stirring in 100 mL glass flasks placed in an ice bath. The crude solutions of 1 were analyzed by HPLC (for details see ESI,† section 3) before being processed by CC for purification.Continuous antisolvent/cooling crystallization (Cr1)
Prior to the first continuous antisolvent crystallization step (Cr1, Fig. 1), the crude of 1 produced from all nine flow synthesis campaigns and stored at 4 °C, was homogenized at room temperature (∼20 °C) for 1 h. The homogenization was followed by a polish filtration using a Buchner funnel under reduced pressure (filter paper, Grade 454, VWR) to remove possible solids (≥10 μm) in the feed before crystallization was initiated.25 During the startup phase of the CC, the temperature-controlled MSMPRC (working volume 35 mL) was operated as a semi-batch crystallizer by first adding 20 mL of the polished feed of 1.14 Subsequently, 38.8 mL of the antisolvent (saturated aqueous sodium carbonate solution at room temperature) was continuously added at 0.38 mL min−1, at the chosen crystallization temperature. The specific temperatures studied were 35, 25, 15, and 5 °C with corresponding feed concentrations of 1 in the crude (HPLC) being 31.7, 36.5, 32.3, and 30.3 mg mL−1, respectively. Once the 34![[thin space (1/6-em)]](https://www.rsc.org/images/entities/char_2009.gif) :
:![[thin space (1/6-em)]](https://www.rsc.org/images/entities/char_2009.gif) 66 volumetric ratio of feed and antisolvent was reached inside the crystallizer causing nucleation of 1, the continuous feed at 0.20 mL min−1 and the intermittent withdrawal (3.5 mL every 6 min) was started to initiate the continuous operation of Cr1 with τ = 1 h. The withdrawn volume was periodically verified using a graduated cylinder to ensure accurate slurry withdrawal and thus τ throughout the experiment. The saturated sodium carbonate solution was prepared by adding excess of sodium carbonate in water stirred for ≥24 h before letting the crystals settle and only pump the clear supernatant into the MSMPRC. To track the evolution of the steady state, slurry samples (3.5 mL) were collected every 18–24 min for the first 240 min of each experiment at the outlet of Cr1 to measure the mother liquor concentration of 1 employing a USP HPLC method.39 Once steady state was achieved the frequency of sampling was changed to every 60 min, thus one per every τ. The slurry samples were immediately filtered (0.4 μm syringe filter, Millipore) and the filtrate was diluted to target in acetonitrile/water (35
66 volumetric ratio of feed and antisolvent was reached inside the crystallizer causing nucleation of 1, the continuous feed at 0.20 mL min−1 and the intermittent withdrawal (3.5 mL every 6 min) was started to initiate the continuous operation of Cr1 with τ = 1 h. The withdrawn volume was periodically verified using a graduated cylinder to ensure accurate slurry withdrawal and thus τ throughout the experiment. The saturated sodium carbonate solution was prepared by adding excess of sodium carbonate in water stirred for ≥24 h before letting the crystals settle and only pump the clear supernatant into the MSMPRC. To track the evolution of the steady state, slurry samples (3.5 mL) were collected every 18–24 min for the first 240 min of each experiment at the outlet of Cr1 to measure the mother liquor concentration of 1 employing a USP HPLC method.39 Once steady state was achieved the frequency of sampling was changed to every 60 min, thus one per every τ. The slurry samples were immediately filtered (0.4 μm syringe filter, Millipore) and the filtrate was diluted to target in acetonitrile/water (35![[thin space (1/6-em)]](https://www.rsc.org/images/entities/char_2009.gif) :
:![[thin space (1/6-em)]](https://www.rsc.org/images/entities/char_2009.gif) 65 [v/v]).39 Steady state was deemed to be reached when the mother liquor concentration stopped varying with time.57 Once steady state was attained, Cr1 was operated for ≥7 τ without clogging. During the experiments the slurry was continuously collected at ambient temperature using a manually operated batch filtration (Buchner funnel under reduced pressure).61 The filter paper (Grade 454, VWR) with a particle retention of 10 μm was replaced after each τ = 1 h. The filter cake was washed intermittently with 5–10 mL of water at ambient temperature to remove mother liquor and possible inorganic salts by dissolution. The crystals were then dried at 50 °C under reduced pressure for ≥12 h. Samples of the dried 1 crystals were taken for purity determination (HPLC).39
65 [v/v]).39 Steady state was deemed to be reached when the mother liquor concentration stopped varying with time.57 Once steady state was attained, Cr1 was operated for ≥7 τ without clogging. During the experiments the slurry was continuously collected at ambient temperature using a manually operated batch filtration (Buchner funnel under reduced pressure).61 The filter paper (Grade 454, VWR) with a particle retention of 10 μm was replaced after each τ = 1 h. The filter cake was washed intermittently with 5–10 mL of water at ambient temperature to remove mother liquor and possible inorganic salts by dissolution. The crystals were then dried at 50 °C under reduced pressure for ≥12 h. Samples of the dried 1 crystals were taken for purity determination (HPLC).39
Continuous cooling crystallization (Cr2)
All the solids collected from the Cr1 experiments, including the washing steps for posttreatment, were pooled, and redissolved in 225 mL of methanol by heating on a stirred plate until all solids were visually dissolved. Subsequently, the resulting feed solution (35 mg mL−1) was allowed to cool to room temperature without visual nucleation due to the broad metastable zone (Fig. S8†). The MSMPRC (30 mL working volume) was operated as a batch crystallizer during the startup phase by adding 30 mL of the feed to the crystallizer kept at 5 °C. Once the nucleation was visually detected inside the crystallizer (after ∼60 min), the addition of feed solution (0.25 mL min−1) along with intermittent withdrawal (3.0 mL every 12 min) was initiated, marking the start of the continuous operation of Cr2 with τ = 2 h. The mother liquor concentration of 1 in the withdrawn slurry was determined every 36–48 min using the procedure detailed for Cr1 above. Once the continuous mode was initiated, the MSMPRC was operated for 11 h (5.5 τ) while consuming all solution prepared using the solids obtained after Cr1. Once steady state was reached after ∼3 τ, the slurry was continuously collected using batch filtration and slurry samples, periodically withdrawn, to determine the mother liquor concentration39 as detailed for Cr1 above. Similar to Cr1, the dried 1 crystals after Cr2 were analyzed for purity39 and solid-state (powder X-ray diffraction (PXRD), optical microscopy).Data availability
The data supporting this article have been included as part of the ESI,† available from DOI: https://doi.org/10.1039/D4RE00273C. Containing details regarding the flow and crystallization setups, methods, purity quantification, additional synthesis procedures, solubility data, theoretical and experimental yield for Cr2, micrographs, and HPLC chromatograms.Author contributions
Diana V. Silva-Brenes: methodology, investigation, formal analysis, writing – original draft, visualization. Shailesh Agrawal: methodology, investigation, formal analysis, writing – review & editing. Vilmalí López Mejías: writing – review & editing. Jorge Duconge: writing – review & editing. Cornelis P. Vlaar: writing – review & editing. Jean-Christophe M. Monbaliu: conceptualization, supervision, funding acquisition, writing – review & editing. Torsten Stelzer: conceptualization, supervision, funding acquisition, project administration, writing – original draft, Writing – review & editing.Conflicts of interest
There are no conflicts to declare.Acknowledgements
This study was primarily supported by the National Aeronautics and Space Administration Experimental Program to Stimulate Competitive Research (NASA, 80NSSC19M0148), the F.R.S.-FNRS (Incentive grant for scientific research MIS F453020F, JCMM) and the University of Liège. The Rigaku XtalLAB SuperNova X-ray micro-diffractometer was acquired under the Major Research Instrumentation Program of the National Science Foundation (NSF, CHE-1626103). The authors acknowledge Dr. Aliou Mbodji, a member of the Crystallization Design Institute, for his support in preparing figures.Notes and references
- C. Jiménez-González, P. Poechlauer, Q. B. Broxterman, B.-S. Yang, D. am Ende, J. Baird, C. Bertsch, R. E. Hannah, P. Dell'Orco, H. Noorman, S. Yee, R. Reintjens, A. Wells, V. Massonneau and J. Manley, Org. Process Res. Dev., 2011, 15, 900–911 CrossRef
.
- J. S. Srai, C. Badman, M. Krumme, M. Futran and C. Johnston, J. Pharm. Sci., 2015, 104, 840–849 CrossRef CAS PubMed
.
- C. L. Burcham, A. J. Florence and M. D. Johnson, Annu. Rev. Chem. Biomol. Eng., 2018, 9, 253–281 CrossRef PubMed
.
- L. Rogers and K. F. Jensen, Green Chem., 2019, 21, 3481–3498 RSC
.
- S. L. Lee, T. F. O'Connor, X. Yang, C. N. Cruz, S. Chatterjee, R. D. Madurawe, C. M. V. Moore, L. X. Yu and J. Woodcock, J. Pharm. Innov., 2015, 10, 191–199 CrossRef
.
-
M. O'Mahony, S. Ferguson, T. Stelzer and A. Myerson, in Science of Synthesis: Flow Chemistry in Organic Synthesis, ed. T. F. Jamison and G. Koch, Georg Thieme Verlag KG, Stuttgart, 2018, pp. 51–102 Search PubMed
.
- M. Baumann and I. R. Baxendale, Beilstein J. Org. Chem., 2015, 11, 1194–1219 CrossRef CAS PubMed
.
- S. A. May, J. Flow Chem., 2017, 7, 137–145 CrossRef CAS
.
- K. P. Cole and M. D. Johnson, Expert Rev. Clin. Pharmacol., 2018, 11, 5–13 CrossRef CAS PubMed
.
- M. Baumann, T. S. Moody, M. Smyth and S. Wharry, Org. Process Res. Dev., 2020, 24, 1802–1813 CrossRef CAS
.
- C. R. Sagandira, S. Nqeketo, K. Mhlana, T. Sonti, S. Gaqa and P. Watts, React. Chem. Eng., 2022, 7, 214–244 RSC
.
- J. Jiao, W. Nie, T. Yu, F. Yang, Q. Zhang, F. Aihemaiti, T. Yang, X. Liu, J. Wang and P. Li, Chem. – Eur. J., 2021, 27, 4817–4838 CrossRef CAS PubMed
.
- P. Bianchi and J.-C. M. Monbaliu, Acc. Chem. Res., 2024 DOI:10.1021/acs.accounts.4c00340
, Article ASAP.
-
N. Yazdanpanah and Z. K. Nagy, The Handbook of Continuous Crystallization, The Royal Society of Chemistry, London, UK, 2020 Search PubMed
.
- A. Eren, F. Civati, W. Ma, J. C. Gamekkanda and A. S. Myerson, J. Cryst. Growth, 2023, 601, 126958 CrossRef CAS
.
- B. Wood, K. P. Girard, C. S. Polster and D. M. Croker, Org. Process Res. Dev., 2019, 23, 122–144 CrossRef CAS
.
- J. Orehek, D. Teslić and B. Likozar, Org. Process Res. Dev., 2021, 25, 16–42 CrossRef CAS
.
- A. Cote, D. Erdemir, K. P. Girard, D. A. Green, M. A. Lovette, E. Sirota and N. K. Nere, Cryst. Growth Des., 2020, 20, 7568–7581 CrossRef CAS
.
- M. Guidi, P. H. Seeberger and K. Gilmore, Chem. Soc. Rev., 2020, 49, 8910–8932 RSC
.
- H. Zhang, J. Quon, A. J. Alvarez, J. Evans, A. S. Myerson and B. Trout, Org. Process Res. Dev., 2012, 16, 915–924 CrossRef CAS
.
- C. S. Polster, K. P. Cole, C. L. Burcham, B. M. Campbell, A. L. Frederick, M. M. Hansen, M. Harding, M. R. Heller, M. T. Miller, J. L. Phillips, P. M. Pollock and N. Zaborenko, Org. Process Res. Dev., 2014, 18, 1295–1309 CrossRef CAS
.
- A. Adamo, R. L. Beingessner, M. Behnam, J. Chen, T. F. Jamison, K. F. Jensen, J.-C. M. Monbaliu, A. S. Myerson, E. M. Revalor, D. R. Snead, T. Stelzer, N. Weeranoppanant, S. Y. Wong and P. Zhang, Science, 2016, 352, 61–67 CrossRef CAS PubMed
.
- G. Capellades, H. Wiemeyer and A. S. Myerson, Cryst. Growth Des., 2019, 19, 4008–4018 CrossRef CAS
.
- J.-C. M. Monbaliu, T. Stelzer, E. Revalor, N. Weeranoppanant, K. F. Jensen and A. S. Myerson, Org. Process Res. Dev., 2016, 20, 1347–1353 CrossRef CAS
.
-
A. S. Myerson, D. Erdemir and A. Y. Lee, Handbook of Industrial Crystallization, Cambridge University Press, Cambridge, UK, 3rd edn, 2019 Search PubMed
.
-
K. Sangwal, in Additives and Crystallization Processes - From Fundamentals to Applications, ed. K. Sangwal, John Wiley & Sons Ltd., West Sussex, England, 2007, pp. 381–419 Search PubMed
.
-
J. Ulrich and T. Stelzer, Kirk-Othmer Encycl. Chem. Technol., 2011, pp. 1–63 Search PubMed
.
- N. Weeranoppanant and A. Adamo, ACS Med. Chem. Lett., 2020, 11, 9–15 CrossRef CAS PubMed
.
- S. Agrawal, D. V. Silva Brenes, J.-C. M. Monbaliu, C. Vlaar, J. Duconge, V. López-Mejías and T. Stelzer, in End-to-End Continuous Manufacturing, 18th Annual IFPAC Virtual Summit with INDUNIV, 2021 Search PubMed.
- S. Mascia, P. L. Heider, H. Zhang, R. Lakerveld, B. Benyahia, P. I. Barton, R. D. Braatz, C. L. Cooney, J. M. B. Evans, T. F. Jamison, K. F. Jensen, A. S. Myerson and B. L. Trout, Angew. Chem., Int. Ed., 2013, 52, 12359–12363 CrossRef CAS PubMed
.
- P. Zhang, N. Weeranoppanant, D. A. Thomas, K. Tahara, T. Stelzer, M. G. Russell, M. O'Mahony, A. S. Myerson, H. Lin, L. P. Kelly, K. F. Jensen, T. F. Jamison, C. Dai, Y. Cui, N. Briggs, R. L. Beingessner and A. Adamo, Chem. – Eur. J., 2018, 24, 2776–2784 CrossRef CAS PubMed
.
- L. Rogers, N. Briggs, R. Achermann, A. Adamo, M. Azad, D. Brancazio, G. Capellades, G. Hammersmith, T. Hart, J. Imbrogno, L. P. Kelly, G. Liang, C. Neurohr, K. Rapp, M. G. Russell, C. Salz, D. A. Thomas, L. Weimann, T. F. Jamison, A. S. Myerson and K. F. Jensen, Org. Process Res. Dev., 2020, 24, 2183–2196 CrossRef CAS
.
- H. Lin, C. Dai, T. F. Jamison and K. F. Jensen, Angew. Chem., Int. Ed., 2017, 56, 8870–8873 CrossRef CAS PubMed
.
- C. Armstrong, Y. Miyai, A. Formosa, D. Thomas, E. Chen, T. Hart, V. Schultz, B. K. Desai, A. Y. Cai, A. Almasy, K. Jensen, L. Rogers and T. Roper, Org. Process Res. Dev., 2021, 25, 1524–1533 CrossRef CAS
.
- G. Capellades, C. Neurohr, N. Briggs, K. Rapp, G. Hammersmith, D. Brancazio, B. Derksen and A. S. Myerson, Org. Process Res. Dev., 2021, 25, 1534–1546 CrossRef CAS
.
- A. J. Goss, M. Kaser, S. G. Costafreda, B. J. Sahakian and C. H. Y. Fu, J. Clin. Psychiatry, 2013, 74, 1101–1107 CrossRef CAS PubMed
.
- C. C. Conley, C. S. Kamen, C. E. Heckler, M. C. Janelsins, G. R. Morrow, L. J. Peppone, A. J. Scalzo, H. Gross, S. Dakhil, K. M. Mustian and O. G. Palesh, J. Clin. Psychopharmacol., 2016, 36, 82–85 CrossRef CAS PubMed
.
- D. V. Silva-Brenes, N. Emmanuel, V. Lopez-Mejias, J. Duconge Soler, C. Vlaar, T. Stelzer and J.-C. M. Monbaliu, Green Chem., 2022, 24, 2094–2103 RSC
.
- United States Pharmacopeia (USP), Monograph, 2020, 45, DocId: GUID-95991A0F-0142-4945-B39B-3931911EC151_3.
- R. Kumar, Drugs, 2008, 68, 1803–1839 CrossRef CAS PubMed
.
-
A. Ceausu, A. Lieberman and J. Aronhime, US8048222B2, 2011
.
-
G. Castaldi, V. Lucchini and A. Tarquini, EP1503983B1, 2007
.
- G. Aprile, A. Pandit, J. Albertazzi, T. Stelzer and A. Myerson, in 22nd ISIC - International Symposium on Industrial Crystallization and 52nd BACG - Annual Meeting of the British Association for Crystal Growth, Glasgow, Scotland, 2023 Search PubMed.
- Y. Cui, M. O'Mahony, J. J. Jaramillo, T. Stelzer and A. S. Myerson, Org. Process Res. Dev., 2016, 20, 1276–1282 CrossRef CAS
.
- J. L. Quon, H. Zhang, A. Alvarez, J. Evans, A. S. Myerson and B. L. Trout, Cryst. Growth Des., 2012, 12, 3036–3044 CrossRef CAS
.
-
T. Stelzer, R. Lakerveld and A. S. Myerson, in The Handbook of Continuous Crystallization, ed. N. Yazdanpanah and Z. K. Nagy, The Royal Society of Chemistry, 2020, pp. 266–320 Search PubMed
.
- J. Albertazzi, A. Pandit, G. Aprile, T. Stelzer and A. S. Myerson, in 2023 AIChE Annual Meeting, AIChE, Orlando, FL, USA, 2023 Search PubMed.
-
W. Beckmann, Crystallization: Basic Concepts and Industrial Applications, Wiley-VCH Verlag GmbH & Co. KGaA, Weinheim, Germany, 2013 Search PubMed
.
- J. Mahieux, M. Sanselme and G. Coquerel, Cryst. Growth Des., 2016, 16, 396–405 CrossRef CAS
.
- J. Mahieux, M. Sanselme and G. Coquerel, Cryst. Growth Des., 2013, 13, 908–917 CrossRef CAS
.
- S. P. Stokes, C. C. Seaton, K. S. Eccles, A. R. Maguire and S. E. Lawrence, Cryst. Growth Des., 2014, 14, 1158–1166 CrossRef CAS
.
- Food & Drug Administration, Q3C Tables and List -- Guidance for Industry, https://www.fda.gov/downloads/drugs/guidances/ucm073395.pdf, (accessed 19 August 2019).
-
H. G. Brittain, Polymorphism in Pharmaceutical Solids, 2nd edn, 2016, vol. 192 Search PubMed
.
- A. Mbodji, S. Agrawal, K. Mulero Cruz, D. Perez-Molares, C. P. Vlaar, J. Duconge, J.-C. M. Monbaliu and T. Stelzer, J. Chem. Eng. Data, 2024, 69, 1984–1993 CrossRef CAS
.
- S. J. Urwin, G. Levilain, I. Marziano, J. M. Merritt, I. Houson and J. H. Ter Horst, Org. Process Res. Dev., 2020, 24, 1443–1456 CrossRef CAS PubMed
.
- G. Capellades, J. O. Bonsu and A. S. Myerson, CrystEngComm, 2022, 24, 1989–2001 RSC
.
-
A. D. Randolph and M. A. Larson, Theory of Particulate Processes, Academic Press, Inc., New York, NY, 2nd edn, 1988 Search PubMed
.
- E. N. Pistikopoulos, A. Barbosa-Povoa, J. H. Lee, R. Misener, A. Mitsos, G. V. Reklaitis, V. Venkatasubramanian, F. You and R. Gani, Comput. Chem. Eng., 2021, 147, 107252 CrossRef CAS
.
- W. Pei, L. Sun, Y. Shao and D. Li, Acta Crystallogr., Sect. E: Struct. Rep. Online, 2004, 60, 372–373 CrossRef
.
- C. R. Groom, I. J. Bruno, M. P. Lightfoot and S. C. Ward, Acta Crystallogr., Sect. B: Struct. Sci., Cryst. Eng. Mater., 2016, 72, 171–179 CrossRef CAS PubMed
.
- K. P. Cole, B. M. Campbell, M. B. Forst, J. McClary Groh, M. Hess, M. D. Johnson, R. D. Miller, D. Mitchell, C. S. Polster, B. J. Reizman and M. Rosemeyer, Org. Process Res. Dev., 2016, 20, 820–830 CrossRef CAS
.
Footnotes |
| † Electronic supplementary information (ESI) available: Details for the construction of the photoreactor, setups, additional experimental details and characterization of compounds. See DOI: https://doi.org/10.1039/d4re00273c |
| ‡ Equal contributions. |
| This journal is © The Royal Society of Chemistry 2024 |

