
Rare earth-based Cs2NaRECl6 (RE = Tb, Eu) halide double perovskite nanocrystals with multicolor emissions for anticounterfeiting and LED applications†
Yao
Li‡
ab,
Qingxing
Yang‡
ab,
Huwei
Li
ac,
Xinyu
Fu
ab,
Hongxia
Yue
ab,
Zheyu
Li
ab,
Jing
Feng
 *ab and
Hongjie
Zhang
*abd
*ab and
Hongjie
Zhang
*abd
aState Key Laboratory of Rare Earth Resource Utilization, Changchun Institute of Applied Chemistry, Chinese Academy of Sciences, Changchun 130022, China. E-mail: fengj@ciac.ac.cn; hongjie@ciac.ac.cn
bSchool of Applied Chemistry and Engineering, University of Science and Technology of China, Hefei 230026, China
cState Key Laboratory of Inorganic Synthesis and Preparative Chemistry, College of Chemistry, Jilin University, Changchun 130012, China
dDepartment of Chemistry, Tsinghua University, Beijing 100084, China
First published on 1st July 2024
Abstract
Metal halide double perovskites are a promising alternative to lead-based perovskites. Especially, rare earth (RE)-based halide double perovskites have attracted much attention due to their unique optical properties. As RE3+ ions could be served not only as the component of the matrix but also as the luminescence centers, the chemical composition of RE-based halide double perovskites can be simplified and tunable luminescence could be achieved. In this work, Cs2NaRECl6 (RE = Tb, Eu) halide double perovskite nanocrystals were synthesized by the hot injection method. Cs2NaRECl6 nanocrystals exhibit not only the intrinsic host emission but also the characteristic emissions of RE3+ ions. Furthermore, the excitation-wavelength-dependent multicolor emissions of Cs2NaRECl6 nanocrystals make them highly potential for anticounterfeiting applications. Multicolor LED devices based on various components of Cs2NaRECl6 could be obtained, providing promising candidates for optoelectronic applications.
Introduction
Metal halide perovskite CsPbX3 (X = Cl, Br, I) nanocrystals (NCs) have attracted considerable attention due to their attractive optoelectronic features such as their narrow and tunable emission,1 high photoluminescence quantum yields (PLQYs),2 direct band gaps,3 and high charge carrier mobilities.4,5 However, the undesirable stability of CsPbX3 NCs and the inherent toxicity of lead ions have seriously hindered their practical applications.6 Therefore, it is significant to design and synthesize lead-free halide perovskites with excellent optoelectronic properties and outstanding stability. The double perovskite Cs2BIBIIIX6, which consists of one monovalent cation (B+) and one trivalent cation (B3+), has great freedom in the composition of B-site metal ions.7 In addition, the three-dimensional structure of Cs2BIBIIIX6 is similar to that of CsPbX3, making it an acceptable substitute for lead-based perovskites.7 The energy band structures and optoelectronic properties of the double perovskites could be effectively regulated by adjusting the element composition, which has attracted extensive attention.8–14Trivalent rare earth ions (RE3+) with unique electronic configurations could produce intense photoluminescence (PL) covering ultraviolet (UV) and visible to near-infrared (NIR) range, which is the important component of various luminescent materials.15–18 The octahedral coordination environment and the valence state of B3+ cations in double perovskites provide the feasibility for the introduction of RE3+ ions.19–22 For example, Yb3+ and Er3+ ions are doped in the double perovskites to produce NIR emissions.22 Similarly, Cs2AgInCl6 NCs doped with Yb3+ ions exhibit a broadband host emission at 607 nm and NIR emission of Yb3+ ions at 996 nm. Er3+ ions doped in Cs2AgInCl6 NCs undergo the energy transition of 4I13/2 → 4I15/2 and emit the NIR emission at 1537 nm under 300 nm excitation.23 For RE3+ ion-doped halide double perovskites, the PL properties are greatly affected by the ratio of dopants. Generally, exploring the optimal ratio is laborious and time-consuming.24 For RE-based halide double perovskites, RE3+ ions can be served not only as the component of the matrix but also as the luminescence centers by selecting the appropriate RE3+ ions. Therefore, the chemical composition can be simplified and interference from other dopants can be minimized. At present, RE-based halide double perovskites mainly include single crystals25–28 and NCs.29,30 The colloidal synthesis of RE-based halide double perovskite NCs could potentially provide good uniformity and tunable morphology,31 which has been inadequately investigated. Therefore, it is of great significance to develop RE-based halide double perovskite NCs and investigate their PL performances.
Herein, Cs2NaRECl6 (RE = Tb, Eu) halide double perovskite NCs were fabricated through a hot injection method. Cs2NaRECl6 (RE = Tb, Eu) NCs could exhibit not only intrinsic host emission but also the characteristic emissions of Tb3+ or Eu3+ ions under UV light excitation. Especially, Cs2NaRECl6 (RE = Tb, Eu) NCs could exhibit multicolor emissions under different light excitation, showing great potential in anticounterfeiting. The proof-of-concept of anticounterfeiting pattern, figure, and QR code made of Cs2NaRECl6 (RE = Tb, Tb0.5Eu0.5, Eu) NCs were further performed. Furthermore, based on various components of Cs2NaRECl6 (RE = Tb, Eu) NCs, multicolor LED devices were fabricated, suggesting the potential in the optoelectronic field.
Experimental section
Materials
Europium acetate hydrate (Eu(CH3CO2)3·xH2O, 99.99%), terbium acetate hydrate (Tb(CH3CO2)3·xH2O, 99.99%) were purchased from Sigma-Aldrich. 1-Octadecene (ODE, 90%), oleic acid (OA, 90%), oleylamine (OAm, 90%), chlorotrimethylsilane (TMSCl, 99%), sodium acetate (CH3COONa, 99.99%), and cesium carbonate (Cs2CO3, 99.99%) were purchased from Aladdin Reagent Co., Ltd (Shanghai, China). Cyclohexane (99.5%), and ethyl acetate (99.5%) were purchased from Xilong Scientific Co., Ltd (Guangdong, China). All chemicals were obtained from commercial suppliers and used without further purification. The LED chips were purchased from Shenzhen Looking Long Technology Co., Ltd.Synthesis of Cs2NaRECl6 (RE = Tb, Eu) NCs
Eu(CH3CO2)3·xH2O (0.5 mmol) or Tb(CH3CO2)3·xH2O (0.5 mmol), Cs2CO3 (0.115 g), CH3COONa (0.025 g), ODE (10 mL), OAm (0.8 mL), and OA (3.2 mL) were added into a 100 mL three-neck flask, dried under vacuum for 1 h at 120 °C, and then heated at 180 °C under N2. Subsequently, TMSCl (0.6 mL) was swiftly injected, and after 5 min, the solution was cooled in an ice bath.Synthesis of Cs2NaTb0.5Eu0.5Cl6 NCs
For Cs2NaTb0.5Eu0.5Cl6 NCs, the same synthesis process as the preparation of Cs2NaRECl6 NCs was adopted, except that 0.5 mmol Eu(CH3CO2)3·xH2O or Tb(CH3CO2)3·xH2O was replaced with 0.25 mmol Eu(CH3CO2)3·xH2O and 0.25 mmol Tb(CH3CO2)3·xH2O.Purification of Cs2NaRECl6 (RE = Tb, Eu) NCs
The crude solution was centrifuged at 9500 rpm for 8 min, and the supernatant was discarded. The precipitation was then dispersed in 4 mL of cyclohexane and centrifuged at 9500 rpm for 8 min. Then, the precipitation was dispersed in 4 mL of cyclohexane for subsequent characterizations. To obtain the solids of Cs2NaRECl6, the dispersive solution was mixed with 6 mL of ethyl acetate, and centrifuged at 10![[thin space (1/6-em)]](https://www.rsc.org/images/entities/char_2009.gif) 000 rpm for 10 min to precipitate Cs2NaRECl6 NCs.
000 rpm for 10 min to precipitate Cs2NaRECl6 NCs.
Characterizations
The phase formation was analyzed by using an X-ray diffractometer (D8 Advance, Bruker AXS, Germany) equipped with a ceramic X-ray tube Cu Kα radiation source (λ = 0.15405 nm) at a scanning rate of 4° min−1 in the 2θ range from 10° to 60°. X-Ray photoelectron spectroscopy (XPS) was conducted using a Thermo Fisher Scientific-ESCALAB 250Xi. UV-visible (UV-vis) absorption spectra were recorded using a Shimadzu 3600i plus UV-vis spectrophotometer. The PLQYs were gained directly by the absolute PLQY measurement system (C9920-02, Hamamatsu Photonics K. K., Japan). The composition of the samples was studied using a field-emission scanning electron microscope (FE-SEM, S-4800, Hitachi) equipped with an EDX spectrometer. Transmission electron microscopy (TEM), high angle annular dark field scanning TEM (HAADFSTEM), and elemental mapping measurements were carried out using an FEI Tecnai G2S-Twin instrument with a field emission gun operating at 200 kV. The PL spectra were recorded on an Edinburgh Instruments FLS 920 fluorescence spectrometer equipped with a 450 W xenon lamp as the excitation source at room temperature. The temperature-dependent PL spectra were also measured using a fluorescence spectrometer equipped with a xenon lamp as the excitation source (Edinburgh Instruments FLS 920) and a temperature controller (INSTEC temperature controller, American Instec). The fluorescent decay curves were obtained using a Lecroy Wave Runner 6100 Digital Oscilloscope (1 GHz) taking a tunable laser (pulse width = 4 ns, gate = 50 ns) as the excitation source (Continuum Sunlite OPO). The PL decay curves were fitted with an exponential decay function, as expressed: . The average PL lifetime could be calculated by using
  . Ai represents constant, τi is the decay time for the exponential component, I0 and I(t) are PL intensities at time 0 and t, respectively.
Results and discussion
RE-based Cs2NaRECl6 (RE = Tb, Eu) double perovskite NCs were prepared by the hot injection method with post-injection of halides. Cs2NaRECl6 NCs possess cubic crystal structure and belong to the Fm![[3 with combining macron]](https://www.rsc.org/images/entities/char_0033_0304.gif) m space group. The crystal structure of Cs2NaRECl6 is composed of alternating arrangement of [NaCl6]5− and [RECl6]3− octahedra, with Cs+ ions located in the cavity of the octahedra (Fig. 1a). As shown in Fig. 1b, the X-ray diffraction (XRD) pattern of Cs2NaTbCl6 NCs is consistent with the standard card ICSD-96062 without other impurities. The XRD pattern of Cs2NaEuCl6 NCs is similar to that of Cs2NaTbCl6, and the diffraction peaks of each crystal plane slightly shift to the lower angle compared with those of Cs2NaTbCl6, which is attributed to the fact that the lattice constant of Cs2NaEuCl6 (aEu = 10.8095 Å) is larger than that of Cs2NaTbCl6 (aTb = 10.7636 Å). The transmission electron microscopy (TEM) and the high-resolution TEM (HR-TEM) images of Cs2NaRECl6 double perovskite NCs are shown in Fig. 1c–f. The size distribution histograms of Cs2NaRECl6 NCs are shown in Fig. S1 (ESI†). It could be seen that Cs2NaRECl6 NCs show regular cubic morphology with a size of 14–18 nm. The lattice fringes with the lattice spacing of 2.69 Å for Cs2NaTbCl6 NCs and 2.73 Å for Cs2NaEuCl6 NCs, corresponding to the (400) crystal plane, are consistent with XRD results. Cs2NaRECl6 NCs were further characterized using X-ray photoelectron spectroscopy (XPS) to detect the valence state of RE ions (Fig. S2, ESI†). In Fig. S2b (ESI†), the binding energies of 1242.05 eV and 1276.41 eV correspond to Tb3+ 3d5/2 and Tb3+ 3d3/2, respectively, proving the valence state of terbium in Cs2NaTbCl6 is trivalent. In Fig. S2d (ESI†), the peaks of 1135.29 eV and 1164.70 eV are assigned to Eu3+ 3d5/2 and Eu3+ 3d3/2, respectively. The peaks at 1125.20 eV and 1154.80 eV are attributed to Eu2+ 3d5/2 and Eu2+ 3d3/2, respectively. These results reveal that Eu3+ and Eu2+ exist in Cs2NaEuCl6. The existence of Eu2+ may result from the reduction of partial Eu3+ to Eu2+ by OAm or the trace impurity originating from raw reagents. Scanning transmission electron microscopy–energy dispersive X-ray spectroscopy (STEM-EDS) element mappings of Cs2NaRECl6 are shown in Fig. S3 and S4 (ESI†). The result exhibits the homogeneous distribution of Cs, Na, RE (RE = Tb, Eu), and Cl elements in Cs2NaRECl6 NCs. The energy dispersive X-ray (EDX) images also confirm the composition of Cs, Na, Tb (or Eu), and Cl elements in Cs2NaRECl6 (RE = Tb, Eu) NCs (Fig. S5, ESI†).
m space group. The crystal structure of Cs2NaRECl6 is composed of alternating arrangement of [NaCl6]5− and [RECl6]3− octahedra, with Cs+ ions located in the cavity of the octahedra (Fig. 1a). As shown in Fig. 1b, the X-ray diffraction (XRD) pattern of Cs2NaTbCl6 NCs is consistent with the standard card ICSD-96062 without other impurities. The XRD pattern of Cs2NaEuCl6 NCs is similar to that of Cs2NaTbCl6, and the diffraction peaks of each crystal plane slightly shift to the lower angle compared with those of Cs2NaTbCl6, which is attributed to the fact that the lattice constant of Cs2NaEuCl6 (aEu = 10.8095 Å) is larger than that of Cs2NaTbCl6 (aTb = 10.7636 Å). The transmission electron microscopy (TEM) and the high-resolution TEM (HR-TEM) images of Cs2NaRECl6 double perovskite NCs are shown in Fig. 1c–f. The size distribution histograms of Cs2NaRECl6 NCs are shown in Fig. S1 (ESI†). It could be seen that Cs2NaRECl6 NCs show regular cubic morphology with a size of 14–18 nm. The lattice fringes with the lattice spacing of 2.69 Å for Cs2NaTbCl6 NCs and 2.73 Å for Cs2NaEuCl6 NCs, corresponding to the (400) crystal plane, are consistent with XRD results. Cs2NaRECl6 NCs were further characterized using X-ray photoelectron spectroscopy (XPS) to detect the valence state of RE ions (Fig. S2, ESI†). In Fig. S2b (ESI†), the binding energies of 1242.05 eV and 1276.41 eV correspond to Tb3+ 3d5/2 and Tb3+ 3d3/2, respectively, proving the valence state of terbium in Cs2NaTbCl6 is trivalent. In Fig. S2d (ESI†), the peaks of 1135.29 eV and 1164.70 eV are assigned to Eu3+ 3d5/2 and Eu3+ 3d3/2, respectively. The peaks at 1125.20 eV and 1154.80 eV are attributed to Eu2+ 3d5/2 and Eu2+ 3d3/2, respectively. These results reveal that Eu3+ and Eu2+ exist in Cs2NaEuCl6. The existence of Eu2+ may result from the reduction of partial Eu3+ to Eu2+ by OAm or the trace impurity originating from raw reagents. Scanning transmission electron microscopy–energy dispersive X-ray spectroscopy (STEM-EDS) element mappings of Cs2NaRECl6 are shown in Fig. S3 and S4 (ESI†). The result exhibits the homogeneous distribution of Cs, Na, RE (RE = Tb, Eu), and Cl elements in Cs2NaRECl6 NCs. The energy dispersive X-ray (EDX) images also confirm the composition of Cs, Na, Tb (or Eu), and Cl elements in Cs2NaRECl6 (RE = Tb, Eu) NCs (Fig. S5, ESI†).
 | ||
| Fig. 1 (a) Crystal structure and (b) XRD patterns of Cs2NaRECl6 (RE = Tb, Eu) NCs. TEM and HR-TEM images of (c) and (d) Cs2NaTbCl6 and (e) and (f) Cs2NaEuCl6 NCs. | ||
The PL excitation (PLE) and PL spectra of Cs2NaRECl6 (RE = Tb, Eu) NCs are shown in Fig. 2. Under the excitation of 360 nm, multiple emission peaks of Cs2NaTbCl6 NCs appear, including the host emission peak centered at 430 nm and the emission peaks of Tb3+ ions. Specifically, the PL intensity of Tb3+ ions at 548 nm is higher than that of the host emission in Cs2NaTbCl6 NCs. In addition, the emission peak of Tb3+ ions at 490 nm partially overlaps with the host emission of Cs2NaTbCl6 NCs (Fig. 2a). As shown in Fig. 2b, the PLE spectrum of Cs2NaTbCl6 NCs monitored at 548 nm consists of several excitation peaks, with the narrow main peak at 279 nm. The main excitation peak is assigned to the 4f8 → 4f75d1 transition of Tb3+. This transition could also be seen in the absorption spectrum (Fig. S6, ESI†). The PL spectrum exhibits the characteristic emissions of Tb3+ ions under the excitation of 279 nm at 490, 548, 584, and 621 nm, which are assigned to the 5D4 → 7FJ (J = 6–3) transitions in the f-orbitals of Tb3+ ions, respectively. The host emission of Cs2NaTbCl6 NCs is annihilated. Cs2NaTbCl6 NCs exhibit PLQYs of 13.9% and 15.3% under 360 and 279 nm excitation, respectively. In addition, the time-resolved PL decay curves of Cs2NaTbCl6 NCs are displayed in Fig. S7 (ESI†). The PL decay curve of the host emission (430 nm) could be fitted by a multiexponential function with an average decay lifetime of 4.76 ns, and the decay pathway may be attributed to carrier trap, charge recombination, and trap-state-associated decay.32 Furthermore, the PL lifetime of Tb3+ ions emission was found to be 2.78 ms, which is attributed to the spin-forbidden f–f transitions in Tb3+ ions.33
 | ||
| Fig. 2 PLE and PL spectra of Cs2NaTbCl6 NCs: (a) λem = 430 nm, λex = 360 nm, (b) λem = 548 nm, λex = 279 nm. PLE and PL spectra of Cs2NaEuCl6 NCs: (c) λem = 430 nm, λex = 360 nm, and (d) λem = 593 nm, λex = 330 nm. | ||
The PL spectra of Cs2NaEuCl6 NCs also consist of multiple emission peaks, including the host emission of Cs2NaEuCl6 and the characteristic emissions of Eu3+ ions. The PLE spectrum of Cs2NaEuCl6 NCs monitored at 430 nm consists of a single-peak curve located at 360 nm. It could be seen that the PL intensity of the host emission is higher than that of the Eu3+ ion under 360 nm excitation (Fig. 2c). For the emissions of Eu3+ ions, several narrow emission peaks located at 593, 616, 656 and 699 nm can be assigned to characteristic Eu3+ electronic transitions associated with 5D0 → 7FJ (J = 1–4) transitions, respectively. The PLE spectrum of Cs2NaEuCl6 NCs (λem = 593 nm) consists of a broad band (330 nm) and two sharp peaks (362 nm and 381 nm), which originate from the charge transfer band within [EuCl6]3− octahedra and f–f transitions of Eu3+, respectively (Fig. 2d). The charge transfer band could be seen in the absorption spectrum (Fig. S6, ESI†).
The PLQYs of Cs2NaEuCl6 NCs are 10.4% and 5.3% under 360 and 330 nm excitation, respectively. The PL lifetime of the host emission of Cs2NaEuCl6 NCs is 3.56 ns, and the decay pathway is similar to that of Cs2NaTbCl6 NCs. For the emission of Eu3+ ions, PL lifetime was measured to be 2.84 ms, which is assigned to the spin-prohibited f–f transitions in Eu3+ ions (Fig. S8, ESI†). Based on the above PL results, the PL mechanism may be that Cs2NaRECl6 NCs emit a broad host emission centered at 430 nm under the excitation of 360 nm, and transfer part of the energy to RE3+ ions, resulting in the characteristic emissions of RE3+ ions (Fig. S9, ESI†).34
To further understand the PL properties, the temperature-dependent PL measurements of Cs2NaRECl6 (RE = Tb, Eu) NCs were conducted. Fig. 3a shows the PL spectra of Cs2NaTbCl6 NCs in the temperature range of 100–300 K under 360 nm excitation. The PL intensity of Cs2NaTbCl6 NCs decreases with the increase in temperature, which is caused by the thermal quenching effect. The PL intensity of Cs2NaTbCl6 NCs does not diminish drastically during the initial temperature increase and could maintain comparatively high PL intensity at relatively high temperatures, indicating that the synthesized Cs2NaTbCl6 NCs have good stability. Fig. 3b visualizes the change in PL intensity of Cs2NaTbCl6 NCs throughout the heating process. Cs2NaTbCl6 NCs show intense host emission until 240 K, and then the PL intensity appears to decrease substantially in the temperature range of 240–300 K. The narrow-band emissions of Tb3+ ions maintain distinctly throughout the heating process and undergo a substantial emission decay as the temperature increases (Fig. 3c). In addition, the peak position of host emission changes slightly throughout the heating process, while the peak positions of Tb3+ ion emissions do not change (Fig. S10, ESI†). Under the excitation of 279 nm, the PL spectrum of Cs2NaTbCl6 NCs mainly exhibits Tb3+ ion emissions in the temperature range of 100–300 K (Fig. 3d). Tb3+ ion emissions of Cs2NaTbCl6 NCs presents narrow linear shape, indicating that the full width at half maximum (FWHM) does not change distinctly and Cs2NaTbCl6 NCs can maintain good structural stability as the temperature increase. Similarly, as the temperature increases from 100 to 300 K, the change in PL intensity of different emissions of Cs2NaTbCl6 NCs under 279 nm excitation was statistically analyzed (Fig. 3e). The PL intensity of Tb3+ emissions decreases slowly in the range of 100–260 K, and could maintain 55.7% of the initial intensity at 300 K (Fig. 3f). Moreover, the position of Tb3+ ion emission centered at 548 nm remains constant (Fig. S11, ESI†).
 | ||
| Fig. 3 (a) Temperature-dependent PL spectra, (b) pseudo-color mapping, and (c) normalized PL intensity changes of Cs2NaTbCl6 NCs under 360 nm excitation from 100–300 K (blue: host emission, green: Tb3+ ions emission). (d) Temperature-dependent PL spectra, (e) pseudo-color mapping, and (f) normalized PL intensity changes of Cs2NaTbCl6 NCs under 279 nm excitation from 100–300 K (blue: host emission, green: Tb3+ ions emission). | ||
Subsequently, the temperature-dependent PL spectra of Cs2NaEuCl6 NCs were recorded. Under 360 nm excitation, the PL spectrum of Cs2NaEuCl6 NCs is dominated by the host emission with relatively weak Eu3+ ion emissions. Fig. 4a presents the PL variation of Cs2NaEuCl6 NCs in the temperature range of 100–300 K. As the temperature increases from 100 to 240 K, the host emission of Cs2NaEuCl6 NCs can maintain high PL intensity and the emission peak does not change significantly, indicating the good stability of the Cs2NaEuCl6 matrix (Fig. S12, ESI†). The PL intensity of the host emission appears to be significantly decreased and the peak position red-shifts in the range of 240–300 K. Compared with the host emission, the PL intensity of Eu3+ emissions decreases continuously during the heating process with a larger fluorescence loss (Fig. 4b). The PL intensity of the host emission reduces to 41% of the initial intensity, while the PL intensity of Eu3+ ions exhibits only 17.6% of the initial intensity after the same heating process (Fig. 4c). As exhibited in Fig. 4d, the temperature-dependent PL spectra (100–300 K) of Cs2NaEuCl6 NCs under 330 nm excitation are mainly composed of intense Eu3+ ions emissions and relative weak host emission. With the increasing temperature, the PL intensity of both the host emission and Eu3+ ions emission of Cs2NaEuCl6 NCs show a stepwise decrease, and the decrease rate of the host emission is smaller than that of Eu3+ ions emission (Fig. 4e). When the temperature increases to 300 K, the PL intensity of Eu3+ ions emission greatly weakens to 14.2% of the initial intensity (Fig. 4f), and the peak position of Eu3+ ions emission is always located at 593 nm (Fig. S13, ESI†).
 | ||
| Fig. 4 (a) Temperature-dependent PL spectra, (b) pseudo-color mapping, and (c) normalized PL intensity changes of Cs2NaEuCl6 NCs under 360 nm excitation from 100–300 K (blue: host emission, red: Eu3+ ions emission). (d) Temperature-dependent PL spectra, (e) pseudo-color mapping, and (f) normalized PL intensity changes of Cs2NaEuCl6 NCs under 330 nm excitation from 100–300 K (blue: host emission, red: Eu3+ ions emission). | ||
The PL of RE-based Cs2NaRECl6 (RE = Tb, Eu) NCs consists of both host emission and RE3+ ion emission, and there is an apparent difference in the PLE wavelength of the two PL compositions. Consequently, the PL spectra of Cs2NaRECl6 NCs were recorded under successive changes of excitation wavelength, as shown in Fig. 5. Under the excitation in the range of 260–300 nm, Cs2NaTbCl6 NCs exhibit characteristic green emissions of Tb3+ ions accompanied by changes in PL intensity (Fig. 5a). In the excitation range of 300–370 nm, the host PL intensity of Cs2NaTbCl6 NCs increases continuously. Subsequently, the PL color of Cs2NaTbCl6 NCs changes with the excitation wavelength (Fig. 5b). As shown in Fig. 5c, under 280 nm excitation, Cs2NaTbCl6 NCs show green emission with Commission Internationale de L'Eclairage (CIE) color coordinates of (0.301, 0.577), while under 370 nm excitation, Cs2NaTbCl6 NCs exhibit blue emission with CIE color coordinates of (0.167, 0.144). Analogously, Cs2NaEuCl6 NCs exhibit various emission colors under different excitation lights. Fig. 5d displays the PL spectra of Cs2NaEuCl6 NCs under the excitation from 300 to 370 nm. Under the short-wavelength light excitation, the PL spectra of Cs2NaEuCl6 NCs mainly exhibit characteristic emissions of Eu3+ ions. The host emission of Cs2NaEuCl6 NCs enhances with the increasing wavelength of the excitation light, while the PL intensity of Eu3+ ion emissions becomes weaker (Fig. 5e). Under 300 nm excitation, Cs2NaEuCl6 NCs show red luminescence with the CIE color coordinate of (0.610, 0.351). Under 370 nm light excitation, the PL of Cs2NaEuCl6 NCs turns blue with the CIE color coordinates of (0.195, 0.184). It is indicated that the PL color of Cs2NaEuCl6 NCs changes gradually from red to blue as the excitation wavelength varies from 300 to 370 nm (Fig. 5f). The above results demonstrate that Cs2NaRECl6 (RE = Tb, Eu) NCs can display multicolor emissions under different excitation light, which provides the possibility for anticounterfeiting application.
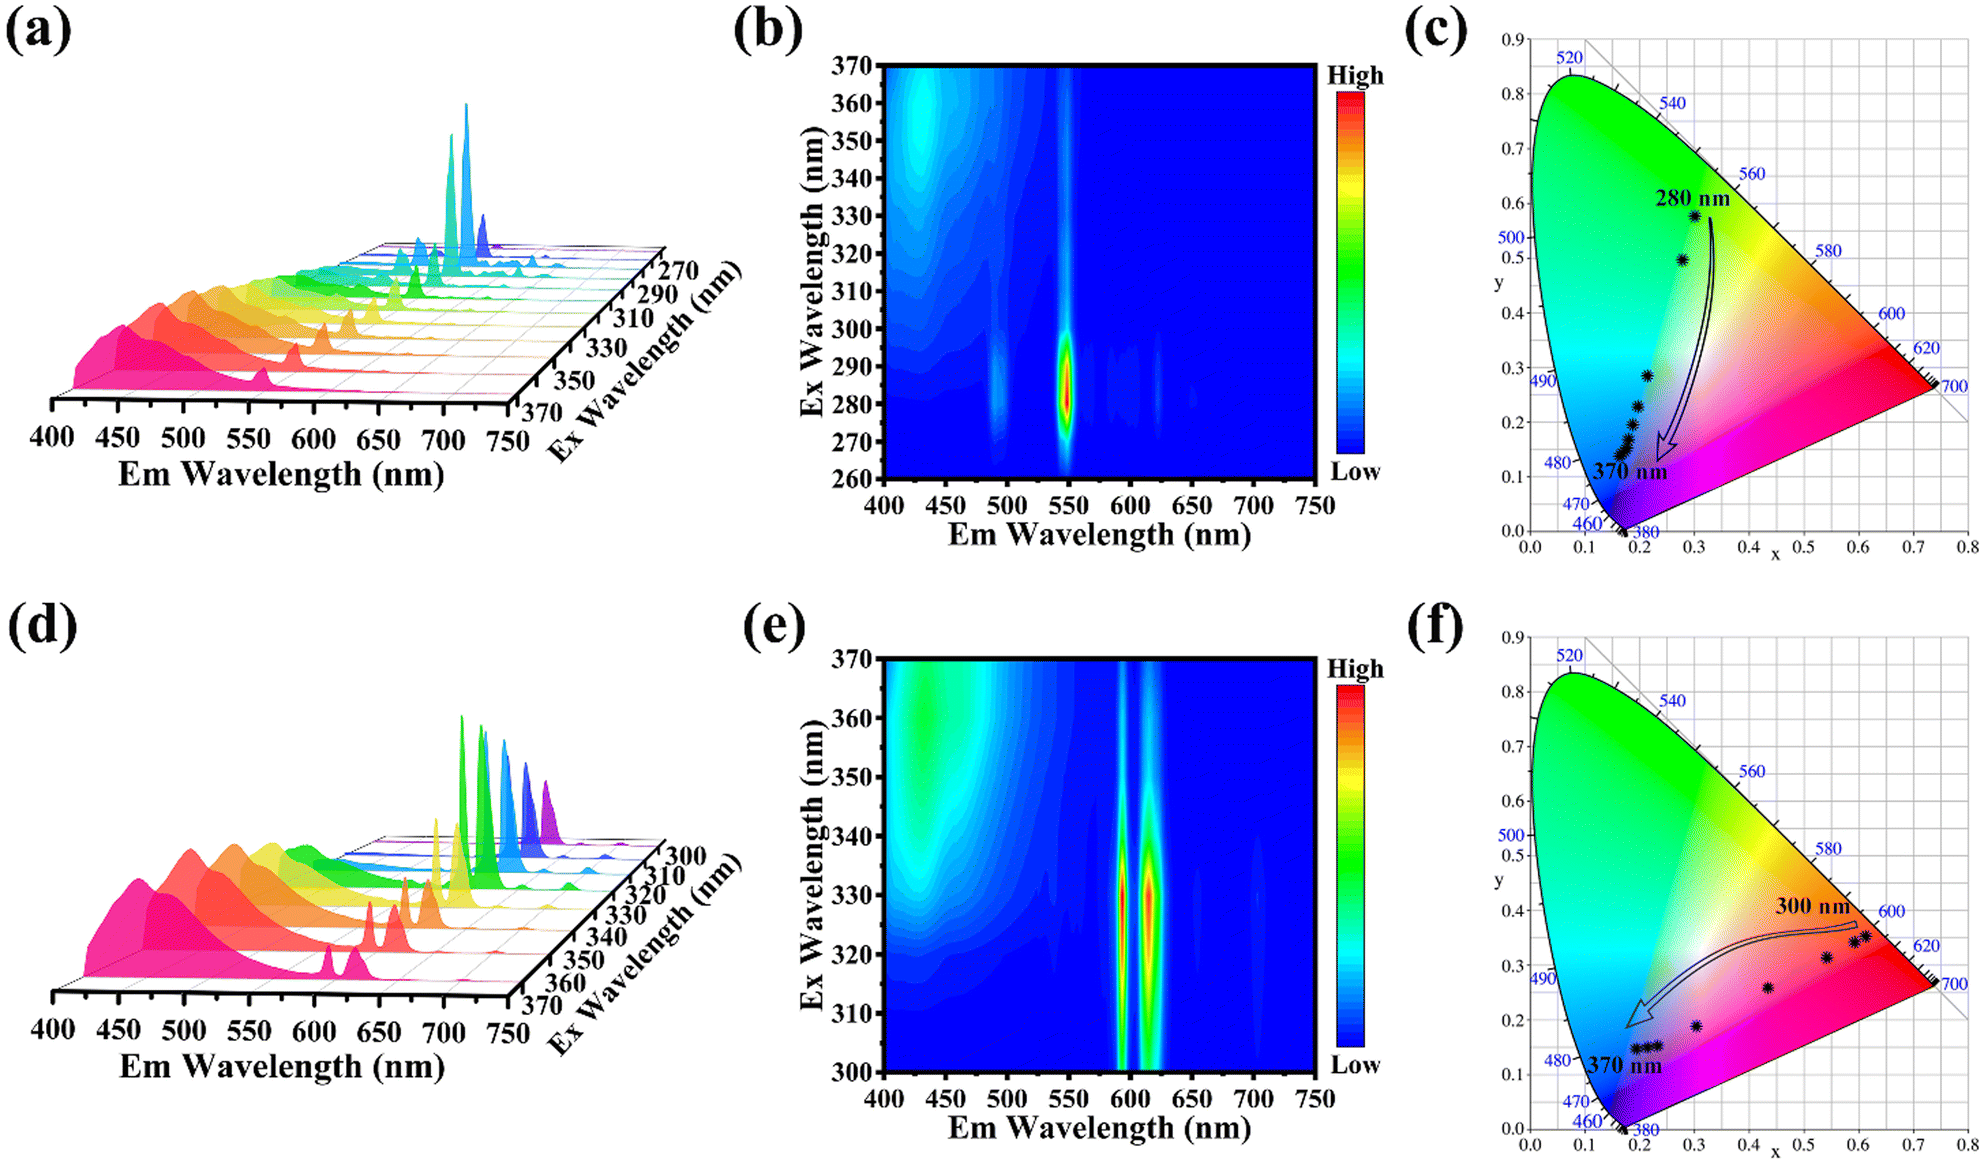 | ||
| Fig. 5 (a) PL spectra, (b) pseudo-color mapping, and (c) CIE color coordinate of Cs2NaTbCl6 NCs with varying excitation wavelengths from 260 to 370 nm. (d) PL spectra, (e) pseudo-color mapping, and (f) CIE color coordinate of Cs2NaEuCl6 NCs with varying excitation wavelengths from 300 to 370 nm. | ||
Based on the excitation-wavelength-dependent multicolor emission features of Cs2NaRECl6 (RE = Tb, Eu) NCs, the anticounterfeiting patterns were fabricated in combination with Cs2NaTb0.5Eu0.5Cl6 NCs to explore the anticounterfeiting performance of RE-based halide double perovskites. As presented in Fig. 6a, the leaf patterns filled with Cs2NaEuCl6, Cs2NaTb0.5Eu0.5Cl6, and Cs2NaTbCl6 NCs excited by 302 nm emit red, magenta, and green colors, and in contrast, under 365 nm light irradiation, the patterns show pink, bluish violet, and blue colors, respectively. To take advantage of the characteristics of Cs2NaRECl6, we also designed an anticounterfeiting pattern of digital alignment using Cs2NaEuCl6 NCs, Cs2NaTb0.5Eu0.5Cl6 NCs and Cs2NaTbCl6 NCs (Fig. 6b). We used Cs2NaEuCl6 NCs to fill the first number “8” and the vertical line on the top right of the second number “8”. The rest of the second number “8” is padded by Cs2NaTb0.5Eu0.5Cl6 NCs. The last number pattern is filled by Cs2NaTbCl6 NCs. The pattern exhibits two red numbers “8” and one green number “8” under 302 nm excitation. However, the middle number “8” of the digital alignment then turns to a number “6” and one pink vertical bar irradiated by 365 nm light. Finally, by filling Cs2NaTbCl6 NCs into the grooves of the QR code (Fig. 6c), the QR code can be identified to the information of “chemistry” by phone applications such as WeChat. It is suggested that Cs2NaRECl6 (RE = Tb, Eu) NCs have great potential for anticounterfeiting applications.
 | ||
| Fig. 6 (a) The photographs of leaf patterns made using Cs2NaRECl6 (RE = Tb, Tb0.5Eu0.5, and Eu) NCs. The patterns emit different PL color under 302 nm and 365 nm excitation. (b) The anticounterfeiting pattern of “888” number made of Cs2NaRECl6 (RE = Tb, Tb0.5Eu0.5, and Eu) NCs under 302 nm and 365 nm excitation. (c) Schematic diagram of the QR code made of Cs2NaTbCl6 for encryption and decryption. | ||
In addition, Cs2NaRECl6 NCs could serve as phosphors for fabricating LEDs. An orange-red LED device was fabricated by coating Cs2NaEuCl6 NCs on a commercial 310 nm chip (Fig. S14a, ESI†). The electroluminescence spectrum of the orange-red LED device mainly consists of the emission peaks of Eu3+ ions at 593 and 616 nm with the CIE color coordinate of (0.477, 0.366) and the correlated color temperature (CCT) is 2124 K. The green LED device was prepared by coating the chip with Cs2NaTbCl6 NCs (Fig. S14b, ESI†). The electroluminescence spectrum consists of Tb3+ ion emissions with the CIE color coordinate of (0.313, 0.440) and the correlated CCT is 6047 K. A warm-white LED device with CIE color coordinate of (0.396, 0.387) and CCT of 3694 K could be fabricated by mixing Cs2NaEuCl6 and Cs2NaTbCl6 NCs (Fig. S14c, ESI†). The LED devices fabricated using RE-based Cs2NaRECl6 (RE = Tb, Eu) NCs exhibit bright emission under 20 mA forward current, indicating that Cs2NaRECl6 (RE = Tb, Eu) NCs have great potential for LED applications.
Conclusions
RE-based Cs2NaRECl6 (RE = Tb, Eu) halide double perovskite NCs with uniform morphology were prepared by the hot injection method. Cs2NaRECl6 NCs could exhibit not only intrinsic host emission but also the characteristic emissions of RE3+ (RE = Tb, Eu). Cs2NaRECl6 NCs possess the excitation-wavelength-dependent multicolor emission features. The emitting color of Cs2NaTbCl6 NCs gradually changes from green to blue under 280–370 nm excitation, and the emitting color of Cs2NaEuCl6 NCs gradually changes from red to pink under the excitation of 300–370 nm light. Based on the multicolor emissions of Cs2NaRECl6 NCs, the patterns (leaf and digital alignment) and QR code were designed to verify their anticounterfeiting potential. Furthermore, orange-red, green and warm-white LED devices were fabricated, showing the great potential of Cs2NaRECl6 NCs in optoelectronic applications.Author contributions
Y. L., Q. X. Y., H. W. L., J. F., and H. J. Z. designed the experiments, interpreted the data, and co-wrote the manuscript. Y. L and Q. X. Y. carried out the syntheses, characterization studies, and data analyses. H. W. L. participated in the measurement and data analyses. X. Y. F., H. X. Y., and Z. Y. L. gave suggestions on writing the manuscript. J. F. and H. J. Z. discussed the results and commented on the manuscript.Data availability
The data that support the findings of this study are available from the corresponding author upon reasonable request.Conflicts of interest
There are no conflicts to declare.Acknowledgements
This work was supported by financial aid from the National Natural Science Foundation of China (22271273), and the International Partnership Program of the Chinese Academy of Sciences (121522KYSB20190022).References
- L. Protesescu, S. Yakunin, M. I. Bodnarchuk, F. Krieg, R. Caputo, C. H. Hendon, R. X. Yang, A. Walsh and M. V. Kovalenko, Nano Lett., 2015, 15, 3692–3696 CrossRef CAS.
- A. Dutta, R. K. Behera, P. Pal, S. Baitalik and N. Pradhan, Angew. Chem., Int. Ed., 2019, 58, 5552–5556 Search PubMed.
- M. Chen, Y. Zou, L. Wu, Q. Pan, D. Yang, H. Hu, Y. Tan, Q. Zhong, Y. Xu, H. Liu, B. Sun and Q. Zhang, Adv. Funct. Mater., 2017, 27, 1701121 CrossRef.
- S. Song, Y. Lv, B. Cao and W. Wang, Adv. Funct. Mater., 2023, 33, 2300493 CrossRef CAS.
- X. Li, Y. Wu, S. Zhang, B. Cai, Y. Gu, J. Song and H. Zeng, Adv. Funct. Mater., 2016, 26, 2435–2445 CrossRef CAS.
- Y. Wei, Z. Cheng and J. Lin, Chem. Soc. Rev., 2019, 48, 310–350 RSC.
- F. Igbari, Z.-K. Wang and L.-S. Liao, Adv. Energy Mater., 2019, 9, 1803150 CrossRef.
- S. Wu and Y. Liu, Nano Res., 2023, 16, 5572–5591 CrossRef.
- J. Li, J. Xiao, T. Lin, Z. Yan and X. Han, J. Mater. Chem. C, 2022, 10, 7626–7632 RSC.
- R. S. Lamba, S. Kumar, P. Dhankhar, P. Yadav, S. Khurana, V. Jha, S. Singh, A. Konur and S. Sapra, J. Mater. Chem. C, 2024, 12, 4792–4799 RSC.
- C. Su, Z. Zhang, J. Yao, M. Chen, P. Huang, Y. Zhang, D. Fu and L. Xie, Chin. Chem. Lett., 2023, 34, 107442 CrossRef CAS.
- S. Wang, Y. Xie, W. Jiang, B. Liu, K. Shi and K. Pan, Chin. Chem. Lett., 2024, 35, 108521 CrossRef CAS.
- J. Luo, X. Wang, S. Li, J. Liu, Y. Guo, G. Niu, L. Yao, Y. Fu, L. Gao, Q. Dong, C. Zhao, M. Leng, F. Ma, W. Liang, L. Wang, S. Jin, J. Han, L. Zhang, J. Etheridge, J. Wang, Y. Yan, E. H. Sargent and J. Tang, Nature, 2018, 563, 541–545 CrossRef CAS PubMed.
- H. Yang, X. Chen, Y. Chu, C. Sun, H. Lu, M. Yuan, Y. Zhang, G. Long, L. Zhang and X. Li, Light: Sci. Appl., 2023, 12, 75 Search PubMed.
- H. Zhang, Z. Zeng, X. Shi and Y. Du, Nanoscale, 2021, 13, 13976–13994 RSC.
- Y. Zhu, J. Zhu, H. Song, J. Huang, Z. Lu and G. Pan, J. Rare Earths, 2021, 39, 374–379 CrossRef CAS.
- Y. Yu, G. Shao, L. Ding, H. Zhang, X. Liang, J. Liu and W. Xiang, J. Rare Earths, 2021, 39, 1497–1505 CrossRef CAS.
- R. Sun, D. Zhou, Y. Ding, Y. Wang, Y. Wang, X. Zhuang, S. Liu, N. Ding, T. Wang, W. Xu and H. Song, Light: Sci. Appl., 2022, 11, 340 CrossRef CAS PubMed.
- C. Y. Wang, P. Liang, R. J. Xie, Y. Yao, P. Liu, Y. Yang, J. Hu, L. Shao, X. W. Sun, F. Kang and G. Wei, Chem. Mater., 2020, 32, 7814–7821 CrossRef CAS.
- Z. Zeng, B. Huang, X. Wang, L. Lu, Q. Lu, M. Sun, T. Wu, T. Ma, J. Xu, Y. Xu, S. Wang, Y. Du and C. H. Yan, Adv. Mater., 2020, 32, 2004506 CrossRef CAS PubMed.
- S. Li, Q. Hu, J. Luo, T. Jin, J. Liu, J. Li, Z. Tan, Y. Han, Z. Zheng, T. Zhai, H. Song, L. Gao, G. Niu and J. Tang, Adv. Opt. Mater., 2019, 7, 1901098 CrossRef CAS.
- H. Arfin, J. Kaur, T. Sheikh, S. Chakraborty and A. Nag, Angew. Chem., Int. Ed., 2020, 59, 11307–11311 CrossRef CAS PubMed.
- W. Lee, S. Hong and S. Kim, J. Phys. Chem. C, 2019, 123, 2665–2672 CrossRef CAS.
- W. Zhou, Y. Yu, P. Han, C. Li, T. Wu, Z. Ding, R. Liu, R. Zhang, C. Luo, H. Li, K. Zhao, K. Han and R. Lu, Adv. Mater., 2024, 36, 2302140 CrossRef CAS PubMed.
- Z. Rao, M. Cao, Z. Chen, X. Zhao and X. Gong, Adv. Funct. Mater., 2024, 34, 2311568 Search PubMed.
- Y. Wang, P. Dang, L. Qiu, G. Zhang, D. Liu, Y. Wei, H. Lian, G. Li, Z. Cheng and J. Lin, Angew. Chem., Int. Ed., 2023, 62, e202311699 CrossRef CAS.
- G. Zhang, P. Dang, H. Lian, H. Xiao, Z. Cheng and J. Lin, Laser Photonics Rev., 2022, 16, 2200078 Search PubMed.
- Q. Hu, Z. Deng, M. Hu, A. Zhao, Y. Zhang, Z. Tan, G. Niu, H. Wu and J. Tang, Sci. China: Chem., 2018, 61, 1581–1586 CrossRef CAS.
- R. Wu, P. Han, D. Zheng, J. Zhang, S. Yang, Y. Zhao, X. Miao and K. Han, Laser Photonics Rev., 2021, 15, 2100218 CrossRef CAS.
- R. Zhang, Z. Wang, X. Xu, X. Mao, J. Xiong, Y. Yang and K. Han, Adv. Opt. Mater., 2021, 9, 2100689 CrossRef CAS.
- J. Huang, T. Lei, M. Siron, Y. Zhang, S. Yu, F. Seeler, A. Dehestani, L. N. Quan, K. Schierle-Arndt and P. Yang, Nano Lett., 2020, 20, 3734–3739 CrossRef CAS.
- M. Lee, H. Chung, S. V. Hong, H. Y. Woo, J.-Y. Chae, T. Y. Yoon, B. T. Diroll and T. Paik, Nanoscale, 2023, 15, 1513–1521 Search PubMed.
- P. Saghy, A. M. Brown, C. Chu, L. C. Dube, W. Zheng, J. R. Robinson and O. Chen, Adv. Opt. Mater., 2023, 11, 2300277 CrossRef CAS.
- L. Sun, B. Dong, J. Sun, Y. Wang, R. Sun, S. Hu, B. Zhou, W. Xu, X. Bai, L. Xu, D. Zhou and H. Song, Laser Photonics Rev., 2023, 17, 2300045 CrossRef CAS.
Footnotes |
| † Electronic supplementary information (ESI) available: [DETAILS]. See DOI: https://doi.org/10.1039/d4tc01697a |
| ‡ These authors contributed equally and should be regarded as co-first authors. |
| This journal is © The Royal Society of Chemistry 2024 |