
 Open Access Article
 This Open Access Article is licensed under a
 Creative Commons Attribution 3.0 Unported Licence
Greening two chemicals with one bio-alcohol: environmental and economic potential of dehydrogenation to hydrogen and acids†
Inga-Marie
Lahrsen
 ,
Eleonora
Bargiacchi
,
Johannes
Schilling
and
André
Bardow
*
,
Eleonora
Bargiacchi
,
Johannes
Schilling
and
André
Bardow
*
Energy and Process Systems Engineering, ETH Zürich, Tannenstrasse 3, 8092 Zürich, Switzerland. E-mail: abardow@ethz.ch
First published on 19th February 2025
Abstract
Biomass is a promising feedstock for reducing greenhouse gas emissions in the chemical industry. Biomass availability, however, is limited. Still, many bio-based processes focus on producing a single product. Thereby, valuable feedstock potential is often lost with undesired co-products. In this study, we assess the environmental and economic potential of bio-based multi-product systems and provide insights on the sustainability benefits of co-producing hydrogen and high-value acids from bio-alcohols compared to fossil and green alternatives. We select dehydrogenation as a promising early-stage technology for producing hydrogen and four co-product candidates: formic acid, acetic acid, lactic acid, and succinic acid. All investigated dehydrogenation multi-product systems show the potential to reduce climate impacts and to become profitable. A higher carbon tax can improve the economic potential. Acetic acid is the most promising co-product compared to both fossil and green benchmarks with potential benefits in various environmental impact categories. In contrast, co-producing lactic acid shows substantial trade-offs compared to the benchmark technologies. Expected eutrophication impacts associated with biomass use occur in all dehydrogenation routes. Our analysis highlights that multi-product systems can increase benefits compared to single-product systems from both environmental and economic perspectives.
1. Introduction
Transitioning the chemical industry to net-zero greenhouse gas (GHG) emissions is challenging due to its dependency on fossil feedstocks as carbon and energy sources.1 Replacing fossil carbon feedstocks with sustainable biomass feedstocks can reduce GHG emissions because biomass carbon uptake and release are carbon neutral in total.2 Therefore, biomass feedstock becomes more relevant in the chemical industry: in the European Union's bio-economy, the manufacture of bio-based chemicals, pharmaceuticals, plastic, and rubber shows the highest value-added annual growth3 (47% increase in 2008–2020) and employment increase (additional 86![[thin space (1/6-em)]](https://www.rsc.org/images/entities/char_2009.gif) 400 people employed in 2008–2020).4 However, biomass resources are limited. Therefore, an increasing biochemical production will likely compete with other sectors, such as fuel, food, and feed production for limited biomass resources.5
400 people employed in 2008–2020).4 However, biomass resources are limited. Therefore, an increasing biochemical production will likely compete with other sectors, such as fuel, food, and feed production for limited biomass resources.5
Thus, limited biomass resources call for responsible use in applications with the greatest potential to reduce environmental impacts. One promising approach to fully exploit the biomass potential is the co-production of several products.6 A particularly important co-product is green hydrogen, which is a potential sustainable feedstock for products in the chemical industry, e.g., ammonia and methanol,7 and the refining industry.8 Green hydrogen can be produced from biomass through thermochemical processes (e.g., gasification, pyrolysis,9 and steam reforming10), biological processes (dark fermentation and photo-fermentation11), and electrochemical processes.12–14 Several biomass-to-hydrogen processes are close to reaching commercialisation.15 However, thermochemical conversion and biological conversion emit undesirable GHG emissions as byproducts,15 and electrochemical conversion produces oxygen, which is often disregarded for further use.16 Consequently, the biomass feedstock potential remains partly unexploited. One attempt to improve feedstock exploitation is the production of several chemical products.
Recent publications highlight that co-producing hydrogen and high-value chemicals is feasible and beneficial: Bohnenkamp et al.17 show that Escherichia coli can anaerobically ferment glucose into hydrogen and ethyl acetate in lab-scale experiments concluding that co-production is promising for improving economic feasibility. Liu et al.18 lowered costs by increasing selectivity with improved Cu-catalysts for non-oxidative dehydrogenation of ethanol to hydrogen and acetaldehyde. Zhao et al.19 mention high-value acids, e.g., glucaric acid,20 and lactic acid21 as other possible co-products, besides hydrogen, from photocatalytic dehydrogenation of biomass. Wang et al.22 compare catalysts for dehydrogenation of glycerol to lactic acid and ethanol to acetaldehyde (a precursor in, e.g., acetic acid production). Shvalagin et al.23 co-produce acetal from the photocatalytic dehydrogenation of ethanol to acetaldehyde and hydrogen. The authors conclude that, despite immaturity, co-producing hydrogen with esters, aldehydes, or acids from biomass-derived alcohols is an interesting case study for investigating environmental co-production synergies. In particular, bio-acids are important bio-chemical products24,25 opening a promising pathway for environmental synergies from the co-production of hydrogen and bio-acids from bio-alcohols.
Typically, the environmental impacts of technologies are compared using life cycle assessment (LCA) to identify the best option. In hydrogen production, LCA studies showed that biomass-derived hydrogen reduces environmental impacts compared to grey hydrogen from coal gasification, steam methane reforming, auto-thermal reforming, or grid-mix-electricity powered electrolysis.26–29 In biochemical production, Liang et al.30 found GHG emission savings for 10 of 13 bio-chemicals with near-term market potential. The identified bio-chemicals can be produced, e.g., from sugar.31 While several publications27–33 show that biomass can produce green hydrogen and bio-chemical, the environmental impacts from co-producing hydrogen and bio-chemicals have not yet been investigated. Indeed, assessing an emerging technology's potential to reduce environmental impacts compared to industrial-scale benchmarks is challenging because the required data for a detailed LCA is usually unavailable.
To still assess emerging technologies, Meys et al.34 introduced the environmental potential methodology for low technology readiness level (TRL). The environmental potential methodology compares the ideal life cycle inventory (LCI) of the low TRL technology with the complete LCI of the industrial-scale benchmark. Consequently, the environmental impacts of the low TRL technology are underestimated, while the benchmark's environmental impacts include all real-life losses and inefficiencies. Thus, only a low TRL technology that shows environmental potential compared to the benchmark is worth studying in detail. In contrast, a low TRL technology should be discarded if even the ideal assessment shows no environmental potential compared to the benchmark.
In this study, we assess the environmental potential of co-producing hydrogen and high-value acids from bio-alcohols to identify promising dehydrogenation routes. We monitor burden shifts between impact categories since biomass use is often associated with elevated eutrophication and impacts on land use.35,36 Moreover, we calculate the economic potential that is aligned with the environmental potential to evaluate the profitability of the dehydrogenation routes.
2. The environmental and economic potential method for bio-alcohol dehydrogenation
In this section, we (i) introduce the environmental potential methodology for multi-product systems (section 2.1), (ii) select dehydrogenation routes for our case study (section 2.2), and (iii) set assumptions and system boundaries for the environmental potential methodology (section 2.3). Moreover, we (iv) formulate the economic potential to assess the profitability of the selected dehydrogenation routes (section 2.4).2.1. Applying the environmental potential to multi-product systems
The environmental potential initially proposed by Meys et al.34 identifies reliable low TRL technologies without environmental benefits compared to state-of-the-art production technologies. The methodology can compare any emerging low TRL technology with a minimum of available data to state-of-the-art technologies. The minimum available data for low TRL technology is used to model the ideal process. The ideal process has the minimum environmental impact possible. In the ideal process, the LCI only requires the feedstock mass flows and reaction enthalpy at standard conditions that can be assessed based on the stoichiometric chemical reaction at 100% yield. The environmental potential is the difference between the environmental impacts of the ideal low TRL technologies and an industrial-scale benchmark. A positive environmental potential indicates that the investigated low TRL technology has the potential to outperform the benchmark technology. A negative environmental potential indicates that the ideal low TRL technology already has greater environmental impacts than the benchmark and should, therefore, be discarded because the technology can never outperform the benchmark in real life.In theory, the environmental potential methodology can be applied to single-product and multi-product systems. However, the multi-product systems lead to a multi-functionality problem. In previous environmental potential assessments, co-products are credited with an avoided burden.34,37 In these studies, however, multi-product systems are not the focus: the functional unit in Meys et al.34 and Pillich et al.37 is the treatment of a fixed amount of plastic waste. Therefore, the common ground of comparison is the feedstock in the system and not the products. In the present study, however, we focus on the co-production of high-value chemicals from various feedstocks. Therefore, we reconsider the available methods to solve multi-functionality.
The ISO 14044 norm38 provides a hierarchy to overcome multi-functionality: (i) dividing the process into sub-processes, (ii) or expanding the system, (iii) allocation based on physical relationships, and (iv) allocation based on economic relationships. In this study, we consider multiple products stoichiometrically coupled through a single reaction. The coupling makes a division into sub-processes impossible. Therefore, we follow the ISO 14044 hierarchy and use system expansion to solve the multi-functionality problem: first, we aggregate all products in the multi-product system and regard it as a joint functional unit. Second, we expand the benchmark system to produce the same functional unit (Fig. 1). Third, we calculate the environmental potential with the multi-product system and the combined benchmark system as described in section 2.3.
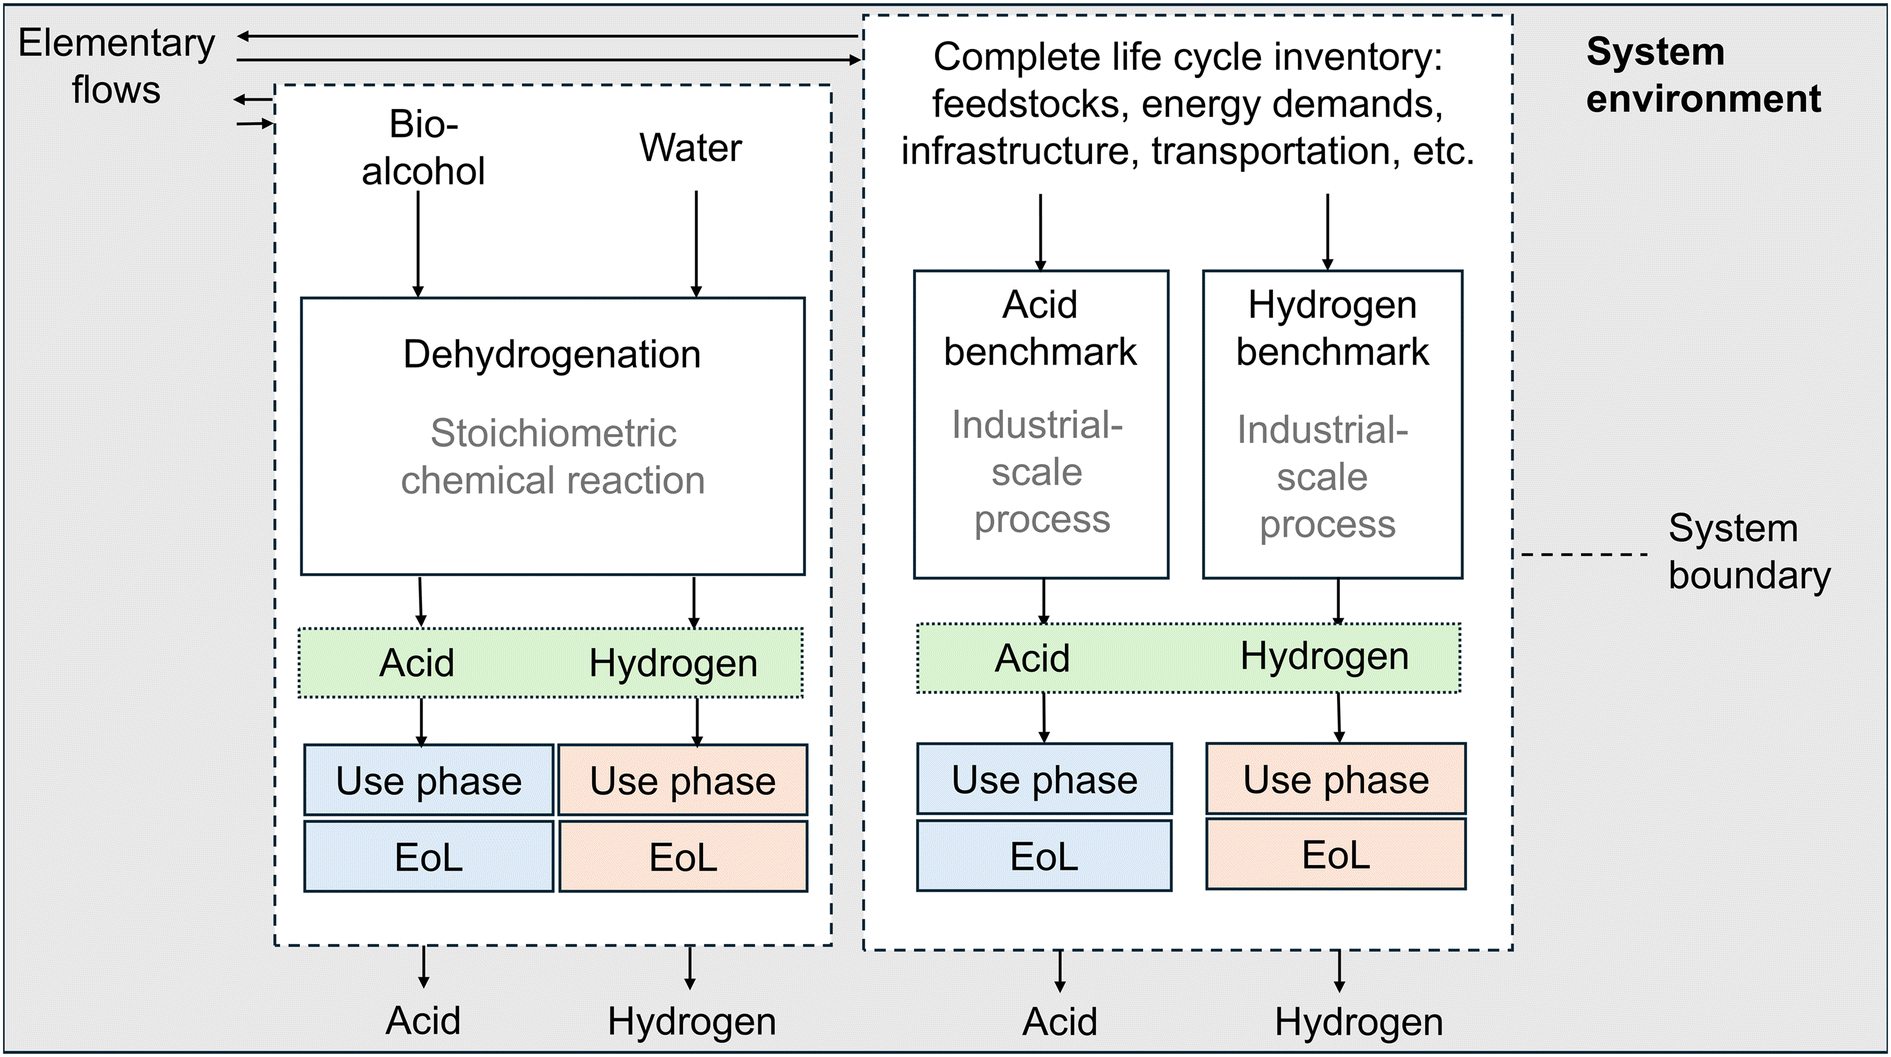 | ||
| Fig. 1 System boundaries in a cradle-to-grave analysis of the dehydrogenation route and the benchmark with system expansion for the production of hydrogen and acid. The functional unit is highlighted in green. The use phase and end of life (EoL) of the acid (blue) and the hydrogen (orange) are equal for identical products. | ||
2.2. Selecting dehydrogenation routes
Biomass can be processed into various bio-alcohols. To select promising dehydrogenation routes for our study, we search available bio-alcohols in the chemical industry. Therefore, we screen the IEA Bioenergy Report24 for bio-alcohols with near-term market potential and select nine candidates (documented in the ESI section S2†). For the selected bio-alcohols R1C–OH, we follow the idealized assumptions of the environmental potential and formulate the stoichiometric dehydrogenation reactions 1 while neglecting possible side reactions that might occur in a real application.| νR1C–OHR1C–OH + νH2OH2O → νH2H2 + νR2C–OOHR2C–OOH | (1) |
For simplicity, R1 represents the rest of the (primary or higher) alcohol, and C–OH represents the alcohol group. The alcohol group reacts with water, producing hydrogen and the acid R2C–OOH. The acid consists of the acid group C–OOH and the acid rest R2. The stoichiometric factors νi balance the reactants and products. Hydrogen is the common dehydrogenation product in any dehydrogenation reaction, while the resulting co-produced acids depend on the nine selected bio-alcohol feedstocks. We compare the resulting co-produced acids with the near-term market acids in the IEA Bioenergy Report to identify acids from dehydrogenation with market demand.
| Feedstock | Dehydrogenation co-product | Chemical reaction | Mass of co-product in kg per kg H2 |
|---|---|---|---|
| Methanol | Formic acid | CH3OH + H2O → H2 + HCOOH | 11.4 |
| Ethanol | Acetic acid | C2H5OH + H2O → H2 + CH3COOH | 14.9 |
| Propylene glycol | Lactic acid | C3H8O2 + H2O → H2 + CH3CH(OH)COOH | 22.4 |
| 1,4-Butanediol | Succinic acid | C4H10O2 + H2O → 2H2 + (CH2)2(CO2H)2 | 14.7 |
We then search relevant benchmark processes in the ecoinvent database39 (version 3.9) and LCIs in the literature (see the benchmarks in Table 2 and LCIs in ESI section S3†). Typically, LCA databases are based on state-of-the-art technologies in the fossil industry. Therefore, many fossil acid and hydrogen benchmarks are available in the ecoinvent database with LCIs including the whole plant infrastructure and mass and energy flows for the plant operation.
| Co-product | Benchmark fossil scenario | Benchmark green scenario |
|---|---|---|
| Hydrogen | Methane steam reforming39 | Wind-powered water electrolysis45 |
| Formic acid | Methyl formate route39 | CO2 hydrogenation46 |
| Acetic acid | Calanese process from methanol39 | Calanese process from bio-based methanol and renewable energy39 |
| Lactic acid | Synthetic production from acetaldehyde39 | Glucose fermentation31 |
| Succinic acid | Adipic acid from nitric acid oxidation of cyclohexane–cyclohexanol-mixture39 | Glucose fermentation31 |
While fossil technologies represent the most relevant benchmarks today, a comparison of dehydrogenation to emerging green benchmarks is desirable to ensure future competition. Thus, we also include green benchmarks from the literature in our analysis (Table 2 and ESI Tables S5–S9†).
After the screening of the nine dehydrogenation routes, we select four routes for producing acids with C1 to C4 carbon atoms with established markets in 2023 and sufficient available data for the LCA (Table 1): (1) formic acid (0.9 Mt),40 (2) acetic acid (21.7 Mt),41 (3) lactic acid (1.7 Mt),42 and (4) succinic acid, substituting fossil adipic acid43 (4.5 Mt)44 (LCIs documented in the ESI Table S3†). In the LCIs of the dehydrogenation routes, formic acid is produced from woodchip-based methanol, whereas sugar is the feedstock for the ethanol for acetic acid, the propylene glycol for lactic acid, and the butanediol for succinic acid. The ethanol is produced from sugarcane, maize, or rye. The propanediol and butanediol are produced from glucose from maize.
2.3. Assumptions and system boundaries for dehydrogenation routes
Our goal is to assess the environmental potential of each low TRL dehydrogenation route compared to the industrial benchmarks. In cases of positive environmental potential, it is worth investigating whether the mature multi-product dehydrogenation technology could replace the two single-product benchmark technologies. From a stoichiometric perspective, each of the four selected dehydrogenation routes is a multi-product system that can theoretically replace industrial hydrogen and high-value acid production.For each dehydrogenation route (DR), we calculate the environmental potential. The LCI of each ideal dehydrogenation route comprises the required feedstock amounts of bio-alcohol and water to produce hydrogen and the co-produced acid. For each dehydrogenation route j, the amounts of products are fixed in a functional unit FUDR,j of 1 kg of hydrogen and the corresponding mass of acid based on the stoichiometric factors νi and the molar masses ![[M with combining tilde]](https://www.rsc.org/images/entities/char_004d_0303.gif) i(1):
i(1):
 | (2) |
Note that the total mass of products in the functional unit differs between the four dehydrogenation routes because the acid mass varies and the mass of the co-produced acids largely exceeds the hydrogen production—at a minimum, by a factor of 11.4 for formic acid and at a maximum of 22.4 for lactic acid.
The environmental impacts EI of a dehydrogenation route j are calculated as the sum of the bio-alcohol's environmental impacts EIbio-alcohol,j and the water's environmental impacts EIwater, multiplied with the mass m per functional unit (reported in Table S3 in the ESI†). The feedstock mass demands are calculated from the stoichiometric eqn (1):
 | (3) |
The original environmental potential by Meys et al.34 included the expected minimum energy demand. The minimum energy demands of the dehydrogenation routes, expressed as reaction enthalpies (displayed in ESI Table S2†), are one order of magnitude lower than the energy demands of the fossil industrial benchmarks and, therefore, not shown. Moreover, the energy supply technologies in emerging technologies, such as dehydrogenation, are often to be decided. The energy supply could include renewable or fossil resources. In the LCI of the ideal dehydrogenation, we neglect infrastructure and energy demands, such as reaction enthalpy. Under this assumption, the results of the study are valid for any technology performing the considered dehydrogenation reactions, disregarding the process-specific design and the source of heat or electricity. In the case of a positive environmental potential, the technology-dependent infrastructure and energy demands must be included for a more detailed analysis. Therefore, in section 4.2, we perform a sensitivity analysis on the energy demand, assuming a thermochemical dehydrogenation reaction and natural gas as a heat source as a conservative approach, to quantify the minimum heat and yield, required to still yield a positive environmental potential.
For each dehydrogenation route j, we combine the hydrogen and acid benchmarks, expanding the system boundary to form the overall benchmark. We introduce benchmark scenarios s, where the fossil benchmark consists of a fossil acid and fossil hydrogen technology, and the green benchmark scenario consists of green technologies for both products. Each benchmark produces the same functional unit as the dehydrogenation route. Consequently, the benchmark's environmental impacts EIbenchmark,j,s are the sum of the separate benchmark processes (4).
| EIbenchmark,j,s = 1 kg·EIbenchmark,hydrogen,s + macid,stoichiometric,j·EIbenchmark,acid,j,s | (4) |
A life cycle impact assessment method (LCIA) method has to be selected to calculate the environmental impacts EI in (3) and (4). In this work, we select the Environmental Footprint EN 15804 cut-off method47 that counts biogenic carbon uptake as a negative emission, also referred to as −1/1 approach.48
The environmental potential Epot,env calculates the difference in environmental impacts between the benchmark scenario s and the dehydrogenation route j for each impact category k in the LCIA method:
| Epot,env,j,k,s = EIbenchmark,j,k,s − EIDR,j,k. | (5) |
We perform a cradle-to-grave analysis under the assumption that a chemical product's use phase is production-technology-independent. Identical activities in the dehydrogenation route and the benchmark cancel each other out in the environmental potential. We incinerate the produced chemicals at the end of life (EoL).
2.4. Formulating the economic potential of bio-alcohol dehydrogenation
A dehydrogenation route with a positive environmental potential should also be evaluated from an economic perspective. As we consider low TRL technologies, the required data for an economic assessment is often unavailable, similar to an environmental assessment. Hence, performing a detailed techno-economic analysis with process information is challenging. However, metrics for early-stage economic assessments exist: Roh et al.49 used the work of Douglas et al.50 to calculate a gross operating margin for CO2 utilization technologies at low TRLs based on product market prices for feedstocks and energy demands, and revenues from carbon emission credits. In our work, we adapt the example for CO2 utilization technologies to the dehydrogenation case study. Thus, we formulate an economic potential based on the same assumptions as the environmental potential—we apply the same system boundaries and use the same functional units. We consider industrial-scale benchmarks represented by the global chemical product markets and use costs from global trading platforms from July 2024.51–54 The global chemical markets represent the fossil industry. In contrast, global market prices for green chemical production are unavailable. Therefore, we only assess the economic potential in a fossil benchmark scenario.The economic potential provides a conservative profit margin (equations are displayed in the ESI section S4†): only feedstock costs are included in each dehydrogenation route, while energy demands, other operating costs, and investment costs, such as infrastructure, are neglected. The feedstock costs represent the minimum production costs expected of the dehydrogenation routes. In the benchmark scenarios, all costs and revenues are included and represented by the hydrogen and the co-product. Consequently, for a dehydrogenation route to be profitable in terms of economic potential, the feedstock purchase costs must be lower than the revenues arising from selling the dehydrogenation products at current market prices.
Considering a transition to net zero CO2 emissions, we penalize CO2 emissions based on climate change impacts with costs in both the dehydrogenation route and the benchmarks. For the carbon emission costs, we use the highest historic EU-ETS carbon tax of 105€ per tonne (converted to 0.11 US$ per kg of CO2). In the cradle-to-grave assessment, we penalize the net positive carbon emissions with a carbon tax: carbon from fossil resources is penalized while biogenic carbon from biomass resources is neutral over the life cycle. In that way, the economic potential method identifies dehydrogenation routes that are already under ideal assumptions more expensive than the benchmark. A positive economic potential represents the available margin to cover utilities, infrastructure, labor, transportation, taxes, and other costs49 and a profit when selling the products at the same market prices as the benchmarks. A negative economic potential can potentially turn positive, e.g., if a carbon tax increase leads to higher revenues from carbon uptake in the dehydrogenation route. Moreover, market prices are highly volatile and can change the economic potential results.
3. Results: the environmental and economic potential of dehydrogenation routes
In this section, we present the environmental and economic potentials of the investigated dehydrogenation routes for the co-production of hydrogen and high-value acids. The environmental potential depends on the benchmark scenario composed solely of fossil or green benchmark technologies. For all dehydrogenation routes, we show (i) the environmental potential in a fossil benchmark scenario (section 3.1), (ii) the environmental potential in a green benchmark scenario (section 3.2), and (iii) the economic potentials in a fossil benchmark scenario. The EF 3.1 EN 15804 method considered for the environmental potential includes 25 impact categories. In this section, we focus on impact categories of quality level I (recommended and satisfactory) and quality level II (recommended, but some improvements needed) according to the European Commission.55 The results for impact categories of quality level II/III and III (recommended, but to be applied with caution55) are briefly presented and available in the ESI (section S6.2†).3.1. The environmental potential in the fossil benchmark scenario
The environmental potential of the dehydrogenation routes is positive in various impact categories in the fossil benchmark scenario (see Fig. 2). In climate change, the environmental potential ranges from formic acid and acetic acid (54 kg CO2 eq. per FU) to succinic acid (152 kg CO2 eq. per FU). Consequently, all dehydrogenation routes could reduce GHG emissions. For all routes, we find positive environmental potentials in all impact categories of quality level I. The only exception occurs for particulate matter formation of lactic acid because propanediol feedstock production requires a substantial amount of heat, in this case, supplied by wood chip incineration. The lactic acid dehydrogenation route shows other adverse trade-offs in acidification, ionising radiation, photochemical oxidant formation, and freshwater eutrophication. In the marine and terrestrial eutrophication impact categories, the environmental potentials are negative for lactic acid, acetic acid, and succinic acid. Generally, eutrophication impacts represent a classical trade-off in crop-based biomass use.56 High eutrophication impacts are usually associated with inorganic fertilizer use in crop production. Formic acid dehydrogenation consumes bio-methanol feedstock produced from wood chips, which avoids the intensive use of fertilizer and, thus, the burden shifts to eutrophication impact categories.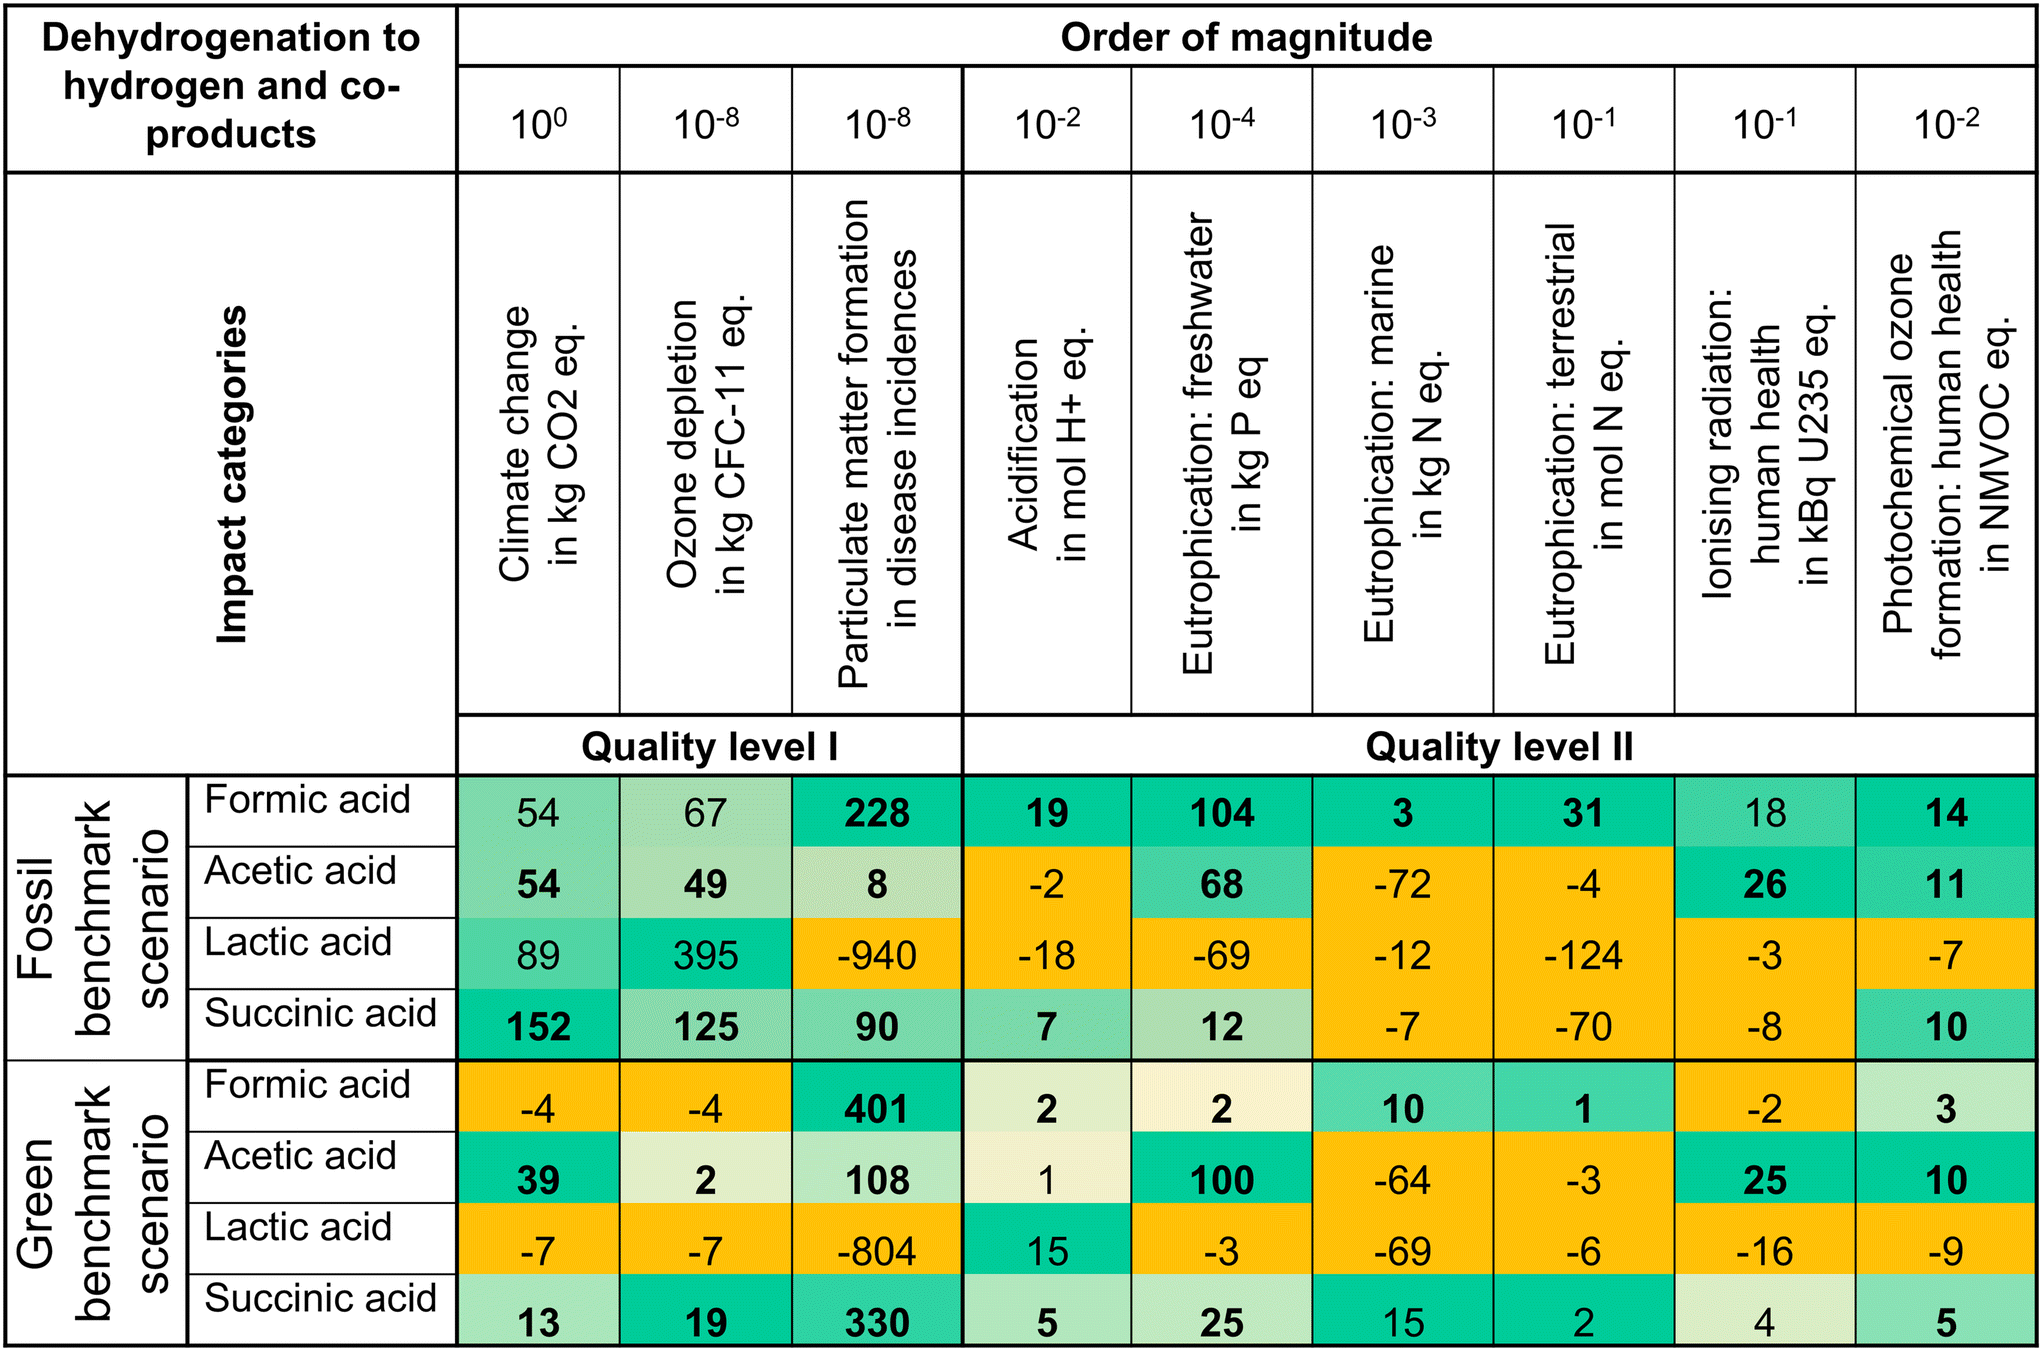 | ||
| Fig. 2 Environmental potentials per functional unit of dehydrogenation to hydrogen and four co-produced acids in a fossil and a green benchmark scenario. In each benchmark scenario, the green intensity increases with the value of a positive environmental potential within the same impact category. Negative environmental potentials are displayed in orange. The benchmarks comprised in the environmental potentials are individual for each dehydrogenation route. Bold numbers represent positive environmental potentials in the fossil and green benchmark scenarios. Quality level I and II refer to the impact category classification of the European Commission.55 | ||
In the benchmarks, the acid production contributes the most to all impact categories. Hydrogen production contributes mostly below 14% and at a maximum of 31%. The contributions of hydrogen and acids in the benchmarks reflect the low mass ratios of hydrogen to acids in the functional units (2). Consequently, the environmental benefits arise mainly from the acids in the dehydrogenation routes. An extended interpretation of the results in the quality level I and II is available in the ESI (section S6.1†). In the quality level II/III and III impact categories, all dehydrogenation routes show a positive environmental potential in the impact category non-renewable energy resources and negative environmental potential in land use. Overall, the positive environmental potentials indicate that co-producing two products in a dehydrogenation reaction can be promising to replace fossil-based production.
3.2. The environmental potential in a green benchmark scenario
Emerging green benchmarks increase the environmental competition for bio-based technologies such as dehydrogenation. Therefore, we analyze green benchmark scenarios. In climate change, co-producing acetic acid and succinic acid still results in positive environmental potentials (see Fig. 2). Moreover, co-producing acetic acid reaches the highest positive environmental potential in climate change (39 kg CO2 eq. per FU), freshwater eutrophication (100 × 10−4 kg P eq. per FU), ionising radiation (25 kBq U235 eq. per FU), and photochemical oxidant formation (10 × 10−2 NMVOC eq. per FU) impact categories, and only has negative environmental potentials in marine eutrophication and terrestrial eutrophication. Co-producing succinic acid results in positive environmental potentials in all impact categories of quality levels I and II, but the environmental impact in climate change (13 kg CO2 eq. per FU) is low. Formic acid as a co-product has negative environmental potential in the quality level I impact categories, except for particulate matter formation. Co-producing lactic acid results in negative environmental potentials in all impact categories. Thus, formic acid and lactic acid show little potential and their green benchmark technologies seem more promising.The benchmark scenarios highly influence the environmental potentials of the dehydrogenation routes in the case study and, thus, the decision of which option to select for a more detailed analysis. When switching from a fossil to a green benchmark scenario, we observe environmental potential shifts from positive to negative and vice versa. For example, formic acid would be promising as a dehydrogenation co-product in the fossil benchmark scenario, whereas it would be investigated with less priority than acetic acid or succinic acid in a green benchmark scenario. Overall, a desirable dehydrogenation route maintains a positive environmental potential, regardless of the benchmark scenario. The dehydrogenation route to acetic acid is the only route maintaining a high positive environmental potential in climate change in both scenarios and even turning positive in acidification. Both acetic acid benchmarks are calanese processes. In the green calanese process, fossil feedstock and energy demands are replaced with biomass and renewable energy. Consequently, the benchmark's impact on climate change decreases and the impacts of eutrophication and acidification increase. An extended interpretation of the results in the quality level I and II is available in the ESI (section S6.1†). In the quality level II/III and III impact categories, acetic acid's environmental potential remains positive in non-renewable energy resources and metals/minerals material resources and turns positive in land use impact categories. In the other impact categories, the results are mixed. For further investigation of dehydrogenation, acetic acid is the most robust co-product candidate in our case study with respect to both benchmark scenarios.
3.3. The economic potential of dehydrogenation routes in a fossil benchmark scenario
To assess early-stage profitability, we calculate the economic potential in a fossil benchmark scenario as introduced in section 2.4. The economic potentials per functional unit are positive for all dehydrogenation routes (Fig. 3). The economic potential is mainly driven by acid revenues and feedstock costs. The dehydrogenation to succinic acid shows the highest economic potential (including the carbon emission tax advantage) with 35.42 US$ per FU, mainly resulting from the succinic acid revenues. Acetic acid has the lowest economic potential of 2.14 US$ per FU since the ethanol feedstock costs are nearly as large as the expected revenues from acetic acid, hydrogen, and carbon emission reductions. | ||
| Fig. 3 Economic potentials per functional unit with and without carbon tax of dehydrogenation to hydrogen and four co-products in a fossil benchmark scenario. | ||
The acid revenues are dominant compared to hydrogen revenues because acid production dominates hydrogen production on a mass basis in each dehydrogenation route. Consequently, the acid market prices impact the economic potential more than the hydrogen price. The carbon emission tax advantage can add a substantial advantage to the revenues: for acetic acid, the revenues from carbon emission reductions (6.17 US$ per FU) are nearly as large as the revenues from acetic acid (6.41 US$ per FU). Even without carbon tax, the economic potential of formic acid, lactic acid and succinic acid is positive and only for acetic acid negative. The carbon price for the economic potential of acetic acid to break even is 0.07 US$ per kg CO2. With increasing efforts to reach net zero, the carbon tax might even increase. Consequently, dehydrogenation can become even more economically beneficial. In general, prices are dynamic, so the economic potential assessment should be repeated frequently, and results should be tested for stability.
4. Discussion of the environmental potential
In this section, we turn from ideal to non-ideal conditions in the dehydrogenation routes. The positive environmental potentials of the dehydrogenation routes should account for expected impact contributions from infrastructure and energy demands under realistic reaction conditions. In section 4.1, we compare the feedstock contribution and the remaining contributions in the benchmarks representing industrial-scale applications. In section 4.2, we carry out a sensitivity analysis, to determine performance targets for non-ideal reaction yields and heat demands to guide the further development of the dehydrogenation routes. We focus on the fossil benchmarks that present state-of-the-art technologies and climate change as the most relevant impact category. Performance targets based on the economy show that the environmental potential is the limiting factor to the minimum reaction yield (ESI section S6.4†), except for acetic acid with a minimum reaction yield of 46% based on the economic potential.4.1. Contribution analysis
For the fossil benchmarks, the feedstock dominates the climate change impacts of lactic acid (59%) production and still contributes substantially to the production of acetic acid (44%), formic acid (38%), and adipic acid production (37%, assuming that succinic acid substitutes fossil adipic acid, Fig. 4). The heat demand contribution ranges from 6% (acetic acid) to 23% (formic acid). The remaining impacts (remainder) include climate change contributions from, e.g., infrastructure, electricity, and transport. The incineration impacts of a dehydrogenation route and its benchmark are equal, except for succinic acid with 4 kg CO2 eq. per FU lower incineration impacts than the substituted adipic acid benchmark.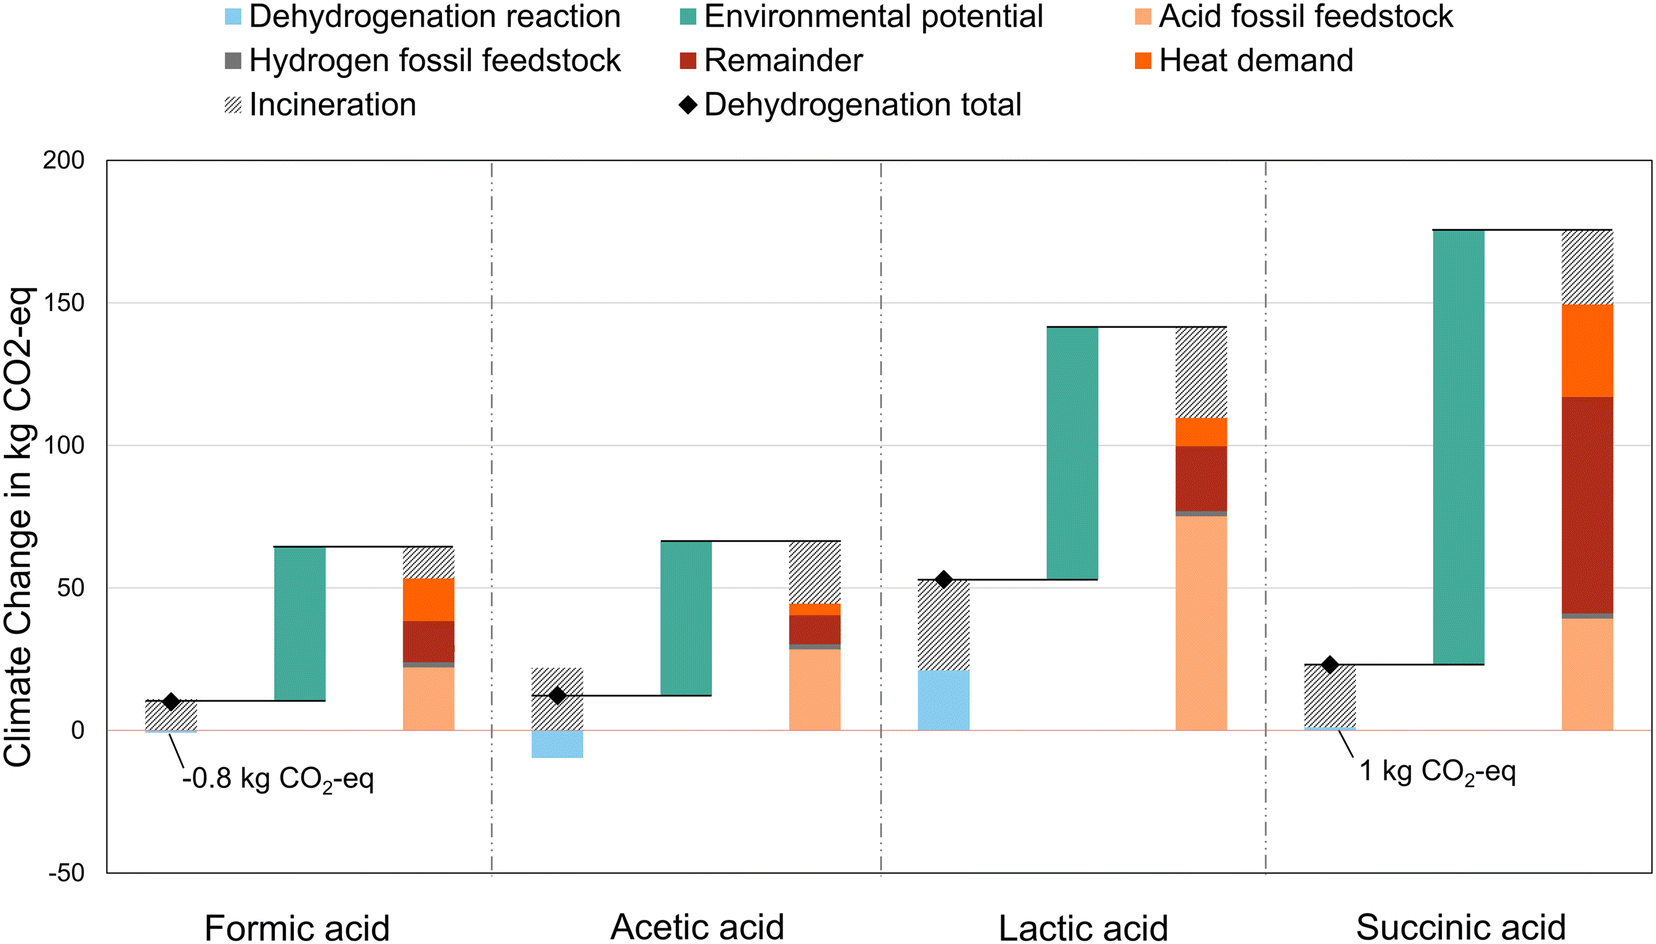 | ||
| Fig. 4 Dehydrogenation impact, environmental potential, and fossil benchmarks impact in climate change with feedstock contributions of acid and hydrogen production, heat demand, and remaining contributions. Here, succinic acid substitutes fossil adipic acid. | ||
For the dehydrogenation routes, the positive environmental potential must cover such remaining impacts, while the feedstock contributions at 100% reaction yield are already included in the environmental impacts. The environmental potential of acetic acid, with the most promising environmental potential results, is 1.9 times higher than the remaining climate change rest contributions (including the heat demand) in the fossil benchmarks. Even the environmental potential of succinic acid is 1.4 times higher than the remaining contributions in the fossil benchmark. Considering that the fossil benchmarks include real-life reaction yields and heat demands, the environmental potentials of the dehydrogenation routes seem promising.
However, the inventory for industrial-scale dehydrogenation is unknown and can substantially differ from the ideal assumptions. Therefore, we next use the environmental potentials to quantify feasible reaction yields and heat demands in competition with the fossil benchmarks. The methods of the contribution analysis are documented in the ESI section S5.1.†
4.2. Trade-offs between reaction yield and heat demand
Turning from the ideal to the realistic dehydrogenation routes involves reaction yields below the previously assumed 100%. Moreover, the dehydrogenation reactions are endothermic. Therefore, a real dehydrogenation reaction needs heat supply in addition to energy supply for downstream processing, such as product separation. Consequently, the environmental potentials of the dehydrogenation routes should cover lower reaction yields (e.g., a higher feedstock consumption) and heat demands to relate the potential to performance targets. We assume that heat is supplied by natural gas, so we include climate change impacts of natural gas production. Knowing the dehydrogenation route feedstock and heat supply impacts, we can calculate the minimum allowed feedstock demand and maximum allowed natural gas consumption of each dehydrogenation route by setting the environmental potential to zero (method presented in ESI section S5.2†). As a conservative assumption, we incinerate unconverted feedstock (ESI section S5.3†). The reaction yield and heat supply are calculated per functional unit, e.g., 1 kg of hydrogen and 11.4 kg of methanol in the formic acid route.The maximum allowed heat demands reflect the environmental potentials of the dehydrogenation routes (Fig. 5): the succinic acid dehydrogenation route can consume the most heat (1398 MJ per FU) and formic acid the least (497 MJ per FU) at 100% reaction yield. The maximum allowed heat demands are substantially higher than the estimated heat demands per functional unit based on a commonly used proxy for industrial chemical plants57 (lactic acid 47 MJ per FU, acetic acid and succinic acid 32 MJ per FU, formic acid 25 MJ per FU). For all dehydrogenation routes, the environmental potential could even cover heat demands that are as high as the heat demands per functional unit in the fossil benchmarks (succinic acid 1000 MJ per FU, lactic acid 303 MJ per FU, formic acid 272 MJ per FU, acetic acid 134 MJ per FU); assuming that the rest in the benchmark contribution analysis in section 4.1 corresponds to heat demands.
 | ||
| Fig. 5 Trade-off for dehydrogenation routes between reaction yield and allowed heat demand to arrive at zero environmental potential for the investigated dehydrogenation routes in a fossil benchmark scenario in the climate change impact category. The triangles represent heat demands based on a proxy for chemical plants.57 The squares represent the heat demands of the fossil benchmarks. The circles represent industrial reaction yields. | ||
With heat demands as high as estimated in the fossil benchmarks, the reaction yields could decrease to as much as 43% for lactic acid, 35% for succinic acid, 33% for acetic acid, and 32% for formic acid. If no heat utilities are required, the reaction yields can decrease to a minimum of 38% for lactic acid, 19% for acetic acid, 16% for formic acid, and 14% for succinic acid. The minimum allowed reaction yield depends on the environmental potential and the impact of feedstock incineration. E.g., although formic acid has the lowest environmental potential in climate change, the reaction yield can decrease nearly as much as succinic acid with the highest environmental potential since the incineration impacts of methanol feedstock are the lowest. These low impacts from incineration are advantageous when yield decreases and unreacted excess feedstock increases. The minimum reaction yields are below the industrial-scale production yields of 90% for acetic acid,58 95% for formic acid,59 95% for lactic acid,60 and 90% or larger for succinic acid.61 If the dehydrogenation reactions reach the corresponding industrial-scale production yields of the benchmarks, 488 MJ per FU heat from natural gas remains available for acetic acid, 492 MJ per FU for formic acid, 787 MJ per FU for lactic acid, and 1375 MJ per FU for succinic acid. Overall, the environmental potentials in the fossil benchmark scenario can cover industrial-scale reaction yields and heat demands, from the reaction enthalpies to industrial-scale, while leaving a margin for impacts from infrastructure and downstream processing.
5. Conclusion
In this study, we assess the environmental potential34 of four dehydrogenation routes for producing multiple products from bio-based feedstock. We calculate the environmental potential for co-producing hydrogen and (i) formic acid, (ii) acetic acid, (iii) lactic acid, and (iv) succinic acid in 16 impact categories and compare the environmental potentials in fossil and green benchmark scenarios.All dehydrogenation routes show a positive potential in the climate change impact category compared to fossil benchmarks. Therefore, we conclude that multi-product systems such as dehydrogenation can bring an advantage in feedstock exploitation. However, burden shifts to the eutrophication impact categories must be considered as commonly observed for biobased processes.
The dehydrogenation to acetic acid as a co-product is the most promising because the potentials remain positive in fossil and green benchmark scenarios. In contrast, lactic acid is the least favourable co-product compared to the other assessed co-products. Our sensitivity analysis on reaction yield and heat demand indicates that the positive environmental potentials in climate change can cover real-life reaction yields and heat demands of all dehydrogenation routes.
Using current chemical and historically high CO2 tax prices, we find positive economic potentials for all dehydrogenation routes indicating that the revenues cover the feedstock costs when a carbon tax is included that credits CO2 emission savings. Overall, the economic potential is driven by the large amounts of bio-alcohol feedstocks and co-products and their market prices. The market prices are volatile, which can change the results. A higher carbon tax can improve the economic potential. Therefore, the economic potential holds as a first proxy, but results should be interpreted cautiously and recalculated throughout the technology development.
In conclusion, our case study results indicate potential environmental and economic benefits from co-producing hydrogen and acids from bio-alcohols.
However, early-stage LCA and TEA intrinsically involve many assumptions, so the potentials should be monitored throughout a technology's development. Once the technology is deployed and the required inventory data is available, full LCA and TEA need to be conducted to refine the estimates of the environmental impacts and profitability of the dehydrogenation routes. Design choices and reaction conditions, such as reaction yield, selectivity, catalyst, and energy demands, affect the potentials, and potentials decrease with increasing levels of technology configuration details.
Author contributions
Inga-Marie Lahrsen: Conceptualisation, methodology, investigation, data curation, visualisation, writing – original draft, writing – review & editing. Eleonora Bargiacchi: Conceptualisation, methodology, writing – original draft, writing – review & editing, supervision. Johannes Schilling: Conceptualisation, methodology, writing – original draft, writing – review & editing, supervision. André Bardow: Conceptualisation, methodology, writing – original draft, writing – review & editing, supervision, funding acquisition.Data availability
The data that supports the findings of this study are available in the ESI† of this article. Other data that support the findings of this study are available from ecoinvent Technoparkstrasse 1 8005 Zurich/Switzerland.Restrictions apply to the availability of these data, which were used under license for this study. Restricted data are available from the authors with the permission of ecoinvent.
Conflicts of interest
A. B. has ownership interests in firms that render services to industry, some of which may produce bio-chemicals. A. B. has served on review committees for research and development at ExxonMobil and TotalEnergies, oil and gas companies that are also active in bio-chemical production. All other authors have no competing interests.Acknowledgements
This work is funded by the European Union (Grant Agreement number 101070721). Views and opinions expressed are, however, those of the author(s) only and do not necessarily reflect those of the European Union or the European Innovation Council and SMEs Executive Agency (EISMEA). Neither the European Union nor the granting authority can be held responsible for them. This work is funded by UK Research and Innovation (UKRI) under the UK government's Horizon Europe funding guarantee grant number 10045035. This work has received funding from the Swiss State Secretariat for Education, Research and Innovation (SERI) under grant number 22.00374.References
- J. Huo, Z. Wang, C. Oberschelp, G. Guillén-Gosálbez and S. Hellweg, Green Chem., 2023, 25, 415–430 RSC
.
- S. Kartha, E. Kemp-Benedict and A. Fencl, Biomass in a Low-Carbon Economy: Resource Scarcity, Climate Change, and Business in a Finite World (Policy brief), https://www.sei.org/publications/biomass-in-a-low-carbon-economy-resource-scarcity-climate-change-and-business-in-a-finite-world-policy-brief/, Accessed: 13.07.23, SEI Policy Brief, Stockholm, Sweden.
- European Commission and Directorate-General for Research and Innovation , A sustainable bioeconomy for Europe – Strengthening the connection between economy, society and the environment – Updated bioeconomy strategy, https://op.europa.eu/en/publication-detail/-/publication/edace3e3-e189-11e8-b690-01aa75ed71a1/language-en, Accessed: 05.10.2023, Publication Office of the European Commission.
- J. Lasarte López, M. van Leeuwen, W. Rossi Cervi, R. M'barek and G. H. Hugo, BioRegEU. Pilot dataset for Jobs and Value Added in the Bioeconomy of EU regions, https://datam.jrc.ec.europa.eu/datam/mashup/BIO_REG_EU/, Accessed: 07.02.2024.
- S. de Groot, J. Kersjes, V. Natonek, B. Roefs and S. Scavizzi, The growing competition between the bioenergy industry and the feed industry, https://fefac.eu/wp-content/uploads/2022/07/22_DOC_106.pdf, Accessed: 05.10.2023, Wageningen University & Research.
- C. Briens, J. Piskorz and F. Berruti, Int. J. Chem. React. Eng., 2008, 6, 1–49 Search PubMed
- X. Yang, C. P. Nielsen, S. Song and M. B. McElroy, Nat. Energy, 2022, 7, 955–965 CrossRef CAS
- N. Rambhujun, M. S. Salman, T. Wang, C. Pratthana, P. Sapkota, M. Costalin, Q. Lai and K.-F. Aguey-Zinsou, MRS Energy Sustainability, 2020, 7, E33 CrossRef PubMed
- G. Lopez, L. Santamaria, A. Lemonidou, S. Zhang, C. Wu, A. T. Sipra and N. Gao, Nat. Rev. Methods Primers, 2022, 2, 20 CrossRef CAS
- P. R. Lanjekar, N. L. Panwar and C. Agrawal, Bioresour. Technol. Rep., 2023, 21, 101293 CrossRef CAS
- D. B. Levin, L. Pitt and M. Love, Int. J. Hydrogen Energy, 2004, 29, 173–185 CrossRef CAS
- W. R. Leow, S. Völker, R. Meys, J. E. Huang, S. A. Jaffer, A. Bardow and E. H. Sargent, Nat. Commun., 2023, 14, 1954 CrossRef CAS PubMed
- A. Kadier, Y. Simayi, P. Abdeshahian, N. F. Azman, K. Chandrasekhar and M. S. Kalil, Alexandria Eng. J., 2016, 55, 427–443 CrossRef
- W. Liu, Y. Cui, X. Du, Z. Zhang, Z. Chao and Y. Deng, Energy Environ. Sci., 2016, 9, 467–472 RSC
- T. Lepage, M. Kammoun, Q. Schmetz and A. Richel, Biomass Bioenergy, 2022, 144, 105920 CrossRef
- J. Proost, Int. J. Hydrogen Energy, 2022, 45, 17067–17075 CrossRef
- A. C. Bohnenkamp, R. H. Wijffels, S. W. M. Kengen and R. A. Weusthuis, Biotechnol. Biofuels, 2021, 14, 192 CrossRef CAS PubMed
- H. Liu, Y. Jiang, R. Zhou, Z. Chang and Z. Hou, Fuel, 2022, 321, 123980 CrossRef CAS
- H. Zhao, J. Liu, N. Zhong, S. Larter, Y. Li, M. G. Kibria, B.-L. Su, Z. Chen and J. Hu, Adv. Energy Mater., 2023, 13, 2300257 CrossRef CAS
- Z. Tian, Y. Da, M. Wang, X. Dou, X. Cui, J. Chen, R. Jiang, S. Xi, B. Cui, Y. Luo, H. Yang, Y. Long, Y. Xiao and W. Chen, Nat. Commun., 2023, 14, 142 CrossRef CAS PubMed
- Y. Ding, Y. Cao, D. Chen, J. Li, H. Wu, Y. Meng, J. Huang, J. Yuan, Y. Su, J. Wang and H. Li, Chem. Eng. J., 2023, 452, 139687 CrossRef CAS
- K. Wang, J. Horlyck, N. An and A. Voutchkova-Kostal, Green Chemistry, 2024, 26, 3546–3564 RSC
- V. Shvalagin, N. Tarakina, B. Badamdorj, I.-M. Lahrsen, E. Bargiacchi, A. Bardow, Z. Deng, W. Wang, D. L. Phillips, Z. Guo, G. Zhang, J. Tang and O. Savateev, ACS Catalysis, 2024, 14, 14836–14854 CrossRef CAS PubMed
-
H. Stichnothe, G. Bell and H. Jørgensen, Bio-Based Chemicals – A 2020 Update, 2020, IEA Bioenergy Search PubMed
- E. De Jong, A. Higson, P. Walsh and M. Wellisch, Biofuels, Bioprod. Biorefin., 2012, 6, 606–624 CrossRef CAS
- Y. K. Salkuyeh, B. A. Saville and H. L. MacLean, Int. J. Hydrogen Energy, 2018, 43, 9514–9528 CrossRef CAS
- A. Hosseinzadeh, J. L. Zhou, X. Li, M. Afsari and A. Altaee, Renewable Sustainable Energy Rev., 2022, 156, 111991 CrossRef CAS
- M. Buffi, M. Prussi and N. Scarlat, Biomass Bioenergy, 2022, 165, 106556 CrossRef CAS
- G. Li, P. Cui, Y. Wang, Z. Liu, Z. Zhu and S. Yang, Energy, 2020, 191, 116588 CrossRef CAS
- C. Liang, U. R. Gracida-Alvarez, T. R. Hawkins and J. B. Dunn, ACS Sustainable Chem. Eng., 2023, 11, 2773–2783 CrossRef CAS
- B. Winter, R. Meys, A. Sternberg and A. Bardow, ACS Sustainable Chem. Eng., 2022, 10, 15648–15659 CrossRef CAS PubMed
- C. Kang, J. J. Liu, N. Woo and W. Won, ACS Sustainable Chem. Eng., 2023, 11, 4430–4440 CrossRef CAS
- H. Cai, J. Han, M. Wang, R. Davis, M. Biddy and E. Tan, Biofuels, Bioprod. Biorefin., 2018, 12, 815–833 CrossRef CAS
- R. Meys, F. Frick, S. Westhues, A. Sternberg, J. Klankermayer and A. Bardow, Resour., Conserv. Recycl., 2020, 162, 105010 CrossRef
- D. Tonini and T. Astrup, Appl. Energy, 2012, 99, 234–246 CrossRef CAS
- O. Englund, P. Börjesson, G. Berndes, N. Scarlat, J.-F. Dallemand, B. Grizzetti, I. Dimitriou, B. Mola-Yudego and F. Fahl, Glob. Environ. Change, 2020, 60, 101990 CrossRef
- M. Pillich, J. Schilling, L. Bosetti and A. Bardow, Green Chem., 2024, 26, 10893–10906 RSC
- Environmental management - Life cycle assessment - Requirements and guidelines (ISO 14044:2006+Amd 1:2017+Amd 2:2020).
- G. Wernet, C. Bauer, B. Steubing, J. Reinhard, E. Moreno-Ruiz and B. Weidema, Int. J. Life Cycle Assess., 2016, 21, 1218–1230 CrossRef
- Formic Acid Market Size, Share, Price, Report 2024-32, https://www.imarcgroup.com/formic-acid-market, Accessed: 23.01.2024.
- Acetic acid production capacity globally 2023, https://www.statista.com/statistics/1063215/acetic-acid-production-capacity-globally/, Accessed: 23.01.2024.
- Lactic acid global market volume 2015–2030, https://www.statista.com/statistics/1310495/lactic-acid-market-volume-worldwide/, Accessed: 23.01.2024.
- B. Erickson, Janet E Nelson and P. Winters, Biotechnology, 2012, 7, 176–185 CAS
- Adipic acid market volume global 2023, https://www.statista.com/statistics/1113587/global-market-size-adipic-acid/, Accessed: 23.01.2024.
- D. Vázquez and G. Guillén-Gosálbez, Chem. Eng. Sci., 2021, 246, 116891 CrossRef
- A. Sternberg, C. M. Jens and A. Bardow, Green Chem., 2017, 19, 2244–2259 RSC
- EN 15804 standard, https://eplca.jrc.ec.europa.eu/LCDN/EN15804.xhtml, Accessed: 09.01.2024.
-
T. Sonderegger and N. Stoikou, Implementation of life cycle impact assessment methods in the ecoinvent database v3.9 and v3.9, ecoinvent Association, Zürich, Switzerland Search PubMed
- K. Roh, A. Bardow, D. Bongartz, J. Burre, W. Chung, S. Deutz, D. Han, M. Heßelmann, Y. Kohlhaas, A. König, J. S. Lee, R. Meys, S. Völker, M. Wessling, J. H. Lee and A. Mitsos, Green Chem., 2020, 22, 3842–3859 RSC
- J. M. Douglas, AIChE, 1985, 31, 353–362 CrossRef CAS
- Alibaba – The leading B2B ecommerce platform for global trade, https://www.alibaba.com/, Accessed: 29.07.2024.
- Acetic Acid Prices, News, Monitor, Analysis & Demand, https://www.chemanalyst.com/Pricing-data/acetic-acid-9, Accessed: 29.07.2024.
- Pricing, https://www.methanex.com/about-methanol/pricing/, Accessed: 29.07.2024.
- Butanediol Prices, Monitor, Market Analysis & Demand, https://www.chemanalyst.com/Pricing-data/butanediol-54, Accessed: 29.07.2024.
- European Commission-Joint Research Centre - Institute for Environment and Sustainability: International Reference Life Cycle Data System (ILCD) Handbook- Recommendations for Life Cycle Impact Assessment in the European context, First edition November 2011, EUR 24571 EN. Luxemburg. Publications Office of the European Union, 2011 Search PubMed
-
T. J. Dijkman, C. Basset-Mens, A. Antón and M. Núñez, in LCA of Food and Agriculture, ed. M. Z. Hauschild, R. K. Rosenbaum and S. I. Olsen, Springer International Publishing, Cham, 2018, pp. 723–754 Search PubMed
-
Chemiepark GENDORF, Umwelterklaerung Aktualisierung, 2020, pp. 13–14 Search PubMed
-
C. Le Berre, P. Serp, P. Kalck and G. P. Torrence, Ullmann's Encyclopedia of Industrial Chemistry, John Wiley & Sons, Ltd, 2014, pp. 1–34 Search PubMed
- ecoinvent Association, ecoinvent data v3.9, cut-off, https://ecoinvent.org/, Accessed: 21.11.2023.
- G. Juodeikiene, D. Vidmantiene, L. Basinskiene, D. Cernauskas, E. Bartkiene and D. Cizeikiene, Catal. Today, 2015, 239, 11–16 CrossRef CAS
-
M. T. Musser, Ullmann’s Encyclopedia of Industrial Chemistry, John Wiley & Sons, Ltd., 2000 Search PubMed
Footnote |
| † Electronic supplementary information (ESI) available. See DOI: https://doi.org/10.1039/d4gc05443a |
| This journal is © The Royal Society of Chemistry 2025 |