
 Open Access Article
 This Open Access Article is licensed under a
 Creative Commons Attribution 3.0 Unported Licence
Realizing CO2 emission reduction in lime and soda ash manufacturing through anion exchange†
Aniruddha
Baral
 *ab,
Jose-Luis
Galvez-Martos
*c and
Theodore
Hanein
*ad
*ab,
Jose-Luis
Galvez-Martos
*c and
Theodore
Hanein
*ad
aSchool of Civil Engineering, University of Leeds, Leeds, LS2 9LG, UK. E-mail: aniruddha.baral@austin.utexas.edu; t.hanein@leeds.ac.uk
bDepartment of Civil, Architectural and Environmental Engineering, University of Texas at Austin, Austin, TX 78712, USA
cTecnalia Research & Innovation, Astondo Bidea, Edificio 700, 48160, Derio, Bizkaia, Spain. E-mail: joseluis.galvez@tecnalia.com
dearth4Earth Technology Ltd, London, W1W 7LT, UK
First published on 21st February 2025
Abstract
Lime (CaO) and soda ash (Na2CO3) are two foundational chemicals for modern civilization, and the CO2 emissions from their production processes are challenging to reduce. Furthermore, decarbonization of the lime industry could also reduce the CO2 emissions associated with cement production, for which lime is the key precursor. In this paper, we show that an anion exchange process to co-produce CaO and Na2CO3 from CaCO3 and NaOH can reduce the carbon footprint of both chemicals through industrial symbiosis. Heating energy and NaOH production are the major contributing factors towards the cost and CO2 emissions of this process, which can supply the global annual soda ash demand (∼65 Mt) and co-produce ∼50 Mt of lime in an economically sustainable manner (16% gross margin) while immediately reducing global CO2 emission by 37 Mt compared to current production methods. Using electrified industrial heat sources and heat pumps to reuse heating energy would further reduce the cost and CO2 emissions of the anion exchange process.
Green foundation1. Lime and soda ash production belong to the “hard-to-abate” sector, where reduction of CO2 emissions is difficult. In this paper, we have shown that an anion-exchange process to co-produce lime and soda ash can reduce global CO2 emissions by 37 Mt per year in an economically feasible manner.2. Lime and soda ash are fundamentally essential chemicals for today's human civilization. They are used for carbon capture, cement, detergent, and glass manufacturing, and they are critical for energy storage applications, including lithium and sodium ion batteries, and renewable energy generation, such as solar panels. 3. Integrating soda ash and lime manufacturing is a pivotal step in decarbonizing the inorganic bulk chemical sector, which can have a ripple effect on decarbonizing other hard-to-abate sectors. |
Introduction
Lime (CaO) and soda ash (Na2CO3) are historically essential chemicals for human civilization. Soda ash has been used for manufacturing glass since 5000 years ago by the Egyptians,1 and in more modern times, soda ash demand is continuously growing as it is used for producing powdered detergents, scrubbing polluting emissions from flue gas emissions, and as a buffering agent in different processing technologies, including lithium ion battery production, a rapidly expanding industry. Soda ash is extracted from mined trona (“natural soda ash”) or in regions without trona availability, such as in Europe, it is produced using synthetic processes, mostly the Solvay2 or the modified Solvay or Hou's process (“synthetic soda ash”). Soda ash production from trona mining has a CO2 footprint of 0.3–0.7 kg of CO2 per kg of soda ash, whereas synthetic soda ash production, which accounts for two-thirds of global soda ash production, has a footprint of 1 kg of CO2 per kg of soda ash produced.3 Lime, on the other hand, was also used as early as 7000 BCE at Aşıklı Höyük in Turkey,4 and is currently utilized majorly in cement production as well as in soil stabilization,5 wastewater treatment,6 remediation of heavy metal pollution,7 and CO2 capture.8 Lime is generally manufactured from the calcination of limestone with a CO2 footprint of ∼1–1.8 kg of CO2 per kg of lime produced.9 Both lime and soda ash are globally produced at a high volume (65 Mt of soda ash and 430 Mt of lime annually).10 Furthermore, the calcination of limestone is an essential step in conventional cement production (4.1 Gt annual global production),10 which contributes about 8% of anthropogenic CO2 emissions,11 and a significant reduction in carbon emissions from lime production could be key to reducing cement's CO2 footprint. Recently, a concurrent recycling of steel and concrete using electrical energy without any direct CO2 emissions has been proposed;12 however, this process cannot supply the current global cement demand, and other complementary solutions are necessary.Both lime and soda ash production are considered part of hard-to-abate sectors13,14 and are expected to require radical transformation in their production processes to make them carbon-neutral. Recently, a novel chemical process has been developed to simultaneously produce Ca(OH)2 and Na2CO3 from CaCO3 and NaOH through anion exchange without direct CO2 emission (eqn (1)).15
| CaCO3 + 2Na(OH) (aq.) ⇌ Ca(OH)2 + Na2CO3 | (1) |
Eqn (1) is a reversible anion-exchange reaction, and the output is always a mix of CaCO3, NaOH, Ca(OH)2, and Na2CO3. However, the conversion efficiency of CaCO3 into Ca(OH)2 (eqn (2)) can be as high as 96%, depending on the initial amount of CaCO3, NaOH, and water (H2O).
 | (2) |
The different compounds are separated by leveraging the high solubility of NaOH in alcohol (methanol or ethanol) and Na2CO3 in water. This anion exchange reaction occurs at ambient pressure and temperature and is successful even when utilizing industrial sources of limestone containing various impurities such as Si, Al, and Fe.16 Furthermore, it is not highly sensitive to reaction temperature.17 Although this anion-exchange process shows promise in reducing carbon emissions, a thorough and systematic techno-economic analysis has not been performed to evaluate its potential for scaling up within the timeframe necessary to achieve climate goals.
In this work, we have evaluated the energy, cost, and carbon footprint of executing the processes previously suggested,15 along with proposing a new process for better techno-economic opportunities. The aim of our analysis was to identify the process and the initial amounts of CaCO3, NaOH, and water in eqn (1) that would provide the lowest cost and CO2 footprint, as well as to compare them to the current global emission and cost values to evaluate the potential of this technology for successful scaling up in the short term.
Methodology
Chemical processes and techno-economic assessment
The anion exchange process has CaCO3 and NaOH as input materials and Na2CO3 and Ca(OH)2 as output materials. If the anion exchange of Ca(OH)2 production is scaled up to supply the current global cement clinker production (annually 3.8 Gt),10 a total of ∼2.47 Gt of CaO would be required, assuming that clinker contains 65% CaO on average. Production of the 2.47 Gt of CaO would be accompanied by a production of 4.68 Gt of Na2CO3 and a consumption of 3.53 Gt of NaOH, assuming 100% conversion efficiency. These amounts are much higher than the current global annual production of NaOH and Na2CO3 (82 Mt (ref. 18) and 65 Mt,10 respectively), and the techno-economic assessment of this process must carefully consider the cost and CO2 footprint of these materials.The production of Ca(OH)2 and Na2CO3 from CaCO3 and NaOH can involve various steps depending on the order of separation and purification after the anion exchange reaction (Fig. 1). In this paper, two processes, process A and process B, proposed by Hanein et al.,15 would be considered. Process A involves removing the unreacted NaOH using methanol, and then separating Na2CO3 from the mixture of Ca-containing compounds, Ca(OH)2 and CaCO3. In process B, the Ca-containing compounds are first separated after adding excess water to dissolve NaOH and Na2CO3.
 | ||
| Fig. 1 Flow diagrams of the two processes (a: process A, b: process B). In process “A”, the unreacted NaOH after the anion exchange reaction is separated first before separating the Na2CO3 from the mixture of Ca-containing compounds, Ca(OH)2 and CaCO3. In process “B”, the Ca-containing compounds are separated from the mixture after adding excess water to remove/dissolve both NaOH and Na2CO3.15 | ||
For a techno-economic assessment, a set of 71 observed experimental results15 that evaluated the conversion rate of CaCO3 into Ca(OH)2 as in eqn (1), when different amounts of CaCO3, NaOH, and water are mixed, are considered. As the chemical reaction described in eqn (1) is never 100% complete and depends on a complex equilibrium, the Ca-containing product will always be a mixture of different compositions of Ca(OH)2 and CaCO3, and for comparison purposes, the mixture of Ca(OH)2 and CaCO3 is here assumed to be heated at 1000 °C using natural gas to form CaO as the final product.
For the title study, two types of NaOH, (1) “commercial NaOH” (obtained from the currently available supply chain) and (2) “renewable NaOH” (produced using 100% renewable green electricity), have been considered. In terms of output materials, two cases for the Na2CO3 generated were also considered: (1) “commercialized Na2CO3”, where the Na2CO3 is sold in the market, or (2) “recycled Na2CO3”, where the Na2CO3 produced is used to the regenerate NaOH (input in eqn (1)). Thus, a total of 4 cases were considered for each process, process A and B – (1) commercial NaOH, commercialized Na2CO3, (2) renewable NaOH, commercialized Na2CO3, (3) commercial NaOH, recycled Na2CO3, and (4) renewable NaOH, recycled Na2CO3. A detailed description of the cost and CO2 footprint of these materials is provided below and in the ESI (Tables 1 and S1†).
| Feature | Value/calculation/comment |
|---|---|
| RM: raw materials, U: utilities, C&A: consumables and auxiliaries, OL&S: Labour, supervision, laboratory and overheads, IN: insurance, M: maintenance. | |
| Base year | 2019 |
| Currency | USD |
| Geographical scope | Europe |
| Annual total costs | Variable costs + fixed costs |
| Variable costs | RM + U + C&A |
| Raw materials (RM) | NaOH: USD 219 per t |
| Renewable NaOH: USD 218 per t | |
| Methanol: USD 254 per t (ref. 26) | |
| Sodium carbonate: USD 223 per t | |
| Recycled NaOH: USD 363 per t | |
| Recycled renewable NaOH: USD 362 per t | |
| CaO: USD 140 per t (ref. 10) | |
| Utilities (U) | Natural gas: USD 8.5 per GJ (ref. 27) |
| Power: | |
| Grid – USD 16.3 per GJ (ref. 28) | |
| Renewable (wind) – USD 15.5 per GJ (ref. 29) | |
| Water: USD 3.7 per m3 | |
| Consumables and auxiliaries (C&A) | 5% of M |
| Fixed costs | OL&S + IN + M |
| Labour, supervision, laboratory and overheads (OL&S) | Based on European labour costs for manufacturing sectors (USD 32.0 per h)30 + 15% overhead |
| Insurance (IN) | 1% of TIC |
| Maintenance (M) | 3% of TIC |
Process model
A simulation model was built in Aspen Plus 11, based on electrolyte equilibria for the prediction of carbonate speciation reactions and E-NRTL19 as a thermodynamic model. The model takes the composition of the input reactants (i.e. calcite, water, and sodium hydroxide) and the observed conversion from the experimental results15 and scales the process up to 1000 tons of calcite per day. The modeling was performed for separation and purification routes A and B.Evaporators were calculated using an adiabatic flash block to estimate the heat requirements for drying and evaporation at 150 °C. The rest of the processes (mixers, reprecipitations and/or redissolutions) were estimated from solubility data, while the thermal balance of each block was estimated using Aspen Plus. The two options (A and B) were integrated into the same simulation flowsheet with a stream multiplicator to calculate the mass and energy balance for all the 142 potential cases (71 experimental results through 2 different processing options) in one simulation run. These calculations and the solubilities were integrated into a worksheet calculator that includes the 71 case studies developed by Hanein et al.15 and feeds to the Aspen model the conversion of calcite and the amount of required methanol or water for reprecipitation/redissolution.
The mass and energy balance results are then calculated through a sensitivity analysis for all the laboratory results reported by Hanein et al. (Table S4†).15 Methanol was assumed to be recovered in a closed cycle, as for conventional solvents. However, a 5% loss per cycle was considered to estimate the potential impact of various losses in an industrial plant. Evaporated water is not recovered, while electricity needs, calculated for pumping and pressure-driven filtrations, are lower than 1 kW h per ton of input calcite for options A and B.
CO2 footprint
The carbon footprint is calculated using a cradle-to-gate LCA approach following the methodology described in the ISO 14040 standard.20 In terms of the system's functionality, the desired function is to fully convert calcium carbonate in limestone to calcium oxide and CO2. So, the functional unit of the assessment is the treatment of 1 ton of calcium carbonate with sodium hydroxide to obtain 0.56 tons of CaO. The system boundaries include all the impacts from raw materials and energy source supply (background system) and the proposed limestone treatment system (foreground system) but do not include further use of CaO, such as in clinker making or any other further processing since its comparison with the production of CaO through conventional thermal calcination of limestone would suffice to estimate emission savings. The CO2 emissions from the final calcination step were considered in the GHG balance. The construction of the plant was excluded from the boundaries of the LCA system.The system is multifunctional since the by-product consists of a solid composed mainly of sodium carbonate that may be recycled to make NaOH (case – “recycled Na2CO3”) or commercialized (case – “commercialized Na2CO3”). In order to evaluate the influence of the by-product on the carbon footprint, for the case of “commercialized Na2CO3”, the system was expanded in order to include the avoidance of the production of commercial sodium carbonate and lime. For the case “recycled Na2CO3”, sodium carbonate was assumed to be recycled back to sodium hydroxide through an electrolytic system; pure CO2 would then be produced, which would be stored underground and not considered in the GHG balance.
The background system inventories were taken from ecoinvent 3.8,21 except for sodium hydroxide, for which the inventory model is modified to account for realistic and current electricity market-derived emissions during the electrolytic process of sodium hydroxide. For the foreground system, i.e. the production of CaO through the reaction of sodium hydroxide and calcite, the mass and energy balances for the two design options described above (A and B) were taken from the mass and energy balances produced in Aspen Plus. Energy supply was modeled considering an average, from the latest available European inventory for natural gas heat and the European mix for electricity. Average water, limestone, and methanol supplies in Europe were accounted for from ecoinvent 3.8, maximizing its representativeness.
Economic modelling
The economic assessment of the processes was carried out assuming a 50-year design life of the plant, and the total investment cost was calculated based on the exponential model dependent on the size parameter, as per Lang's method.22 The different equipment and sizes used in evaluating the total investment cost are shown in the ESI (Table S2).† The annual operating costs of the plant are composed of variable costs, which are dependent on the annual production, and fixed costs, which are independent of the annual production but dependent on the design capacity. Fixed costs such as maintenance, insurance or others were generally calculated as a percentage of the investment cost (Table 1).Table 1 also summarizes the main economic assumptions used in the calculations and shows all the prices and costs already converted into USD2019.
Cost data were all actualized to December 2019, i.e., a pre-pandemic situation and without the current (2024) price volatility, by using the Producer Price Index (PPI)23 for raw materials and the Chemical Engineering Plant Cost Index (CEPCI)24 for investment costs unless originally sourced from 2019 (Table S3†). For consistency, as most cost references for raw materials were found on a USD basis, we utilized the PPI reported by the United States Bureau of Labor Statistics. The yearly exchange rates USD/EUR were taken as the average December exchange rates each year.
Sodium hydroxide costs were estimated from the weighted average flow of import and export values reported in the UN Comtrade database.25 The average was weighed considering the suppliers’ traded flow covering 90% of the total traded flow and then converted into USD2019 per ton of NaOH, which is taken as the “Commercial NaOH” price. The price of “Renewable NaOH” was calculated based on the “Commercial NaOH” price and the difference between European average electricity prices for non-household consumers and European average electricity prices from wind turbines.
From this value, the estimate for the price of sodium hydroxide manufactured from 100% renewable electricity (Re-NaOH) was calculated using eqn (3).
 | (3) |
The heat requirement of the processes was generated using a natural gas heater.
Results
Carbon footprint of the anion exchange process
The carbon footprint of the process was expressed in terms of net carbon footprint per ton of CaCO3 processed, as the output from the process was dependent on the input material proportions. The net carbon footprint of the system was calculated by subtracting the carbon footprint of the output materials from the gross carbon footprint of the anion exchange process. The CO2 footprints of lime and soda vary greatly depending on the production process, and three different CO2 footprints (low, high, and representative) of CaO and Na2CO3 were used in this study. The CO2 footprints of lime were 1.0, 1.8, and 1.2 t CO2 per t CaO produced for the low, high, and representative cases, respectively, based on the different kiln types used.9 Similarly, the CO2 footprints of Na2CO3 were 0.3 and 1 t CO2 per t Na2CO3 produced for the low and high cases, corresponding to the Na2CO3 production from high-quality trona in the USA and the synthetic Solvay process, respectively.3 The representative CO2 footprint of Na2CO3 was 0.67 t CO2 per t Na2CO3 produced, as calculated from ecoinvent based on Na2CO3·10H2O.31The net carbon footprints of the anion exchange system are shown in Fig. S2† and Fig. 2 for processes A and B, respectively. The net carbon footprint was dependent on the NaOH type (commercial vs. renewable) and the fate of the Na2CO3 produced (recycled vs. commercialized). The net carbon footprint of the system was in the following order: commercial NaOH and recycled Na2CO3 > renewable NaOH and recycled Na2CO3 > commercial NaOH and commercialized Na2CO3 > renewable NaOH and commercialized Na2CO3. Recycling Na2CO3 increased the carbon footprint of the system significantly, and apart from a few cases where it was assumed that the CaO produced replaced existing CaO production with a high carbon footprint, the net carbon footprint was positive. Recycling Na2CO3 to regenerate NaOH has a carbon footprint of 0.92 t CO2 per t NaOH regenerated, which is higher than the CO2 footprint of the currently used NaOH production process (0.78 and 0.31 t CO2eq per t NaOH for commercial and renewable NaOH, respectively). Furthermore, recycling Na2CO3 also eliminates the CO2 savings from replacing current Na2CO3 production (0.67 t CO2 per t Na2CO3), making the recycling of Na2CO3 to regenerate NaOH an unattractive method.
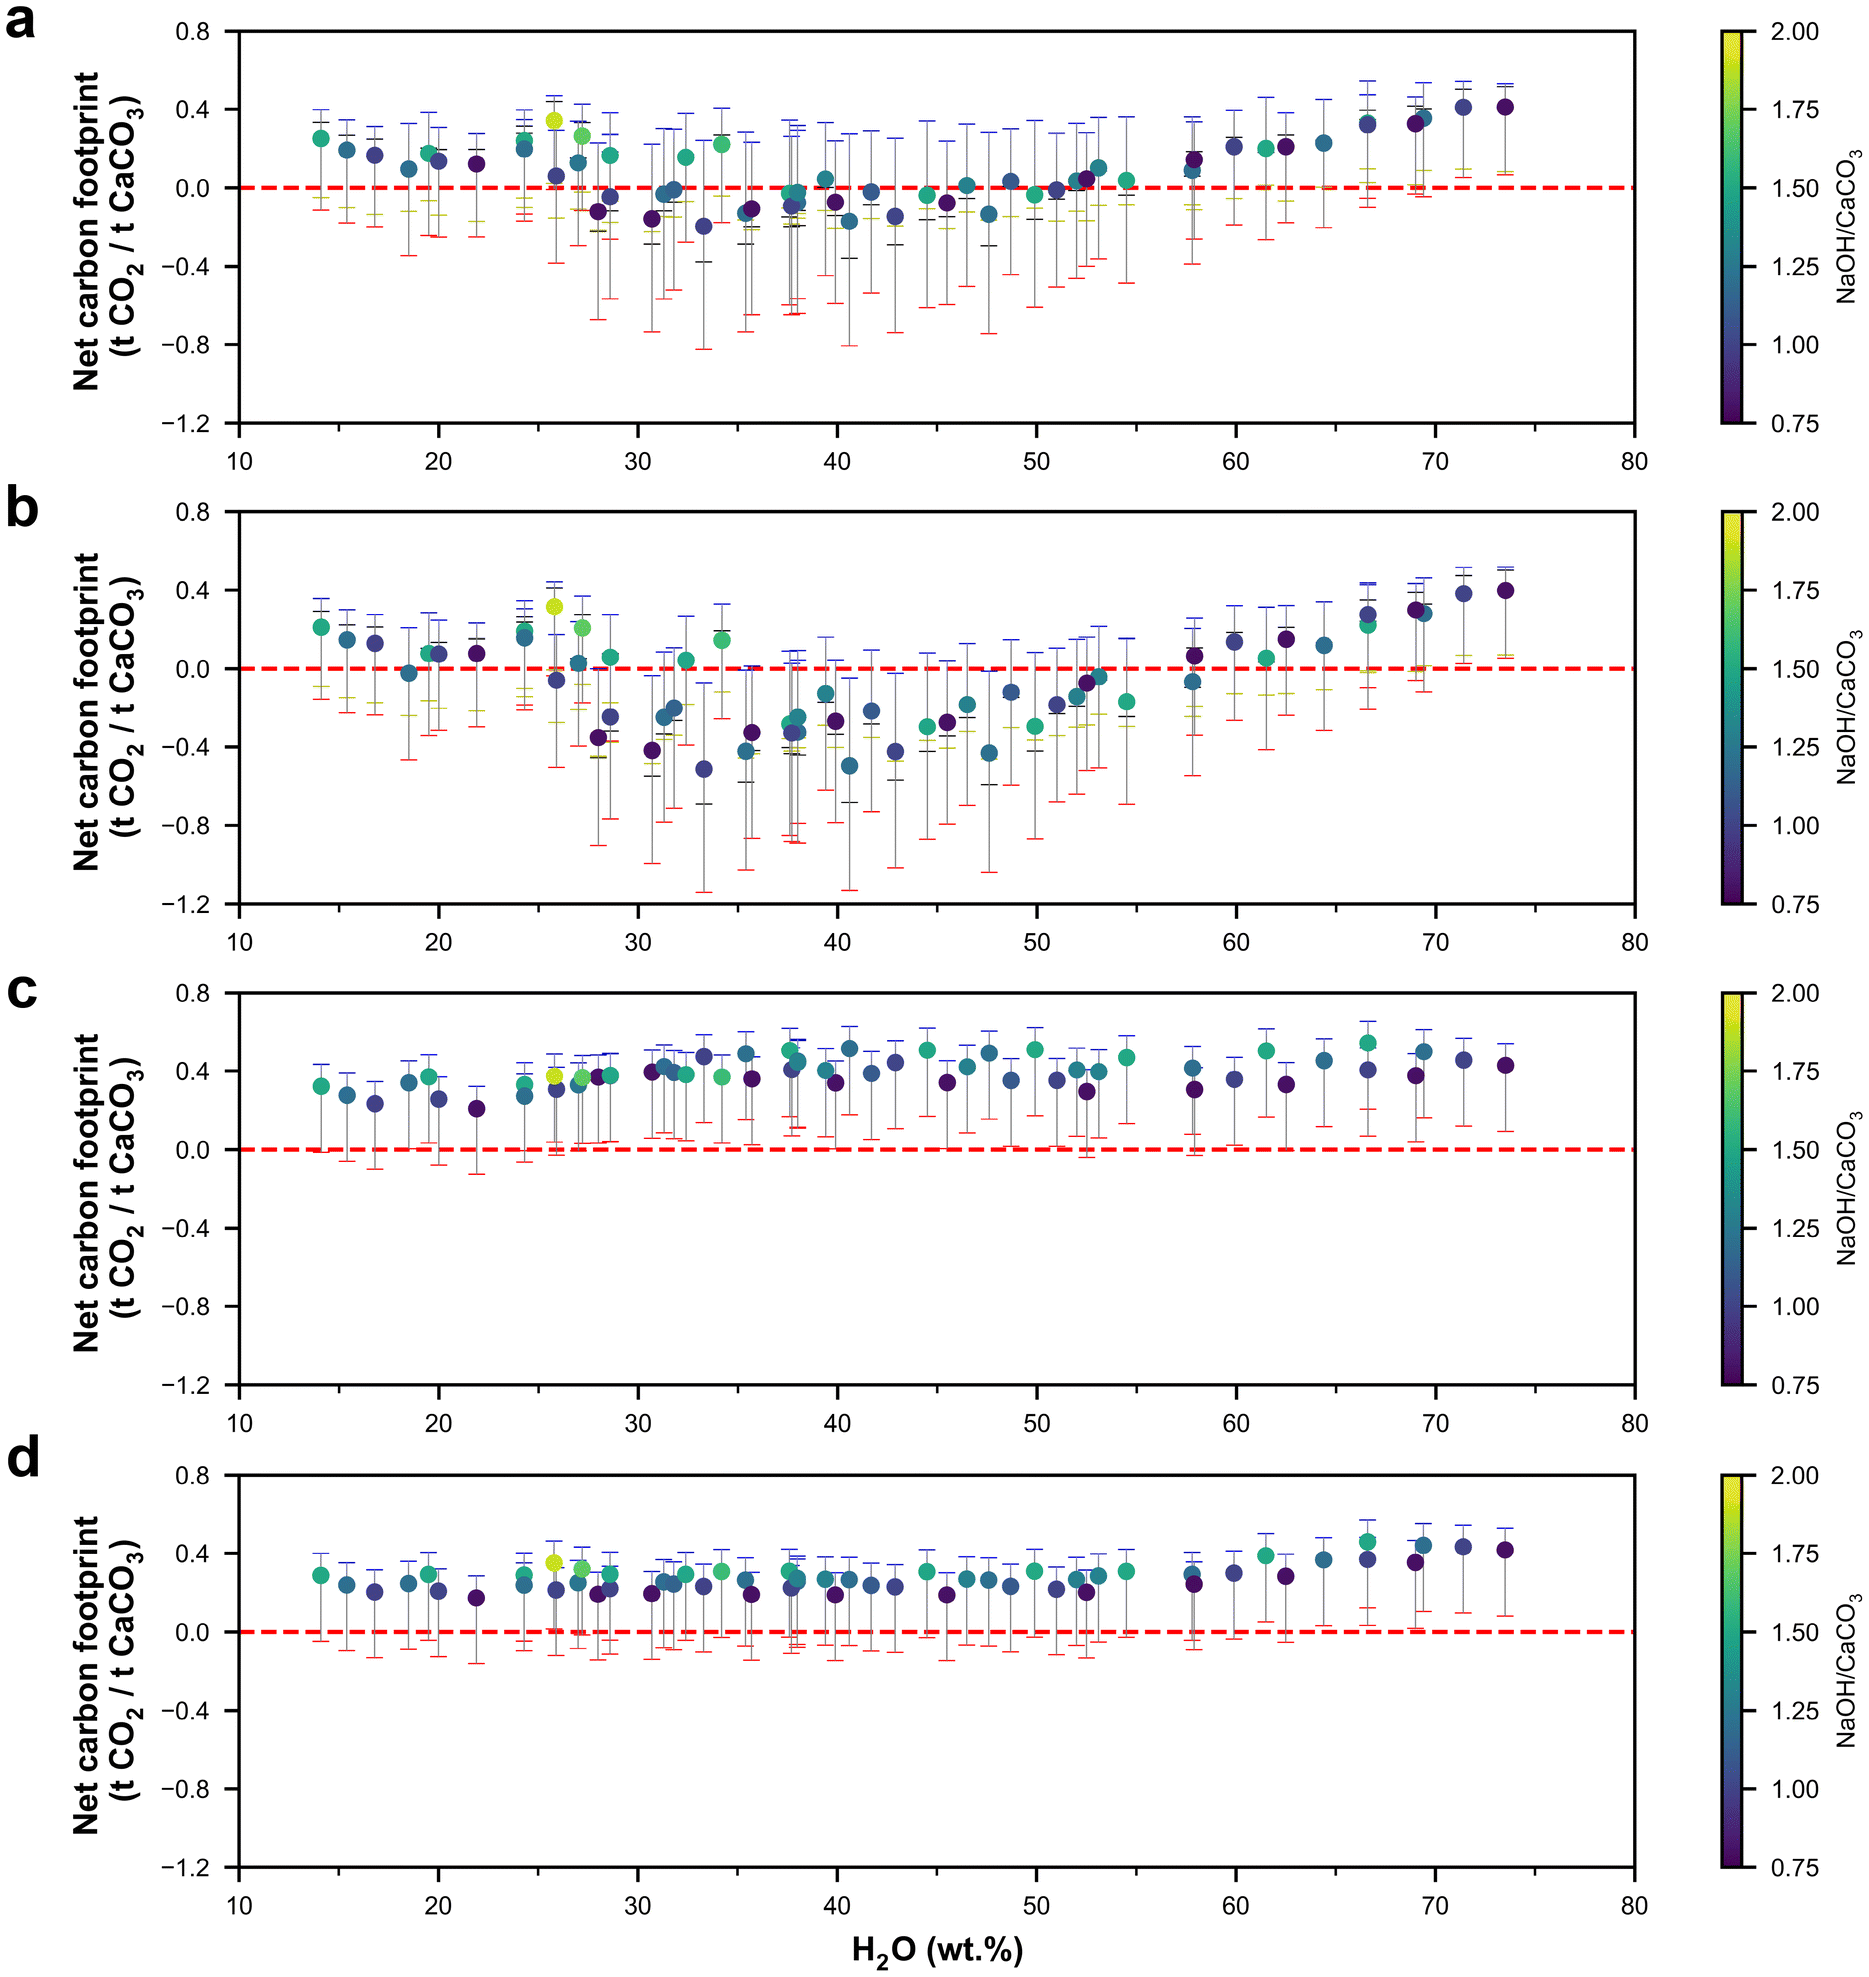 | ||
| Fig. 2 Net carbon footprint of process B expressed in t CO2 per t CaCO3 processed compared to current CaO and Na2CO3 production scenarios. The four cases of materials are plotted: (a) commercial NaOH and commercialized Na2CO3, (b) renewable NaOH and commercialized Na2CO3, (c) commercial NaOH and recycled Na2CO3, and (d) renewable NaOH and recycled Na2CO3. The solid circles show the representative net carbon footprint. The colored dashes on the error bar represent the following types of carbon footprint used while calculating the net carbon footprint: both CaO and Na2CO3 minimum carbon footprint – blue, both CaO and Na2CO3 maximum carbon footprint – red, CaO minimum and Na2CO3 maximum carbon footprint – black, and finally, CaO maximum and Na2CO3 minimum carbon footprint – yellow. The color of the points in all the figures represents the NaOH and CaCO3 ratio in the mix design, as shown in the color bar. | ||
For the cases where Na2CO3 is commercialized, the net representative carbon footprint for process A could be as low as −0.15 t CO2 per t CaCO3 processed for commercial NaOH, and −0.47 t CO2 per t CaCO3 processed for renewable NaOH. Similarly, when Na2CO3 was commercialized for process B, a minimum net representative carbon footprint of −0.20 and −0.50 t CO2 per t CaCO3 processed was achieved for commercial NaOH and renewable NaOH, respectively. When Na2CO3 was commercialized, the net representative carbon footprint was lower when the water content in the mix design was within ∼25 to 50%, compared to that for very high or low water content. The net representative carbon footprint decreased with an increase in the conversion efficiency of CaCO3 in the anion exchange process (Fig. 3a), as a lower conversion efficiency implies that a higher fraction of unreacted CaCO3 is later calcined to form CaO, which directly releases 0.44 t CO2 per t CaCO3 calcined.
 | ||
| Fig. 3 Effect of raw material types, mix design, and process type on the representative net carbon footprint of the anion exchange process. The effects of conversion efficiency on the net representative carbon footprint for process A and the control case (NaOH-commercial, Na2CO3-commercialized) are shown in (a). The changes in the net representative CO2 footprint by using renewable NaOH, recycled Na2CO3, and a combination of both are compared with the control case for processes A and B, as shown in (b). The reduction in the net representative CO2 footprint by using process B compared to process A with respect to conversion efficiency and CaCO3 content in the mixture is shown in (c) and (d), respectively. The color bar in (a) represents the ratio of NaOH to CaCO3 (in wt. %) for (a) to (c). In all the panels, hexagons represent the case of control raw materials; triangles represent NaOH-renewable, Na2CO3-commercialized; circles represent NaOH-commercial, Na2CO3-recycled; and finally squares represent NaOH-renewable and Na2CO3-recycled. | ||
In terms of effects of NaOH type and Na2CO3 usage compared to the control case (i.e., commercial NaOH and commercialized Na2CO3), using renewable NaOH reduced the net carbon footprint, and the reduction increased linearly with increasing conversion efficiency, as an increased efficiency implies that an increasing amount of NaOH is consumed per ton of CaCO3 processed (Fig. 3b). Similarly, the recycling of Na2CO3 increased the net carbon footprint linearly with increasing conversion efficiency as Na2CO3 generation increased with conversion efficiency. As recycling Na2CO3 made the net carbon footprint positive for both processes A and B, we will not further consider these cases for techno-economic assessment. Using process B instead of process A, in general, reduced the net carbon footprint, but process B had a higher net carbon footprint when the ratio of NaOH to H2O was higher than 1.5, similar to the trend observed in the net heat energy requirement in the next section (Fig. 4), as a higher amount of excess water had to be added to dissolve both Na2CO3 and NaOH to separate the Ca-containing compounds (Fig. 3d). In terms of mix design, the mix with water, NaOH, and CaCO3 contents of 33.3, 33.4, and 33.3 wt% (Experiment ID 6) provided the lowest net carbon footprint for both processes and NaOH types.
 | ||
| Fig. 4 Heating energy requirement of the anion exchange process. Total heating energy requirements from natural gas for the drying process and converting unreacted CaCO3 to CaO for processes A (a) and B (b) are shown as a function of CaCO3 content in the mix design, with the color of the scatterplot being a function of the NaOH to H2O ratio in the mix design. The reduction in heat requirement in process B compared to process A is shown in (c). The effects of total water evaporated during the anion exchange process on the total heat requirement for processes A (d) and B (e) are also plotted. The color of the scatterplot depends on the NaOH to H2O ratio in the mix design, whereas the sizes of the scatter points are proportional to the water content in the mix design. | ||
Energy requirements
The anion exchange process is energy-intensive, and the consumed energy requirements of this process mostly arise from drying/evaporation requirements in various steps and from calcining the unreacted CaCO3 into CaO. The heating energy requirements were expressed per ton of CaCO3 processed, and the heating energy requirements decreased with increasing CaCO3 content in the mix design (Fig. 4a and b) because almost all the experimental data points had CaCO3 as the limiting reagent (i.e., excess NaOH) as the goal of the anion exchange process is to convert all CaCO3 into Ca(OH)2. The heating energy requirements of process B were lower than those for process A for most of the mix designs except for the few cases when the ratio of NaOH to H2O was higher than 1.5 (Fig. 4c). A higher NaOH to H2O ratio meant that a higher amount of excess water (which was evaporated in subsequent steps) had to be added to dissolve Na2CO3 and NaOH to separate the Ca-containing compounds. Evaporating the water consumes a significant amount of energy as the latent heat of water evaporation (2.26 GJ per ton) is comparable to the heat of reaction for calcining the unreacted CaCO3 to CaO (1.78 GJ per ton). However, the amount of water evaporated during the whole anion exchange process is much higher than unreacted CaCO3 as water is added to dissolve the Na2CO3, and the total heat energy required in the process mainly depends on the total amount of water evaporated (Fig. 4d and e).Economic feasibility of the anion exchange process including carbon credits
The total cost of the anion exchange process was calculated as the sum of operating expenses (OpEx) and capital expenses (CapEx) distributed over the 50-year lifetime of the processing plant, which can process 1000 tons of CaCO3 per day. However, different relative quantities of starting materials produce different amounts of Na2CO3 and lime, and to compare the different processes and types of NaOH, we calculated the profit per ton of CaCO3 processed after selling the Na2CO3 and CaO produced. In general, the profit increased as the amount of CaCO3 in the mix design and conversion efficiency increased and was the highest for a medium NaOH to H2O ratio (Fig. S3 and S4†). None of the mix designs turned out to be profitable for process A, whether using commercial NaOH or renewable NaOH. On the other hand, process B turned a maximum profit of $3.6 per t CaCO3 and $4.2 per t CaCO3 when using commercial and renewable NaOH, respectively (Fig. S3c and S3d†). In terms of mix design, the mix with water, NaOH, and CaCO3 contents of 30.7, 30.9, and 38.4% (Experiment ID 19) provided the highest profitability for both processes and NaOH types. In most of the mix designs, the anion exchange process would not turn a profit highlighting the importance of choosing an efficient mix design, and further experiments may be performed to fine-tune the mix designs for process B to obtain higher profitability.The net carbon footprint also generally decreased with increasing profitability (Fig. S5†), as both parameters showed a strong correlation with conversion efficiency. Although the anion exchange process is profitable, the gross profit margin is relatively low (∼2% for process B). However, selling carbon credits ($80 per t CO2) arising from the net carbon footprint reduction would make this process more profitable (Fig. 5), with a gross margin of 16% for renewable NaOH and 6% for commercial NaOH. Even after selling carbon credits, the mix design with Experiment ID 19 remains most profitable for both processes and NaOH types. This mix design had a CaCO3 conversion efficiency of 69%, and thus, for 1-ton CaO production, 1.3 ton of Na2CO3 is generated and 0.49 kg of NaOH is consumed. In terms of major factors affecting the costs (Fig. 6), we found that heating energy and NaOH both contribute to almost ∼50% of the total cost each for both commercial and renewable NaOH usage, whereas selling carbon credits, and selling CaO and Na2CO3 were the major sources of revenue. The CO2 emissions had another major contributor along with NaOH and heating energy – the direct CO2 emission arising from calcining the unreacted CaCO3 to form CaO. Thus, the economic viability of the process is sensitive to changes in the price of carbon credit, natural gas, NaOH, Na2CO3, and CaO.
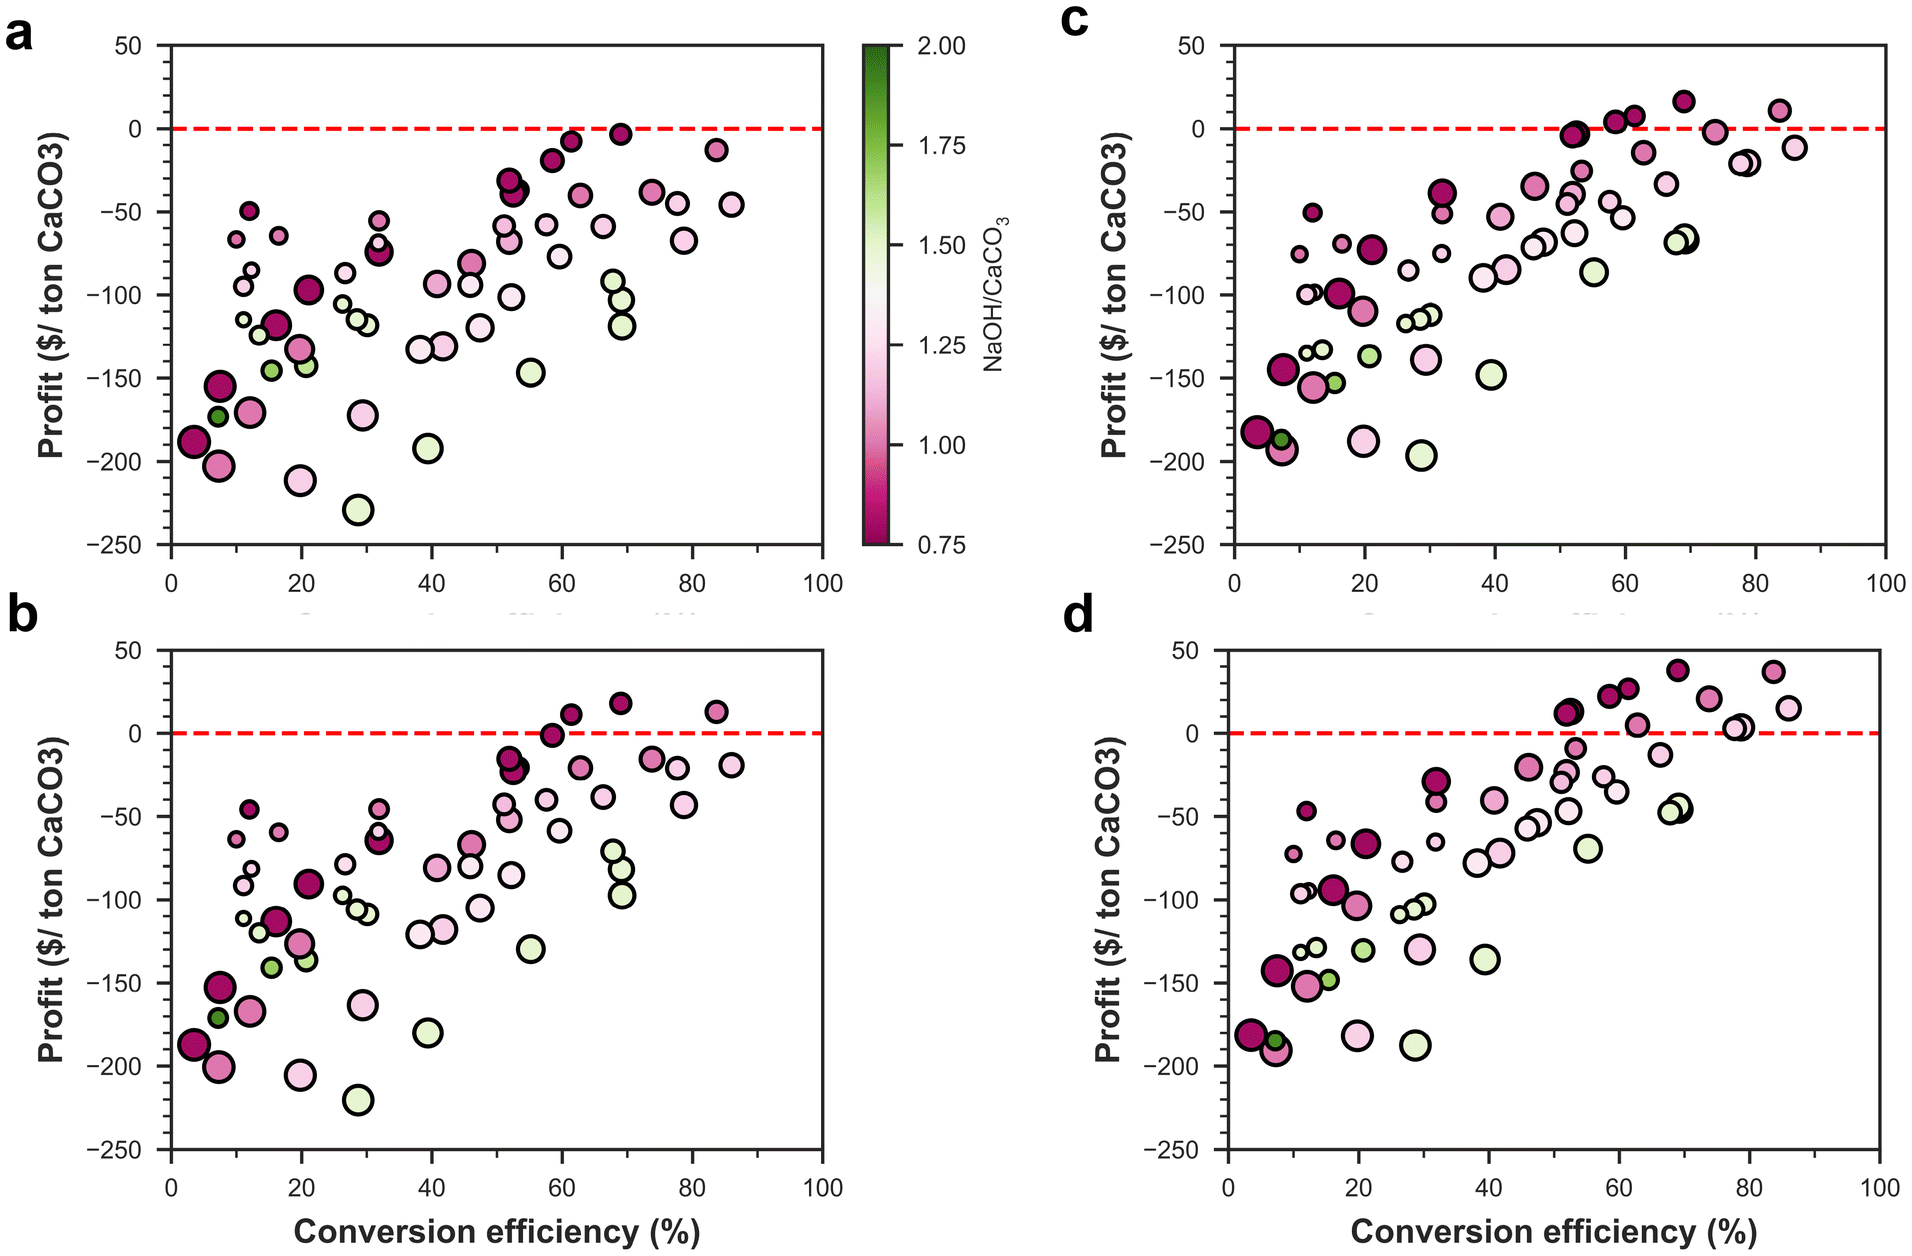 | ||
| Fig. 5 Profitability vs. net carbon footprint of the anion exchange process after selling carbon credits. Process A – (a) commercial NaOH and commercialized Na2CO3, and (b) renewable NaOH and commercialized Na2CO3. Process B – (c) commercial NaOH and commercialized Na2CO3, and (d) renewable NaOH and commercialized Na2CO3. The color of the scatterplot depends on the NaOH to CaCO3 ratio in the mix design, whereas the sizes of the scatter points are proportional to the water content in the mix design. | ||
 | ||
| Fig. 6 Different components of carbon footprint (a and b) and costs (c and d) of the anion exchange process B for the mix design Experiment ID 19 (water: 30.7, NaOH: 30.9, and CaCO3: 38.4 wt%). The cases for commercial NaOH are shown in (a) and (c), whereas renewable NaOH cases are shown in (b) and (d). | ||
Integration with the production of cementitious materials
The anion exchange process could ideally be integrated with a cement plant because the unreacted NaOH from the anion exchange reaction can be used to capture CO2 produced during Portland cement manufacturing (Fig. 7) and has been named process C. Process B was only considered for integration with the production of cement clinker as it was more economical and had a lower CO2 footprint than process A for optimized mix designs. In process C, the unreacted NaOH after the anion exchange process would react with CO2 to form Na2CO3, which can then be commercialized. This integration removes the need for lime transportation to the cement plant, reducing costs and CO2 emissions. In some cases, the amount of CO2 needed to convert all the unreacted NaOH into Na2CO3 may exceed the CO2 produced by the cement plant using the lime from the anion exchange process. In such instances, some of the products from the anion exchange reaction can be separated using the original process B. The amount of CO2 captured by NaOH to form Na2CO3 depends on the pH and temperature of the NaOH solution.32 | ||
| Fig. 7 Schematic diagram showing the integration of anion exchange process B with the cement kiln system. | ||
Considering Experiment ID 19 mix design with renewable NaOH, we found that the amount of CO2 produced by the cement plant using the lime from the anion exchange process was sufficient to convert all the unreacted NaOH into Na2CO3. Integrating the anion exchange process with a cement plant for Experiment ID 19 mix design would reduce the net carbon footprint by 0.15 t CO2 per t CaCO3 with a final net footprint of −0.45 t CO2 per t CaCO3. However, as recycling Na2CO3 to generate NaOH was not environmentally friendly, modifying a significant portion of global cement production capacity with this anion exchange process in an economically sustainable way would not currently be possible without finding a new avenue for utilizing the significant amount of Na2CO3 co-produced or realising advances in NaOH production that may allow the storage of Na2CO3 to be economical. Assuming that the annual global consumption of Na2CO3 stays unchanged (65 Mt), this anion exchange process could produce ∼50 Mt of lime, immediately reducing the global CO2 emission by 37.3 Mt per year using process B.
Challenges and opportunities of scaling up the anion exchange process
The anion exchange process should be ideally used with renewable NaOH, and if sufficient supply is not available, new production facilities of NaOH may need to be constructed. Renewable NaOH production requires the availability of renewable electricity, and constructing a new NaOH production facility for the anion exchange process may improve economics through vertical integration at the cost of increased initial investment. One of the ways to decrease the initial investment cost would be to re-purpose equipment currently used for the Na2CO3 production process, such as filtration columns, distillation columns, pumps, etc.Currently, the Na2CO3 and Ca(OH)2 production processes are decoupled, as the modified Solvay process (or Hou's process) no longer uses CaO to regenerate NH3, the catalyst used in the original Solvay method. Adopting co-production of Na2CO3 and Ca(OH)2 would change the current global material flow, which may affect the costs and CO2 footprint of transporting these materials from the production location to the customers. The limited global demand for Na2CO3 compared to that for Ca(OH)2 (including potential demand for Portland cement production) is one of the bottlenecks of scaling-up the anion-exchange process beyond satisfying the global Na2CO3 demand. Potential avenues of increased usage of Na2CO3 are in glass production, water purification, and the construction industry, including activating secondary raw materials (slags) with Na2CO3 (∼5 wt% of slag)33,34 to reduce the global clinker demand and thus reduce global CO2 footprint.35
To understand the effect of pricing volatility and changing carbon footprint associated with the materials involved in the anion exchange process, we performed a sensitivity analysis of the anion exchange process for the mix design Experiment ID 19 (water: 30.7, NaOH: 30.9, and CaCO3: 38.4 wt%), when the various factors were changed by 20% (Fig. 8). The economic feasibility of this anion-exchange process is highly sensitive to the market price of the major input and output raw materials, i.e., Na2CO3, NaOH, and CaO, apart from CaCO3, as CaCO3 is inexpensive compared to the other materials. Heating energy is also one of the key parameters – and the high volatility in the price of natural gas (or any other fuel) needs to be considered when implementing this process. The initial investment cost and fixed operating expense do not influence the economic feasibility of this simple process. Similarly, the net CO2 footprint of the process is also primarily sensitive to the CO2 footprint of the raw materials other than CaCO3 and heating energy. The CO2 emission and cost of the anion exchange process could be further lowered by electrifying the industrial process heat used.36,37
 | ||
| Fig. 8 Effects of different factors on the profitability (a) and CO2 emissions (b) of the anion-exchange process. The sensitivity of the profit and CO2 footprint was calculated when the cost and CO2 footprints were lowered (“low”) or increased (“high”) by 20%. The analysis was performed for process B for the mix design Experiment ID 19 (water: 30.7, NaOH: 30.9, and CaCO3: 38.4 wt%) for both renewable and commercial NaOH cases. | ||
Conclusions
We show that the co-production of CaO and Na2CO3 using the anion exchange process could reduce the carbon emissions economically today through the industrial symbiosis of the soda ash and lime manufacturing, especially if NaOH produced from renewable energy is used. Separating the Ca-containing compounds (CaCO3 and Ca(OH)2) first from the mixture of reactants and products after the anion exchange reaction seemed to be more economically and environmentally efficient than separating the Na-containing compounds at the beginning. The most efficient mix design (water: 30.7, NaOH: 30.9, CaCO3: 38.4 wt%) had a net profit of $43.5 per t CaCO3 processed and reduced the carbon footprint by 0.31 t CO2 per t CaCO3 compared to the current production process.Decarbonizing a significant portion of the cement industry using this technology requires new avenues for utilizing the Na2CO3 produced and significant developments in global NaOH production, as recycling Na2CO3 to regenerate NaOH was not economically and environmentally favorable. The proposed process is highly sensitive to the CO2 emissions and market price associated with NaOH and Na2CO3, and the supply of heating energy.
We show that this anion exchange technology, even when using natural gas to supply heating energy, can be used immediately to decarbonize the lime and soda ash industries. When NaOH produced using renewable energy is utilized to produce soda ash and lime employing process B, an annual reduction of 37.3 Mt CO2 emission can be achieved compared to the current production process.
Data availability
The data supporting the findings of this study are included within the main article and the ESI.†Conflicts of interest
Theodore Hanein is a shareholder in United earth4Earth Holding.Acknowledgements
T. Hanein was funded by a UKRI Future Leaders Fellowship (MR/V023829/2). T. Hanein and A. Baral were funded by EPSRC project EP/W018810/2.References
- S. C. Rasmussen, in How Glass Changed the World: The History and Chemistry of Glass from Antiquity to the 13th Century, ed. S. C. Rasmussen, Springer Berlin Heidelberg, Berlin, Heidelberg, 2012, pp. 11–19. DOI:10.1007/978-3-642-28183-9_2.
- D. M. Kiefer, Todays Chemist at Work, 2002, vol. 11, pp. 87–91 Search PubMed.
- A. Scott, C&EN Global Enterprise, 2023, 101, 20–22 Search PubMed.
- W. H. Gourdin and W. D. Kingery, J. Field Archaeol., 1975, 2, 133–150 CAS.
- S. K. Dash and M. Hussain, J. Mater. Civ. Eng., 2012, 24, 707–714 Search PubMed.
- S. Lim, W. Jeon, J. Lee, K. Lee and N. Kim, Water Res., 2002, 36, 4177–4184 Search PubMed.
- C. W. Gray, S. J. Dunham, P. G. Dennis, F. J. Zhao and S. P. McGrath, Environ. Pollut., 2006, 142, 530–539 Search PubMed.
- M. Samari, F. Ridha, V. Manovic, A. Macchi and E. J. Anthony, Mitigation and Adaptation Strategies for Global Change, 2020, vol. 25, pp. 25–41 Search PubMed.
- M. Simoni, M. D. Wilkes, S. Brown, J. L. Provis, H. Kinoshita and T. Hanein, Renewable Sustainable Energy Rev., 2022, 168, 112765 Search PubMed.
- U. S. Geological Survey , Mineral Commodity Summaries 2024, Report 2024, Reston, VA, 2024.
- P. J. Monteiro, S. A. Miller and A. Horvath, Nat. Mater., 2017, 16, 698–699 Search PubMed.
- C. F. Dunant, S. Joseph, R. Prajapati and J. M. Allwood, Nature, 2024, 629, 1055–1061 CrossRef CAS PubMed.
- M. Rumayor, A. Dominguez-Ramos and A. Irabien, ACS Sustainable Chem. Eng., 2020, 8, 11956–11966 CrossRef CAS.
- Energy Transitions Commission, Mission Possible: Reaching Net-Zero Carbon Emissions from Harder-to-Abate Sectors by Mid-Century, 2018, https://www.energy-transitions.org/publications/mission-possible/ Search PubMed.
- T. Hanein, M. Simoni, C. L. Woo, J. L. Provis and H. Kinoshita, Energy Environ. Sci., 2021, 14, 6595–6604 Search PubMed.
- M. Simoni, T. Hanein, C. L. Woo, J. Provis and H. Kinoshita, ACS Sustainable Chem. Eng., 2022, 10, 11913–11925 CrossRef CAS PubMed.
- M. Simoni, T. Hanein, C. L. Woo, M. Nyberg, M. Tyrer, J. L. Provis and H. Kinoshita, RSC Adv., 2022, 12, 32070–32081 Search PubMed.
- IMARC Group, Caustic Soda Market Report by Product Type (Lye, Flake, and Others), Manufacturing Process (Membrane Cell, Diaphragm Cell, and Others), Grade (Reagent Grade, Industrial Grade, Pharmaceutical Grade, and Others), Application (Alumina, Inorganic Chemicals, Organic Chemicals, Food, Pulp, and Paper, Soap and Detergents, Textiles, Water Treatment, Steel/Metallurgy-Sintering, and Others), and Region 2024–2032, https://www.imarcgroup.com/caustic-soda-market/methodology.
- E. T. Hessen, T. Haug-Warberg and H. F. Svendsen, Chem. Eng. Sci., 2010, 65, 3638–3648 Search PubMed.
- International Organization for Standardization, Environmental management—Life cycle assessment—Requirements and guidelines, ISO 14044:2006, 2006 Search PubMed.
- G. Wernet, C. Bauer, B. Steubing, J. Reinhard, E. Moreno-Ruiz and B. Weidema, Int. J. Life Cycle Assess., 2016, 21, 1218–1230 Search PubMed.
- G. Towler and R. Sinnott, in Chemical Engineering Design, ed. G. Towler and R. Sinnott, Butterworth-Heinemann, Boston, 2nd edn, 2013, pp. 307–354. DOI:10.1016/B978-0-08-096659-5.00007-9.
- U.S. Bureau of Labor Statistics, Producer Price Indexes, https://www.bls.gov/ppi/.
- Chemical Engineering, The Chemical Engineering Plant Cost Index, https://www.chemengonline.com/pci-home.
- UN Comtrade, UN Comtrade Database, https://comtradeplus.un.org/.
- Methanol Institute, Methanol price and supply/demand, https://www.methanol.org/methanol-price-supply-demand/.
- Eurostat, Gas prices for non-household consumers - bi-annual data (from 2007 onwards), 2024, https://ec.europa.eu/eurostat/databrowser/view/nrg_pc_203/settings_1/table?lang=en.
- Eurostat, Electricity price statistics, https://ec.europa.eu/eurostat/statistics-explained/index.php?title=Electricity_price_statistics#Electricity_prices_for_non-household_consumers.
- WindEurope, Wind energy in Europe in 2019 - Trends and statistics, Brussels, Belgium, 2020 Search PubMed.
- Eurostat, Labour cost levels by NACE Rev. 2 activity, 2022. https://ec.europa.eu/eurostat/databrowser/view/lc_lci_lev/default/table?lang=en%20 Search PubMed.
- E. Moreno Ruiz, D. FitzGerald, A. Symeonidis, D. Ioannidou, J. Müller, L. Valsasina, C. Vadenbo, N. Minas, T. Sonderegger and D. Dellenbach, Documentation of changes implemented in the ecoinvent database v3.8, Zürich, Switzerland, 2021 Search PubMed.
- M. Yoo, S.-J. Han and J.-H. Wee, J. Environ. Manage., 2013, 114, 512–519 CrossRef CAS PubMed.
- B. Yuan, Q. L. Yu and H. J. H. Brouwers, Cem. Concr. Compos., 2017, 84, 188–197 CrossRef CAS.
- A. F. Abdalqader, F. Jin and A. Al-Tabbaa, J. Cleaner Prod., 2016, 113, 66–75 CrossRef CAS.
- I. H. Shah, S. A. Miller, D. Jiang and R. J. Myers, Nat. Commun., 2022, 13, 5758 CrossRef CAS PubMed.
- M. Wei, C. A. McMillan and S. de la Rue du Can, Curr. Sustainable/Renewable Energy Rep., 2019, 6, 140–148 Search PubMed.
- D. Schüwer and C. Schneider, in Leading the low-carbon transition: ECEEE Industrial Summer Study; 11-13 June 2018, Berlin, Germany; proceedings, Europ. Council for an Energy Efficient Economy, Stockholm, 2018, pp. 411–422 Search PubMed.
Footnote |
| † Electronic supplementary information (ESI) available. See DOI: https://doi.org/10.1039/d4gc05568c |
| This journal is © The Royal Society of Chemistry 2025 |