
 Open Access Article
 This Open Access Article is licensed under a
 Creative Commons Attribution 3.0 Unported Licence
Activation and electrochemical reduction of carbon dioxide by transition metal atom-doped copper clusters†
Manish Kumar
Mohanta
 and
Puru
Jena
*
and
Puru
Jena
*
Department of Physics, Virginia Commonwealth University, Richmond, Virginia 23284, USA. E-mail: pjena@vcu.edu
First published on 17th February 2025
Abstract
The conversion of CO2 into valuable chemical products has garnered significant interest due to the pressing need for sustainable solutions. Central to achieving this goal is the development of efficient and cost-effective catalysts. Although Cu is one of the most promising materials for CO2 reduction, it lacks selectivity. In this study, we explore the effect of doping on the binding affinity and activation of CO2 by focusing on XCu12 clusters, where X represents 3d and 4d transition metal atoms. By employing a multi-scale theoretical approach that integrates the artificial bee colony algorithm, an extended tight binding model, and density functional theory (DFT), the lowest energy geometries of XCu12 clusters were determined, revealing that the dopant X-atoms favour endohedral positions, preserving a cage-like structure and maximizing their coordination with the outer Cu-atoms. A thorough analysis of the structural, electronic, and magnetic properties elucidates the varying capabilities of these clusters for the electrochemical reduction of CO2 to CO. Doping of transition metal atoms is found to significantly modify the electronic and magnetic properties of the clusters, enhancing their reactivity towards CO2. A significant reduction of about 20% in overpotential for CO2 reduction is observed in doped clusters compared to the pure Cu13 cluster. An empirical formula is proposed by fitting the DFT data using ordinary least squares (OLS) regression. This comprehensive study provides fundamental insights into the potential of bimetallic copper clusters for CO2 activation and reduction, emphasizing their role in advancing catalytic processes for sustainable chemical production.
1. Introduction
An increase in CO2 concentration in the environment due to the use of fossil fuels is an existential threat to society. Considerable efforts are being made to develop technologies not only for minimizing the emission of CO2 but also for its capture, sequestration, and conversion to useful chemicals such as formic acid, carbon monoxide, ethanol, and other value-added products.1,2 Because CO2 is an extremely stable molecule that not only requires 750 kJ mol−1 energy for dissociation but also involves a multielectron process,3 converting it into useful chemicals is a challenging task; the first step is to bind, activate, and dissociate it at a low energy cost.4,5Copper is found to be one of the best candidates that can reduce CO2 to more than thirty different hydrocarbons and oxygenates.6–8 Hence, research on electrochemical reduction of CO2 (eCO2R) is primarily focused on Cu-based surfaces. However, it lacks selectivity. The faradaic efficiency for ethylene formation on polyamine-incorporated Cu electrode9 does not surpass 40% at a current density 200 mA cm−2. Experimental studies on the catalytic performance of Al2O3-supported copper nanoclusters (n = 3, 4, 20) in CO2 hydrogenation to methanol have shown that catalytic efficiency is greatly influenced by cluster size. Among the tested catalysts, Cu4/Al2O3 exhibited the highest activity, while Cu3/Al2O3, with one fewer copper atom, showed a significant drop in performance, deviating from the size-dependence trend seen in gas-phase clusters.10–12 The ligated metal nanoclusters have also demonstrated enhanced electrocatalytic activity for CO2 reduction.13–15 Recent studies have highlighted the unique electronic and catalytic behaviour of size-selected subnanomater transition metal clusters, setting them apart from metal surfaces and larger nanoparticle systems.16–18 Recent experimental findings have demonstrated the efficient formation of C2 products on small copper clusters incorporated into mesoporous carbon spheres, metal–organic frameworks or copper coordination polymers.19–23
Recent efforts focus on identifying new active sites and probing the activation mechanism theoretically.24–29 Atomic clusters offer an added advantage not only because most of the atoms are surface atoms but also because the surface topology is very different from the planar surface. Past DFT studies have shown that small copper clusters (Cu4) are excellent candidates for the activation of CO2 molecules.30,31 This work instead focuses on the icosahedral Cu13 cluster as an ideal platform where all the surface atoms are equivalent by symmetry. In addition, the electronic structure of Cu13 cluster can be further modified by doping where one of the Cu atoms is replaced by either a 3d (Sc, Ti, V, Cr, Mn, Fe, Co, Ni, Zn) or a 4d (Y, Zr, Nb, Mo, Tc, Ru, Rh, Pd, Ag, Cd) transition metal atom, X. Note that the number of outer electrons of 3d and 4d transition metal atoms vary from 3 in Sc (Y) to 12 in Zn (Cd). With each Cu atom contributing one electron to the valence pool, the total number of electrons taking an active part in a chemical reaction varies from 15 in ScCu12 (YCu12) to 24 in ZnCu12(CdCu12). In addition, the magnetic moments of the transition metal atoms also vary across the 3d and 4d series with Zn and Cd having no unpaired spins and each Cr and Mo atom having the largest magnetic moment of 6 μB. Interestingly, Cu13, AgCu12, and ZnCu12 clusters composed entirely of non-magnetic elements are found to possess large magnetic moments. Recent experiments have led to the successful synthesis of atomically precise copper-rich bimetallic superatom clusters.32
The influence of the electronic and magnetic structure on CO2 binding and activation is systematically explored by doping transition metal (TM) atoms, X, into the Cu13 cluster, forming XCu12 bimetallic clusters. To calculate the overpotential in the electrochemical CO2 reduction reaction (CO2RR), we focused exclusively on 3d-atom doped XCu12 clusters, specifically Cr/Mn/Fe/Co/Ni/Cu-Cu12. We aim to establish a connection between the properties of these doped clusters and their effect on CO2RR performance.
2. Computational details
The first step in our calculation is to determine the equilibrium geometry of XCu12 clusters (X = any of the 3d or 4d atoms). Note that the Cu13 cluster is icosahedral with the central atom surrounded by 12 surface atoms. When an X atom is used to replace a Cu atom, it can either occupy the interior site of the icosahedron or one of the surface sites. We used the Artificial Bee Colony (ABC) algorithm implemented in the ABCluster program to classify initial global minimum energy conformation/structure (GMEC).33,34 The ABC algorithm combined with eXtended tight binding (denoted as ABC-xTB) was found to be an effective approach to evaluating GMEC with the accuracy of the first-principle method. The initial structures obtained from the ABC-xTB calculations were further optimized using spin unrestricted density functional theory (DFT) with hybrid exchange–correlation potential, B3LYP (Becke 3-parameter Lee–Yang–Parr hybrid functional)35,36 and the def2-TZVP basis set37 implemented in the Gaussian16 package.38 The effect of van der Waals interaction on the chemisorption of CO2 molecule is incorporated using Grimme's D3 dispersion scheme.36,39 We have considered all possible spin multiplicities for each geometry to ensure the robustness of the ground-state search. Further, vibrational-frequency analysis ensures that a single imaginary frequency corresponds to the transition state. The spin population analysis is carried out using the Multiwfn program.40 The CO2 reduction calculation is performed using the Vienna ab initio simulation package (VASP) details of which are provided in the ESI.†![[thin space (1/6-em)]](https://www.rsc.org/images/entities/char_2009.gif) 41–44
41–44
3. Results and discussion
3.1 Geometry, stability, electronic, and magnetic properties of transition metal-doped XCu12 bimetallic neutral clusters
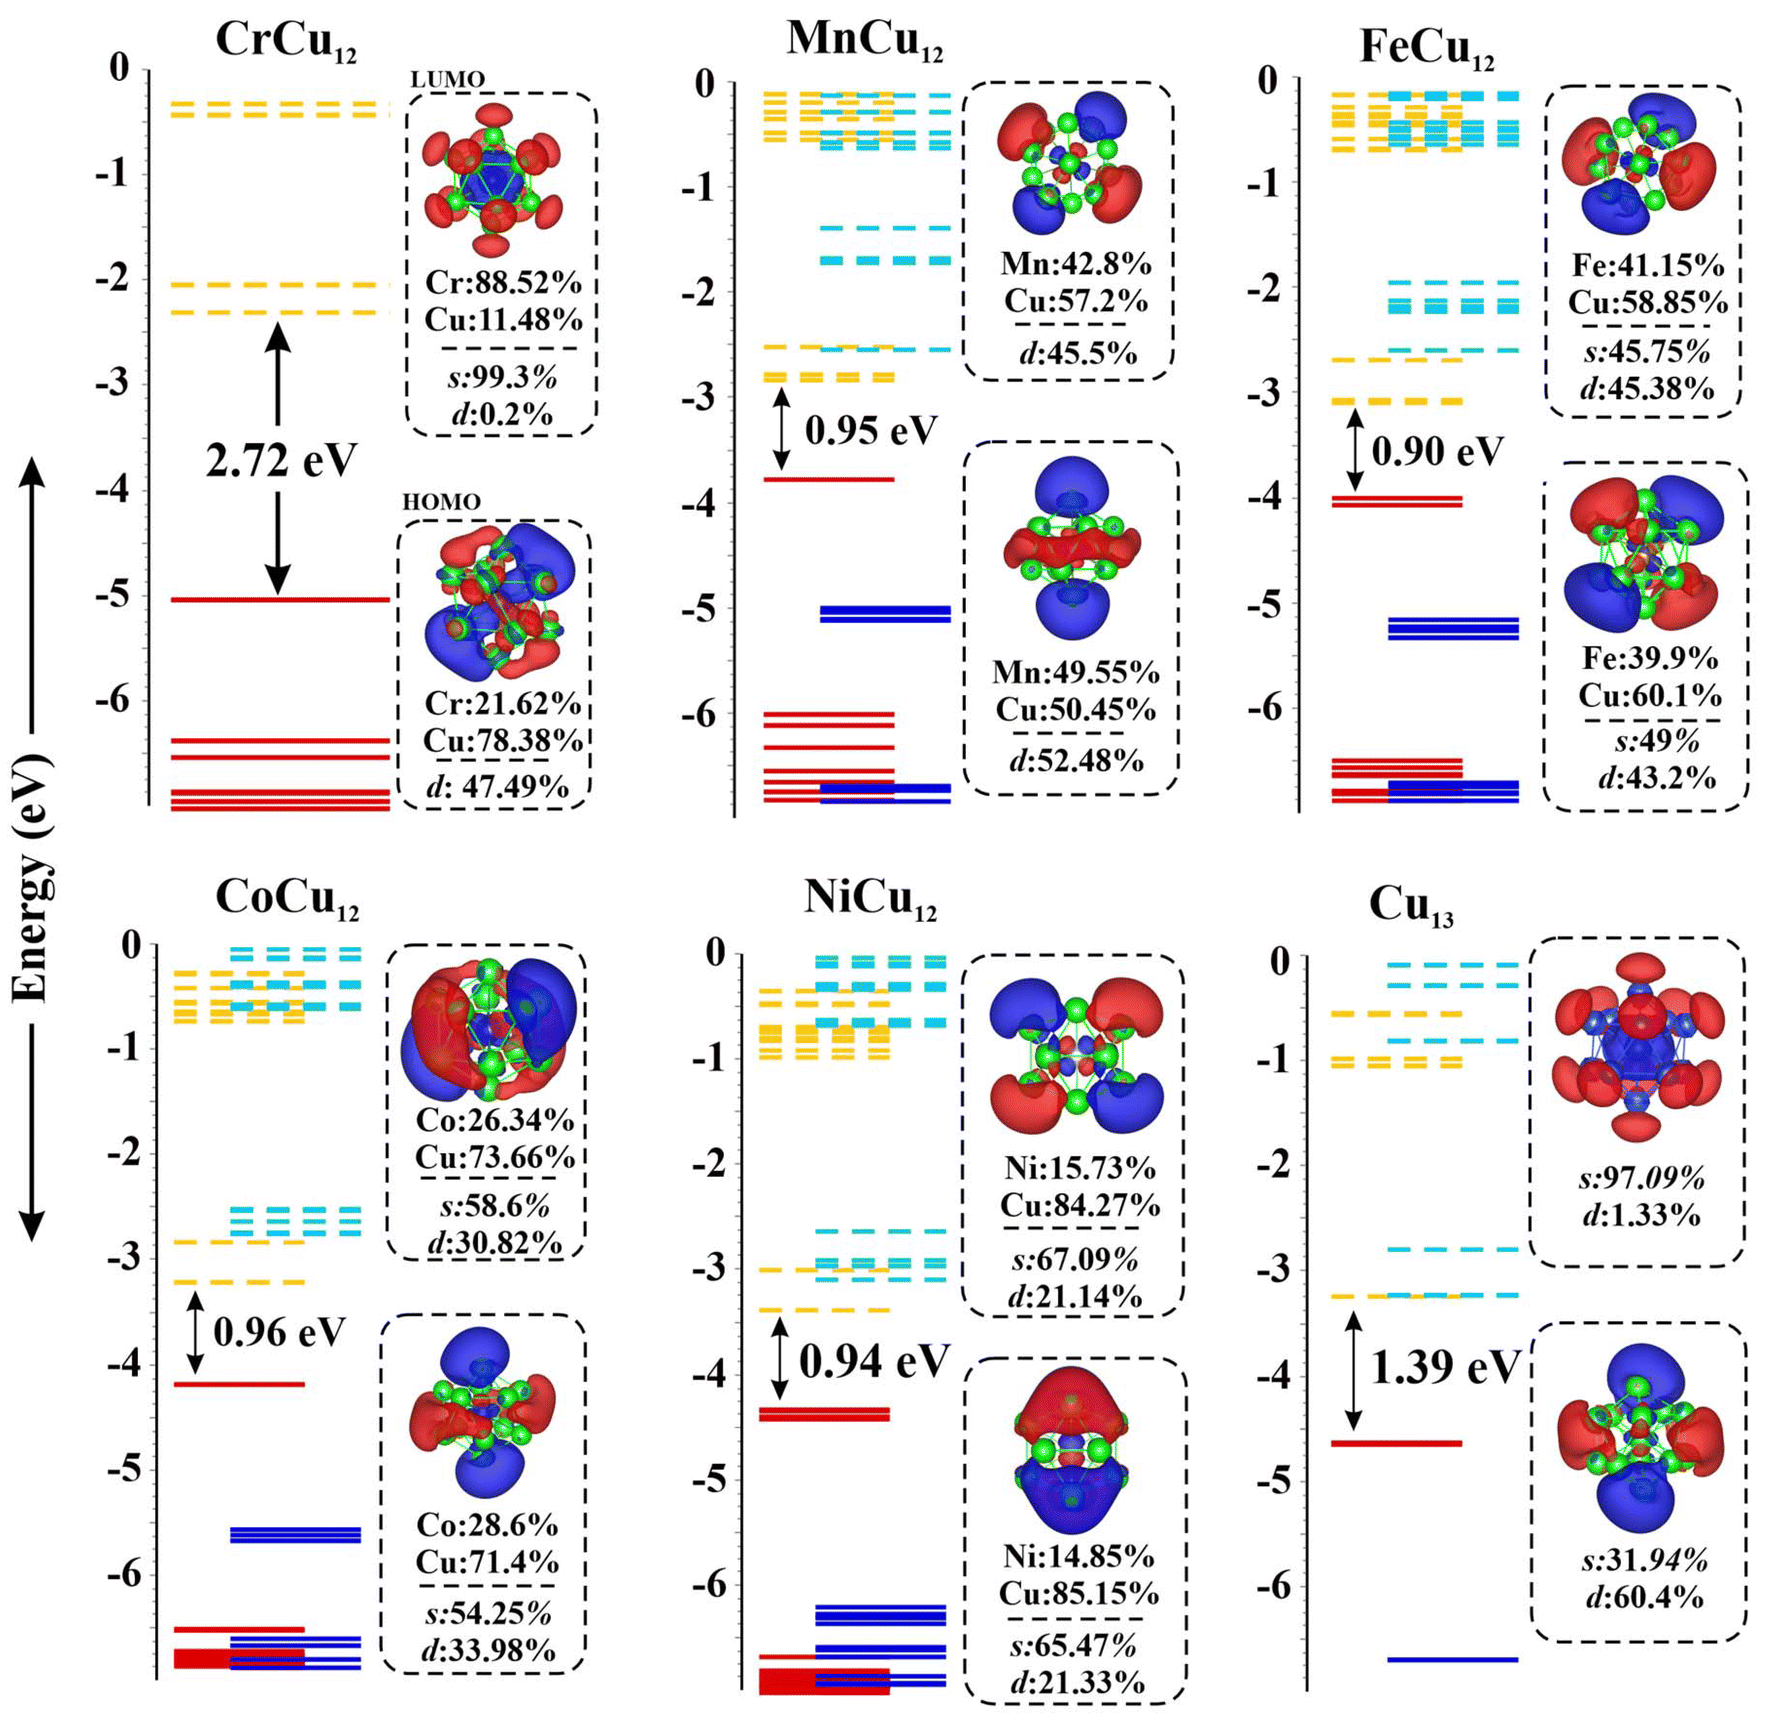
As an example of the search of the phase space carried out by using the ABCluster algorithm without any symmetry constraint, we present a list of initial structures sorted by energy for CrCu12 in Fig. 1(a). These were further optimized using DFT. The surface site occupancy of the dopant was found to be 10.3 eV higher than the central site occupancy in the case of CrCu12 as indicated in Fig. 1(b). In all cases, we found that the TM atoms, X, occupy the central site, maintaining a cage structure and maximizing their coordination with the surface Cu atoms. All clusters are found to be dynamically stable with no imaginary frequencies. The coordinates of a few selected atoms can be found in ref. 45. Only four clusters (e.g., Cu13, CrCu12, MoCu12, and AgCu12) are found to retain perfect icosahedral symmetry. Among these, Cu13 and AgCu12 clusters are isoelectronic while CrCu12 and MoCu12 clusters adhere to the 18-electron shell closure rule. For small clusters such as Sn-doped Cu4 clusters studied by Tommaso et al.,46 the catalytic reaction occurs at a new active site Sn which is different from this work.47 In all XCu12 clusters, only the Cu atoms are exposed to catalytic reaction, making it easy to study the effect of doping on CO2 binding and activation. | ||
| Fig. 1 (a) Guess structures of CrCu12 cluster sorted by their energy; (b) energy difference between its two different configurations, cluster C-1 where Cr is positioned at the centre of the icosahedral and C-2 where Cr is positioned at the surface site; (c) substitutional energy and (d) vertical ionization potential of all the transition metal atom-doped clusters. | ||
Now, to understand the influence of transition metal atoms on the stability of XCu12 clusters, the substitutional doping energy for a single dopant atom X in the Cu13 cluster is calculated using the following equation.48
 | (1) |
Here, E(X), E(Cu) and E(XCu12, Cu13) represent the total energies of transition metal atoms, copper atoms, and XCu12 and Cu13 clusters, respectively. The positive Esub value indicates that the substitution process is endothermic and hence unfavourable. The results are plotted in Fig. 1(c). Among the 3d- and 4d-series, CrCu12 and MoCu12 clusters, respectively, are found to be the most stable structures due to the 18-electron shell closure rule while ZnCu12, AgCu12, and CdCu12 clusters are less stable than the Cu13 cluster.
The vertical ionization potentials (IP) are calculated using the following equation.
| IP = Etot(N − 1) − Etot(N) | (2) |
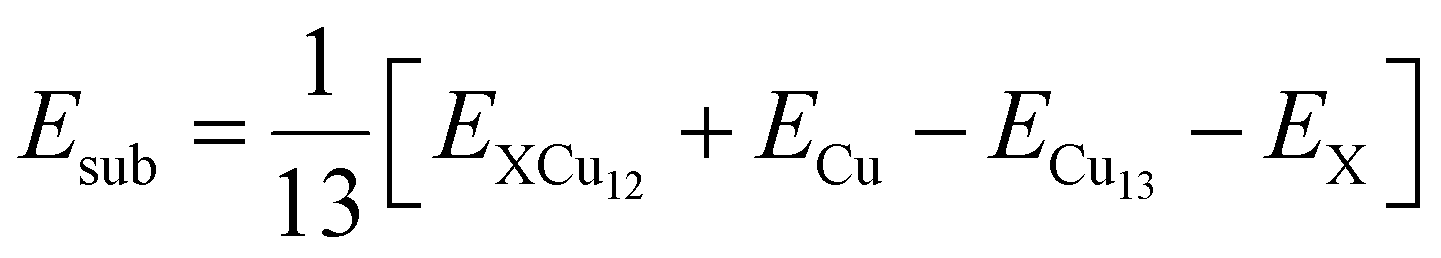
The highest occupied molecular orbital (HOMO) and the lowest unoccupied molecular orbital (LUMO) of the Cr/Mn/Fe/Co/Ni/Cu-Cu12 clusters are plotted in Fig. 2 for a systematic comparison. Note that the MOs of the Cr atom are consistent with it being found in a “spherically symmetric” potential well with orbital occupancy as 1s21p61d102s2. A notable decrease in the HOMO–LUMO gap, ranging from 2.72 eV to approximately 0.9 eV, is observed when Cu is substituted by various transition metals (TM), highlighting the impact of dopants on electronic properties. Fig. 2 highlights the shift in the relative contributions of various molecular orbitals to both the HOMO and LUMO. Fig. S1† depicts the distribution of percentage contributions from transition metal (X) atoms in the HOMO and LUMO, showing that Cu contributes about 75% to the HOMO, whereas transition metal atoms account for nearly 80% of the LUMO.49 Fig. S2† displays the molecular surface map of the average local ionization energy (Ī), revealing that the outer Cu atoms are the most favourable sites for electrophilic attack, playing a crucial role in cluster–molecule interactions.
 | ||
| Fig. 2 Molecular orbital maps of HOMO and LUMO of the Cr/Mn/Fe/Co/Ni/Cu-Cu12 clusters; solid and dashed lines represent occupied and unoccupied states. | ||
3.2 Magnetic properties of transition metal-doped XCu12 bimetallic clusters
The 3d and 4d elements have partially filled d-shells, leading to magnetic moments that vary based on the number of electrons in the d-orbitals. These values are illustrated in Fig. S2(b).† They range from 1μB in Sc (Y), peak at 6μB in Cr (Mo), and diminish to zero in Zn (Cd). When the transition metal atoms are doped into the copper cluster, the unpaired d-electrons contribute to the copper cluster, modifying the net spin magnetic moment. To determine the preferred magnetic moments of XCu12 clusters, we calculated the total energies for various spin multiplicities with the findings summarized in Table S1.† Fig. S2(b)† compares the total preferred magnetic moments of all clusters with those of isolated 3d and 4d transition metal atoms. Notably, the magnetic moments decrease from ScCu12 (YCu12) to CrCu12 (MoCu12) where they are completely quenched following the 18-electron shell-closure rule. The magnetic moments then increase, reaching a maximum at Cu13 (AgCu12), exhibiting a magnetic moment of 5μB. Interestingly clusters like Cu13, AgCu12, and ZnCu12 are composed of non-magnetic elements, yet they show significant magnetic moments. Among the transition metals studied, Ti/Zr and Co/Rh uniquely retain their atomic magnetic moment when embedded in the Cu13 cluster.3.3 Adsorption and activation of CO2 on XCu12 clusters
To catalytically convert CO2, the first critical step is to examine its adsorption on the catalyst surface, distinguishing between physisorption and chemisorption and evaluating the molecule's activation level. In the physisorbed state, CO2 maintains its gas phase geometry with a C–O bond length of 1.18 Å and an O–C–O bond angle of 180°. In contrast, chemisorption results in elongated C–O bonds and a loss of linearity, with the linear O![[double bond, length as m-dash]](https://www.rsc.org/images/entities/char_e001.gif) CO becoming bent signifying the activation of the CO2 molecule.
CO becoming bent signifying the activation of the CO2 molecule.
The effect of the surface topology on the adsorption of CO2 is studied by focusing on a flat Cu (111) surface, Cu13, Cu18, and Cu24 clusters. Our choice of Cu18, Cu24 clusters was motivated by the fact that their geometries are available on the database.50 The resulting geometries with interacting CO2 are given in Fig. S3.† The CO2 molecule interacts differently as seen from the change in bond length and bond angle. It is weakly bound at a distance of 3.1 Å from the Cu (111) surface with a C–O bond length of 1.17 Å and ∠OCO bond angle of 178.9°, remaining close to their pristine gas-phase values of 180° and 1.18 Å, respectively. The binding energy of CO2 on the Cu (111) surface, as defined in eqn (3), is 0.21 eV. In contrast, the CO2 binding energy on the Cu13 cluster is significantly higher, reaching 2.18 eV. In addition, the CO2 undergoes significant bending with ∠OCO bond angle of 134.9° and ∼8.7% bond elongation (1.28 Å), reflecting the effect of the surface morphology of the Cu-cluster. In an earlier study on cobalt porphyrin nanotubes, Sun and coworkers51 also observed the effect of surface morphology on chemical reactions. A comparative plot of CO2 chemisorption on a larger copper cluster is shown in Fig. S3.† While surface morphology significantly influences CO2 activation, this study primarily focuses on the effects of doping.
Our subsequent study focused on the interaction between CO2 and the XCu12 clusters. In Fig. 3, we present the optimized geometries of a few clusters. Notably, even though CrCu12 is an electronically close-shell system, the ∠OCO bond angle of 136.6° indicates its potential for CO2 activation. The binding energies (Eb_CO2) of CO2 is calculated using eqn (3).
| Eb\_CO2 = [EXCu12CO2 − EXCu12 − ECO2] | (3) |
 | ||
| Fig. 3 (a) CO2 adsorption on various clusters demonstrates varying degrees of chemisorption, evolution of HOMO–LUMO MO energies of different CO2 configurations obtained from (b) unperturbed CO2, (c and d) Cr/ZrCu12 cluster. | ||
Here, EXCu12CO2 is the energy of the fully optimized structure of XCu12CO2 and EXCu12 and ECO2 are energies of the XCu12 cluster and CO2 molecule, respectively. Positive binding energy indicates a favorable binding of the CO2 to the metal cluster. The results are plotted in Fig. 4(a) while ∠OCO angles and C–O bond lengths of CO2 adsorbed on XCu12 clusters are summarised in Table S2 of the ESI.† The interaction strength diminishes with an increasing number of valence electrons, hitting a low point for CrCu12 (1.37 eV) and MoCu12 (1.17 eV) before rising again. This is a reflection of the closed 18-electron shell configuration. Variations in the interaction between clusters and CO2 molecules are evident in the bending of the ∠OCO bond angle and the elongation of the C–O bond. Fig. 4(b) illustrates these effects. Specifically, greater binding energies correlate with increased deformation of both the C–O bond length and ∠OCO bond angle. Considering a bending angle of 130 degrees and 10% bond elongation as a reference (refer to Fig. 4(b)), only a few clusters show strong activation capabilities of CO2 molecules out of 18 clusters highlighted with colored backgrounds. The physical stretching and bending of CO2 can be characterized by charge transfer from the cluster to the CO2 molecule, polarizability and many more properties of the cluster. The highlighted clusters in Fig. 4(b) have comparatively lower IP (refer to Fig. 1(d)), which indicates easy transfer of electronic charge to CO2, resulting in higher bending. The Mulliken charge analysis confirms that the CO2 molecule acquires a significant amount of charge after getting adsorbed on the Cu cluster. Table S2† presents the charge transfer values to CO2, with Fig. S4† illustrating that, among both the 3d and 4d series clusters, CrCu12 and MoCu12 exhibit the minimum charge transfer to CO2, adhering to the 18-electron closed-shell rule. Some of the previously reported Cu-based and other clusters are shown to activate CO2, such as Cu2Sn2 (132.7°, 8.5%),46 [B12(CN)11]2− (127°, 0.8%),52 CuZr3 (115.6°, 16.9%).53 Considerable bending of the CO2 molecule is observed in all the clusters while maximum bond length elongation (CO to C–O) can be observed in the ZrCu12 cluster. The evolution of the MO energy diagram of CO2 in the unperturbed and chemisorbed state on different clusters is provided in Fig. 3. The uneven distribution of molecular orbitals can be depicted as the bending angle varies.
 | ||
| Fig. 4 (a) Binding energy of the CO2 in different clusters, (b) bond angle (∠OCO) and percentage increase in bond length of CO2 after chemisorption on the clusters; bond length of C–O (1.18 Å) in gaseous CO2 molecule is used as a reference. | ||
The polarizability of neutral clusters is one of the main descriptors of intermolecular force in physisorbed systems. The average polarizabilities of each cluster in the equilibrium configuration are calculated as,
 | (4) |
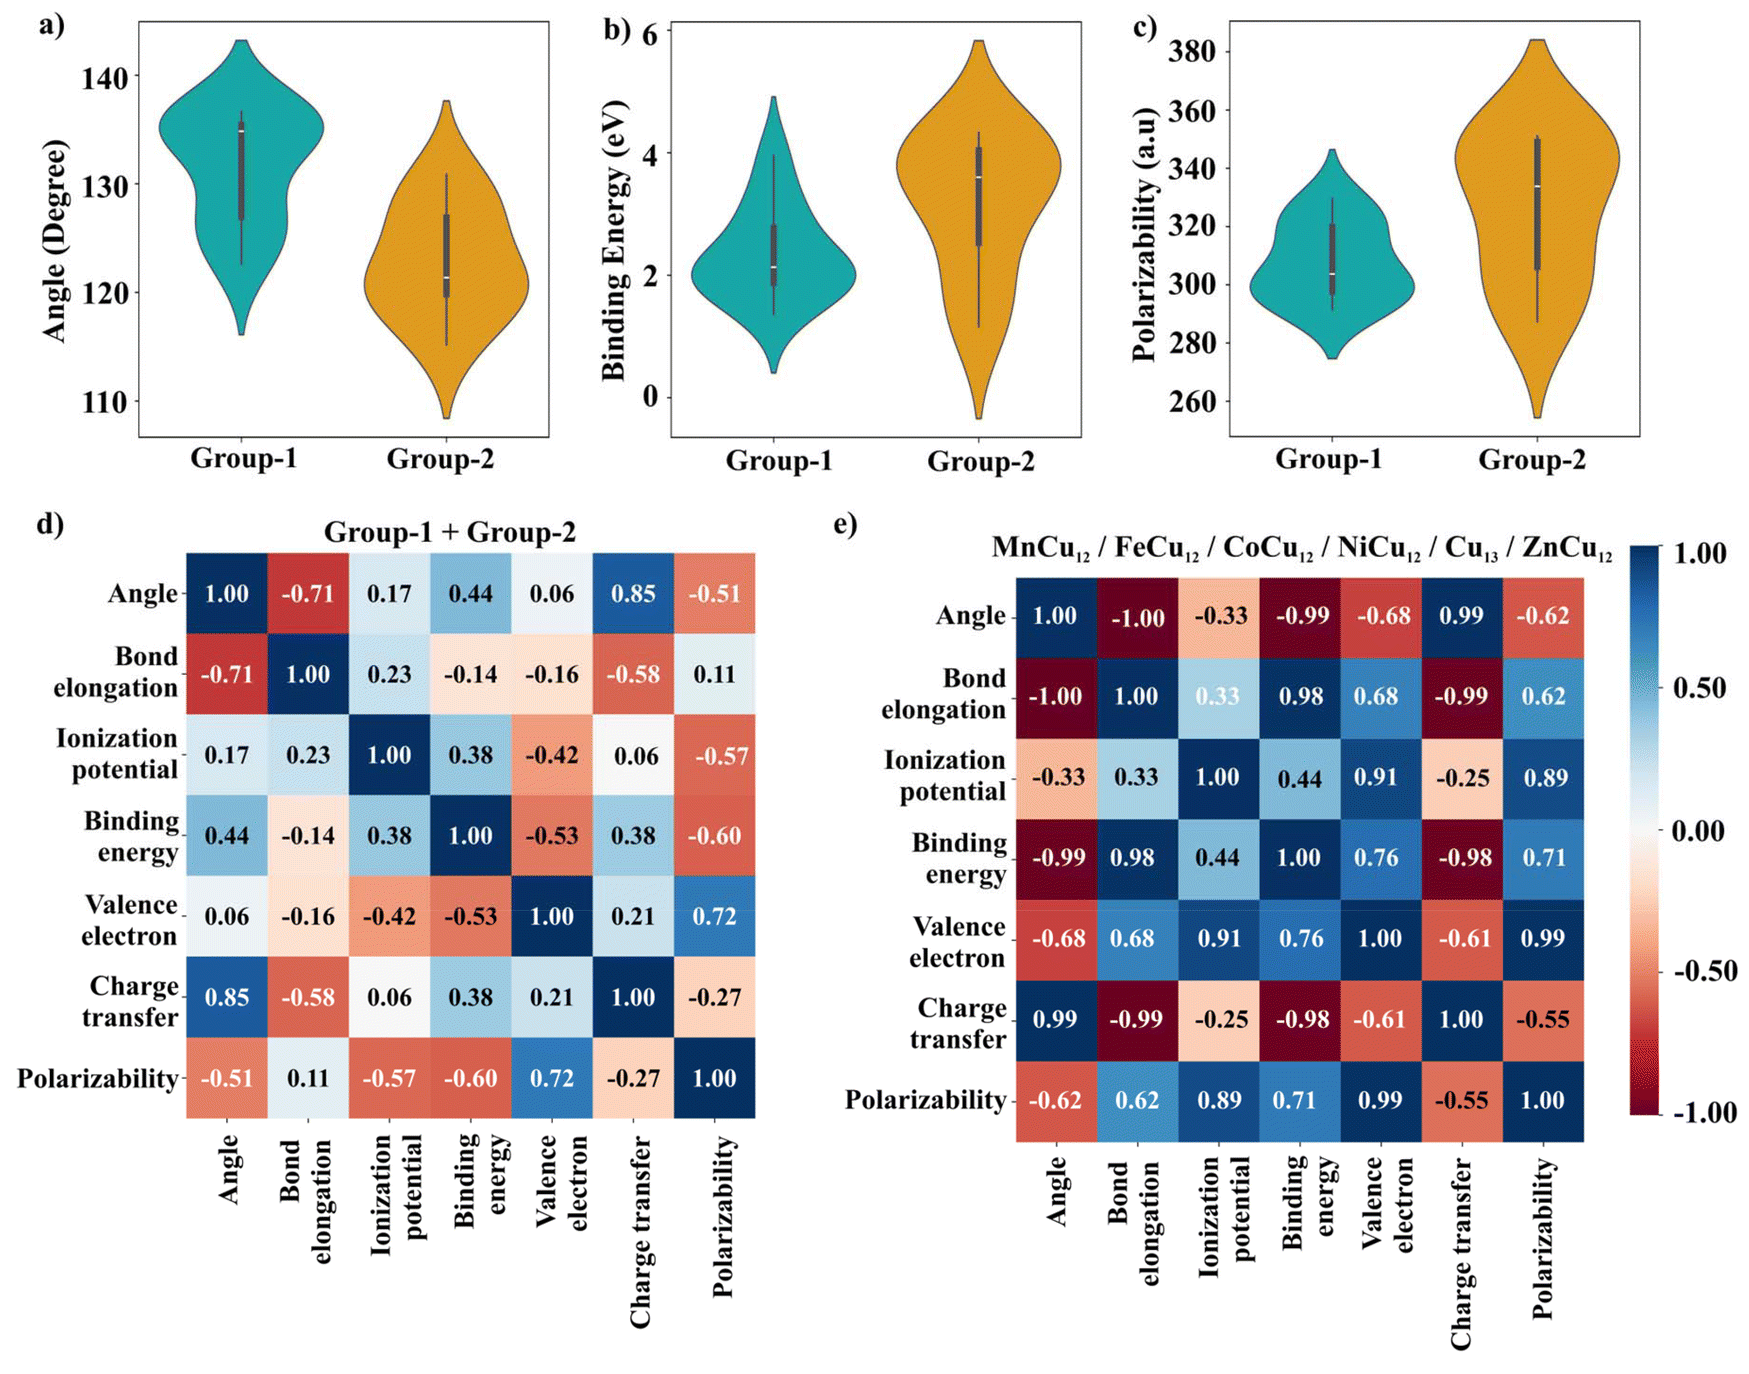 | ||
| Fig. 5 Violin plot of (a) bond angle of CO2 in the chemisorbed state, (b) binding energy of CO2 (c) polarizability of TM-doped cluster, (d–e) Pearson correlation plot; angle refers to OCO bond angle. | ||
For a systematic comparison, the calculated data for group-1 and group-2 clusters are plotted in Fig. 5. The wider section of the violin plot represents a higher probability whereas the narrower sections represent a lower probability. From Fig. 5(a), the median bending angle for group 1 is ∼135° whereas that for group 2 it is ∼120°. The binding energies as well as the polarizabilities of the group-2 clusters are much higher than that of the group-1 clusters which indicates better activating properties of the former. Further, to investigate the dependence between multiple properties of clusters, a correlation matrix that measures the linear correlation is constructed from both group-1 and group-2 data sets. The results are given in Fig. 5(d). From this Pearson correlation matrix, the bending angle and bond elongation are highly correlated with the binding energy, charge transfer, and polarizability of the cluster whereas other parameters such as ionization potential, and number of valence electrons are found to be less correlated. The reason lies in the behaviour of the plots similar to a function |x| which has both positive and negative coefficients as can be seen in Fig. 4(a). To elucidate this point, we have divided the data into two sets; (i) 16 to 18 valence electrons and (ii) 19–24 valence electrons, with the results depicted in Fig. 5(e) and Fig. S5.† The correlation matrix indicates that all parameters are linearly correlated with each other.
3.3 Electrocatalytic CO2 reduction reaction (CO2RR) on clusters
The CO2RR involves multiple proton and electron transfer processes. This section systematically investigates the electrochemical conversion of CO2 to CO on the Cr/Mn/Fe/Co/Ni/Cu-Cu12 clusters. The reaction process involved different intermediate steps described as;29,54| CO2 (g) + * → *CO2 | (5) |
| *CO2 + (H+ + e−) → *COOH | (6) |
| *COOH + (H+ + e−) → *CO + H2O (g) | (7) |
| *CO → * + CO (g) | (8) |
The reduction process of CO2 in the adsorbed state to CO follows three key reaction steps. The first two steps involve protonation and charge transfer between the adsorbed CO2 and a free hydrogen atom in the environment, resulting in the formation of the *COOH intermediate which further undergoes a protonated charge transfer process to yield the desired products, *CO and H2O. Finally, the adsorbed *CO product desorbs from the surface in the third reaction step.
To quantify these intermediate processes, the Gibbs free energy change (ΔG) for each intermediate can be evaluated by the computational hydrogen electrode (CHE) model given as;55,56
| ΔG = ΔEDFT + ΔEZPE − TΔS − eU | (9) |
| η = −UL = ΔGmax/e | (10) |
Here UL denotes the electric potential required to surpass the energy barrier of the potential-limiting step. Using Gibb's free energy change (ΔG) method, the CO2 reduction to CO on Cr/Mn/Fe/Co/Ni/Cu-Cu12 clusters is first investigated with the results displayed in Fig. 6. As observed in Fig. 6(a), the RDS for all clusters occurs at the third step, *CO → * + CO (g), with energy barriers of 1.33, 1.42, 1.50, 1.57, 1.65, and 1.72 eV respectively. Notably, the overpotential and the magnetic moments of the clusters follow a similar trend, as depicted in Fig. 6(b). Finally, the competitive reaction to form H2 is also examined, given that CO2 reduction typically occurs in a liquid environment. To assess this possibility, the initial step of hydrogenation leading to potential intermediates such as *COOH is evaluated using the BrØnsted–Evans–Polanyi (BEP) relation, which is derived from the change in Gibb's free energy. The free energy profile of hydrogen atom adsorption is plotted in Fig. 6(c) and the selectivity plot is presented in Fig. 6(d).57 It is important to note that the upper (left) and lower (right) regions represent the selectivity for HER and CO2RR products, respectively. In this study, for most of the clusters with the exception of CrCu12, the intermediate *COOH is more likely to form due to its lower ΔG value. It is interesting to note that the calculated adsorption energies of water on the clusters 0.4–0.7 eV (refer to Table S4†) are close to or slightly higher than the experimental value of water adsorption on Cu(110) surface58 (10 kcal mol−1 = 0.43 eV). The adsorption energy of the water molecule is 0.42 eV for the Cu7 cluster.59
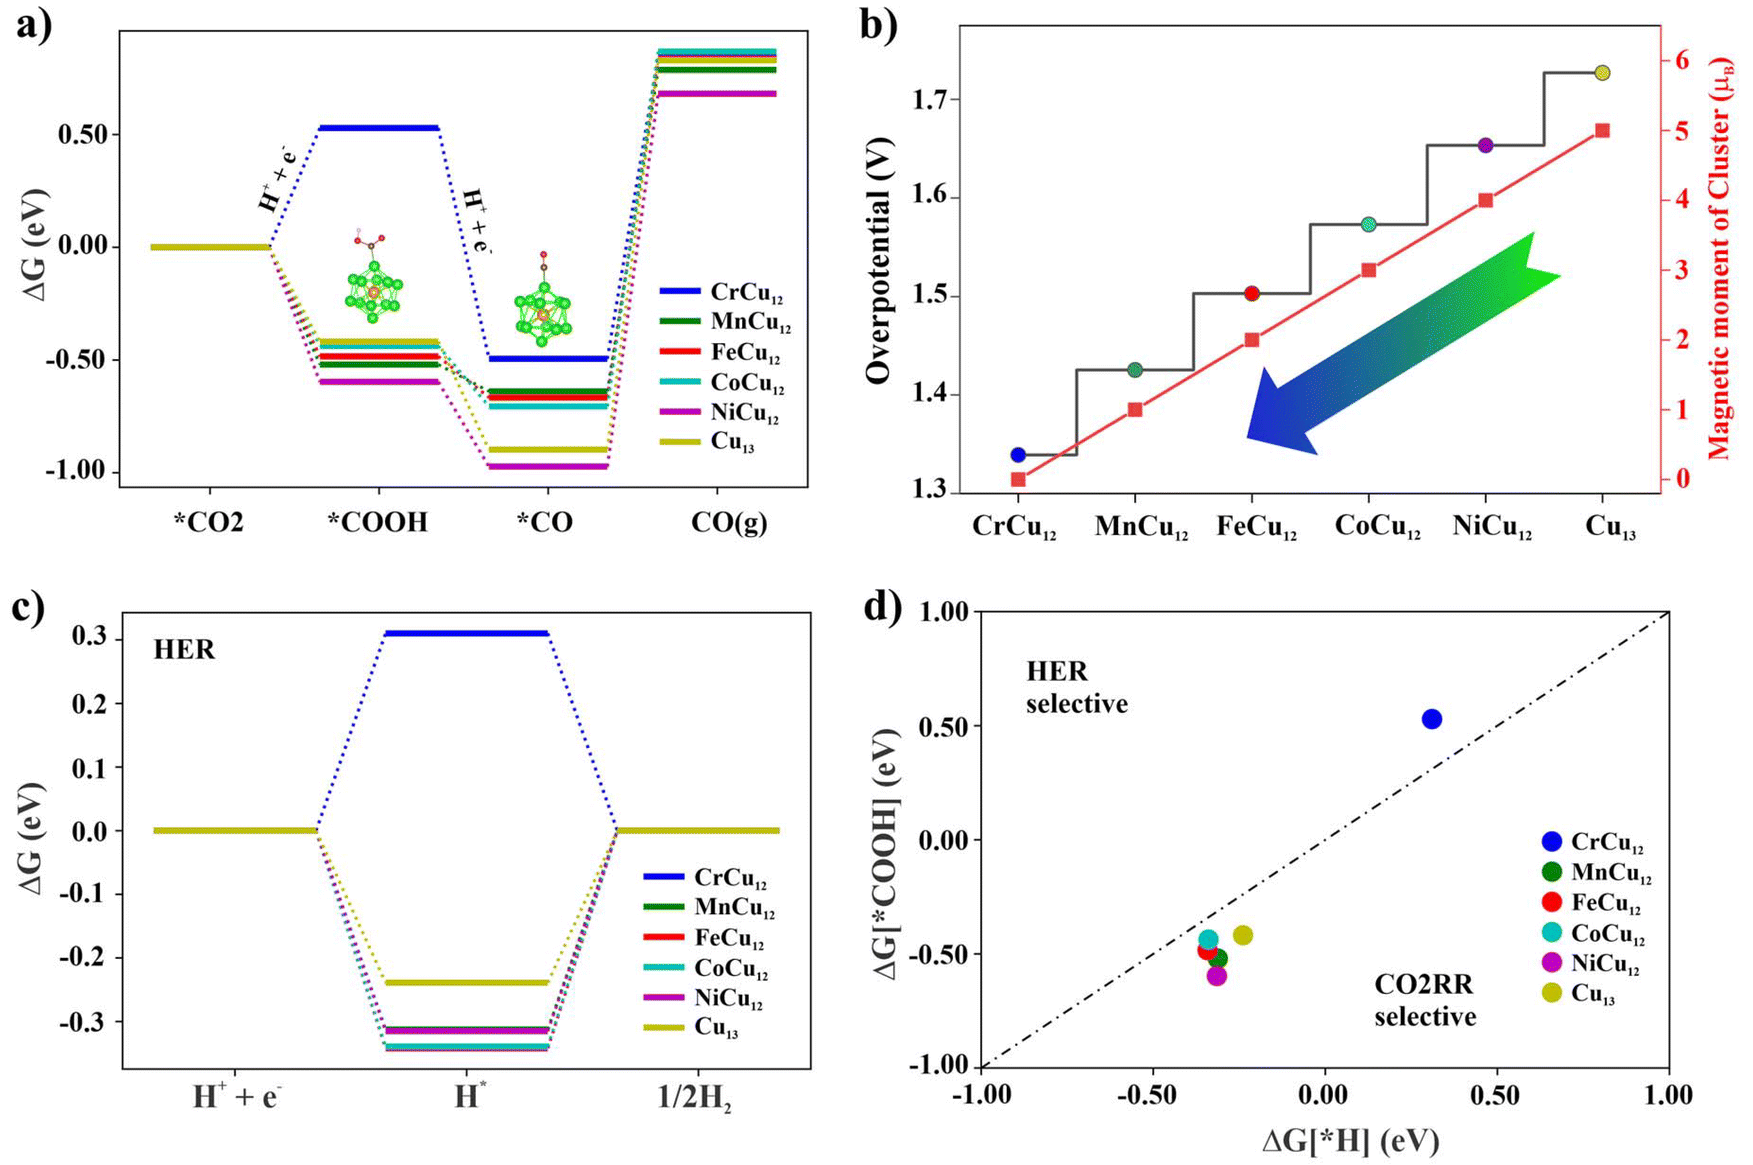 | ||
| Fig. 6 (a) The free-energy change profile of CO2 reduction to CO on XCu12 clusters, (b) the overpotential of CO2 reduction, (c) the free-energy profile of hydrogen adsorption, and (d) the selectivity plot between CO2RR and HER. Clusters below the dotted lines are expected to exhibit the CO2RR selectivity. | ||
Identifying an intrinsic descriptor with predictive power, independent of further DFT calculations, is crucial for efficiently screening the best catalysts from a vast array of material candidates. In this context, to establish a relationship with the overpotential (ηCO) for TM-doped clusters, a straightforward yet fundamental descriptor (Φ) can be used which is defined by:60,61
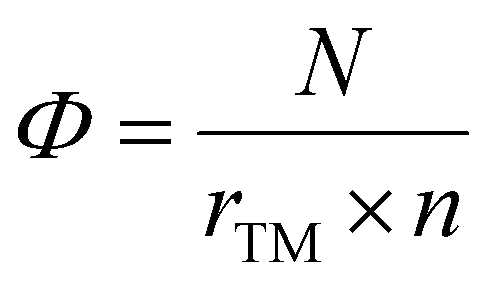 | (11) |
 | ||
| Fig. 7 (a and b) Variation of different cluster parameters and their Pearson correlation plot. | ||
Now considering overpotential as a dependent variable and the other three as independent variables, a relationship can be obtained by fitting the DFT obtained data with the ordinary least squares (OLS) regression method. This is given by;
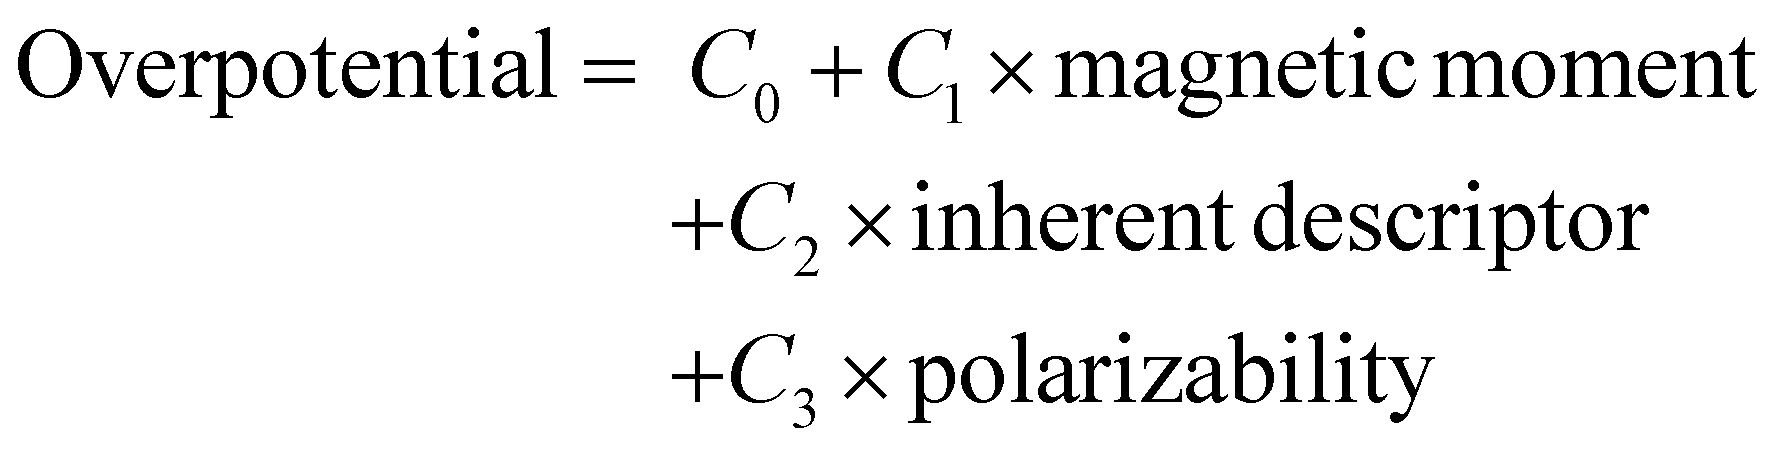 | (12) |
4. Conclusion
In this study, we have systematically investigated the equilibrium structures, electronic and magnetic properties of transition metal atom-doped icosahedral copper clusters, XCu12 (X = 3d and 4d transition metal atoms), using a multi-scale theoretical approach that combines the artificial bee colony algorithm, the extended tight binding model, and density functional theory (DFT). Our findings reveal that doping significantly influences their electronic configurations, magnetic properties, and stability. In addition, Transition metal-doped Cu12 clusters exhibit an enhanced ability to bind, activate, and electrochemically reduce CO2.Among the clusters studied, CrCu12 and MoCu12 stand out as the most stable clusters among the 3d and 4d series, respectively, due to their closed electronic shell structures. This shell closing also leads to quenched magnetic moments even though Cr and Mo possess the highest magnetic moments in their respective series. While closed-shell systems should be relatively chemically inert, CrCu12 and MoCu12 can bind and activate CO2. The findings further reveal a direct correlation between the electronic and magnetic properties of the clusters and their catalytic performance, with transition metal-doped clusters exhibiting approximately a 20% decrease in overpotential for CO2 reduction compared to the pure Cu13 cluster. The proposed empirical formula based on DFT data further enhances our ability to predict the properties of similar clusters, providing a valuable tool for future material design.
Data availability
The data supporting this article have been included as part of the ESI.†Conflicts of interest
There are no conflicts of interest to declare.Acknowledgements
MKM and PJ acknowledge financial support from the U.S. Department of Energy, Office of Basic Energy Sciences, Division of Materials Sciences and Engineering under Award No. DE-FG02-96ER45579. Resources of the National Energy Research Scientific Computing (NERSC) Center supported by the Office of Science of the U.S. Department of Energy under Contract No. DE-AC02-05CH11231 is also acknowledged. The authors extend their acknowledgment to the High-Performance Research Computing (HPRC) core facility at Virginia Commonwealth University for providing supercomputing resources.References
- M. González-Castaño, B. Dorneanu and H. Arellano-García, React. Chem. Eng., 2021, 6, 954–976 RSC.
- P. Huang, J. Huang, J. Li, T. D. Pham, L. Zhang, J. He, G. W. Brudvig, N. A. Deskins, A. I. Frenkel and G. Li, J. Phys. Chem. C, 2022, 126, 8596–8604 CrossRef CAS.
- E. V. Kondratenko, G. Mul, J. Baltrusaitis, G. O. Larrazábal and J. Pérez-Ramírez, Energy Environ. Sci., 2013, 6, 3112–3135 RSC.
- A. Vasileff, Y. Zheng and S. Z. Qiao, Adv. Energy Mater., 2017, 7, 1700759 CrossRef.
- W. Zhu, R. Michalsky, Ö. Metin, H. Lv, S. Guo, C. J. Wright, X. Sun, A. A. Peterson and S. Sun, J. Am. Chem. Soc., 2013, 135, 16833–16836 CrossRef CAS PubMed.
- G. Zhang, L. Li, Z.-J. Zhao, T. Wang and J. Gong, Acc. Mater. Res., 2023, 4, 212–222 CrossRef CAS.
- Z. Han, D. Han, Z. Chen, J. Gao, G. Jiang, X. Wang, S. Lyu, Y. Guo, C. Geng, L. Yin, Z. Weng and Q.-H. Yang, Nat. Commun., 2022, 13, 3158 CrossRef CAS PubMed.
- K. P. Kuhl, E. R. Cave, D. N. Abram and T. F. Jaramillo, Energy Environ. Sci., 2012, 5, 7050–7059 RSC.
- X. Chen, J. Chen, N. M. Alghoraibi, D. A. Henckel, R. Zhang, U. O. Nwabara, K. E. Madsen, P. J. A. Kenis, S. C. Zimmerman and A. A. Gewirth, Nat. Catal., 2021, 4, 20–27 CrossRef CAS.
- B. Yang, C. Liu, A. Halder, E. C. Tyo, A. B. F. Martinson, S. Seifert, P. Zapol, L. A. Curtiss and S. Vajda, J. Phys. Chem. C, 2017, 121, 10406–10412 CrossRef CAS.
- C. Liu, B. Yang, E. Tyo, S. Seifert, J. DeBartolo, B. von Issendorff, P. Zapol, S. Vajda and L. A. Curtiss, J. Am. Chem. Soc., 2015, 137, 8676–8679 CrossRef CAS PubMed.
- Q.-Y. Fan, Y. Wang and J. Cheng, J. Phys. Chem. Lett., 2021, 12, 3891–3897 CrossRef CAS PubMed.
- A. Ma, Y. Ren, Y. Zuo, J. Wang, S. Huang, X. Ma and S. Wang, Chem. Commun., 2024, 60, 3162–3165 RSC.
- T. Kawawaki, T. Okada, D. Hirayama and Y. Negishi, Green Chem., 2024, 26, 122–163 RSC.
- L.-J. Liu, Z.-Y. Wang, Z.-Y. Wang, R. Wang, S.-Q. Zang and T. C. W. Mak, Angew. Chem., Int. Ed., 2022, 61, e202205626 CrossRef CAS PubMed.
- C. Liu, H. He, P. Zapol and L. A. Curtiss, Phys. Chem. Chem. Phys., 2014, 16, 26584–26599 RSC.
- Y. Gao, N. Shao, S. Bulusu and X. C. Zeng, J. Phys. Chem. C, 2008, 112, 8234–8238 CrossRef CAS.
- F. Mehmood, J. Greeley and L. A. Curtiss, J. Phys. Chem. C, 2009, 113, 21789–21796 CrossRef CAS.
- B. Barhács, E. Janssens and T. Höltzl, Phys. Chem. Chem. Phys., 2022, 24, 21417–21426 RSC.
- L. Jin-Cheng, X. Hai, Z. Xiao-Kun, Z. Nan-Nan, L. Yuan, X. Deng-Hui, Y. Xiaohu, H. Han-Shi and L. Jun, CCS Chem., 2022, 5, 152–163 Search PubMed.
- Y. Pan, H. Li, J. Xiong, Y. Yu, H. Du, S. Li, Z. Wu, S. Li, J. Lai and L. Wang, Appl. Catal., B, 2022, 306, 121111 CrossRef CAS.
- D.-H. Nam, O. S. Bushuyev, J. Li, P. De Luna, A. Seifitokaldani, C.-T. Dinh, F. P. García de Arquer, Y. Wang, Z. Liang, A. H. Proppe, C. S. Tan, P. Todorović, O. Shekhah, C. M. Gabardo, J. W. Jo, J. Choi, M.-J. Choi, S.-W. Baek, J. Kim, D. Sinton, S. O. Kelley, M. Eddaoudi and E. H. Sargent, J. Am. Chem. Soc., 2018, 140, 11378–11386 CrossRef CAS PubMed.
- D. Yang, S. Zuo, H. Yang, Y. Zhou, Q. Lu and X. Wang, Adv. Mater., 2022, 34, 2107293 CrossRef CAS PubMed.
- S. Zhang, L. Chen, X. S. Luan and H. Li, Chem. Phys., 2022, 557, 111487 CrossRef CAS.
- Z. Zhao, Z. Chen, X. Zhang and G. Lu, J. Phys. Chem. C, 2016, 120, 28125–28130 CrossRef CAS.
- M. Ma, K. Djanashvili and W. A. Smith, Angew. Chem., Int. Ed., 2016, 55, 6680–6684 CrossRef CAS PubMed.
- P. Hirunsit, J. Phys. Chem. C, 2013, 117, 8262–8268 CrossRef CAS.
- H. Tao, Y. Li, X. Cai, H. Zhou, Y. Li, W. Lin, S. Huang, K. Ding, W. Chen and Y. Zhang, J. Phys. Chem. C, 2019, 123, 24118–24132 CrossRef CAS.
- L.-X. Ran, D.-W. Deng, Y.-B. Li, Q.-X. Ge, J. Wu, X.-B. Li, Z.-K. Tang and W.-J. Yin, J. Phys. Chem. C, 2024, 128, 13464–13472 CrossRef CAS.
- N. N. Ha, N. T. T. Ha and L. M. Cam, J. Mol. Graphics Modell., 2021, 107, 107979 CrossRef CAS PubMed.
- S. K. Iyemperumal and N. A. Deskins, Phys. Chem. Chem. Phys., 2017, 19, 28788–28807 RSC.
- R. P. B. Silalahi, K. K. Chakrahari, J.-H. Liao, S. Kahlal, Y.-C. Liu, M.-H. Chiang, J.-Y. Saillard and C. W. Liu, Chem. – Asian J., 2018, 13, 500–504 CrossRef CAS PubMed.
- J. Zhang and M. Dolg, Phys. Chem. Chem. Phys., 2015, 17, 24173–24181 RSC.
- J. Zhang and M. Dolg, Phys. Chem. Chem. Phys., 2016, 18, 3003–3010 RSC.
- A. D. Becke, J. Chem. Phys., 1992, 97, 9173–9177 CrossRef CAS.
- A. D. Becke, J. Chem. Phys., 1993, 98, 5648–5652 CrossRef CAS.
- B. P. Pritchard, D. Altarawy, B. Didier, T. D. Gibson and T. L. Windus, J. Chem. Inf. Model., 2019, 59, 4814–4820 CrossRef CAS PubMed.
- M. Frisch, G. Trucks, H. Schlegel, G. Scuseria, Ma. Robb, J. Cheeseman, G. Scalmani, V. Barone, G. Petersson and H. Nakatsuji, Gaussian 16, Revision A. 03, Gaussian, Inc., Wallingford CT, 2016 Search PubMed.
- S. Grimme, J. Antony, S. Ehrlich and H. Krieg, J. Chem. Phys., 2010, 132, 154104 CrossRef PubMed.
- T. Lu and F. Chen, J. Comput. Chem., 2012, 33, 580–592 CrossRef CAS PubMed.
- G. Kresse and J. Furthmüller, Phys. Rev. B:Condens. Matter Mater. Phys., 1996, 54, 11169–11186 CrossRef CAS PubMed.
- G. Kresse and J. Furthmüller, Comput. Mater. Sci., 1996, 6, 15–50 CrossRef CAS.
- J. P. Perdew, K. Burke and M. Ernzerhof, Phys. Rev. Lett., 1996, 77, 3865–3868 CrossRef CAS PubMed.
- P. E. Blöchl, Phys. Rev. B:Condens. Matter Mater. Phys., 1994, 50, 17953–17979 CrossRef PubMed.
- Data repository, https://github.com/manishkmr484/Cluster_Geom.
- A. Muthuperiyanayagam, A. G. Nabi, Q. Zhao, Aman-ur-Rehman and D. Di Tommaso, Phys. Chem. Chem. Phys., 2023, 25, 13429–13441 RSC.
- Q. Zhang and L. Guo, J. Cluster Sci., 2018, 29, 867–877 CrossRef CAS.
- N. Kuganathan, E. N. Sgourou, A. Chroneos and C. A. Londos, Physica B: Condens. Matter, 2024, 674, 415540 CrossRef CAS.
- Q. Sun, X. G. Gong, Q. Q. Zheng, D. Y. Sun and G. H. Wang, Phys. Rev. B:Condens. Matter Mater. Phys., 1996, 54, 10896–10904 CrossRef CAS PubMed.
- Quantum cluster database.
- G. Zhu, Y. Li, H. Zhu, H. Su, S. H. Chan and Q. Sun, ACS Catal., 2016, 6, 6294–6301 CrossRef CAS.
- M. E. Kilic and P. Jena, J. Phys. Chem. Lett., 2023, 14, 8697–8701 CrossRef CAS PubMed.
- Megha, K. Mondal, T. K. Ghanty and A. Banerjee, J. Phys. Chem. A, 2021, 125, 2558–2572 CrossRef CAS PubMed.
- B.-W. Tang, Y. Liu, D.-W. Deng, Y. Xu, B. Wen, Z.-K. Tang, X.-L. Wei, Q.-X. Ge and W.-J. Yin, Phys. Chem. Chem. Phys., 2022, 24, 26556–26563 RSC.
- J. K. Nørskov, J. Rossmeisl, A. Logadottir, L. Lindqvist, J. R. Kitchin, T. Bligaard and H. Jónsson, J. Phys. Chem. B, 2004, 108, 17886–17892 CrossRef PubMed.
- A. A. Peterson, F. Abild-Pedersen, F. Studt, J. Rossmeisl and J. K. Nørskov, Energy Environ. Sci., 2010, 3, 1311–1315 RSC.
- S. Baskaran and J. Jung, Appl. Surf. Sci., 2022, 592, 153339 CrossRef CAS.
- J. Nakamura, J. M. Campbell and C. T. Campbell, J. Chem. Soc., Faraday Trans., 1990, 86, 2725–2734 RSC.
- L. Chen, Q. Zhang, Y. Zhang, W. Z. Li, B. Han, C. Zhou, J. Wu, R. C. Forrey, D. Garg and H. Cheng, Phys. Chem. Chem. Phys., 2010, 12, 9845–9851 RSC.
- L. Gong, X. Wang, T. Zheng, J. Liu, J. Wang, Y.-C. Yang, J. Zhang, X. Han, L. Zhang and Z. Xia, J. Mater. Chem. A, 2021, 9, 3555–3566 RSC.
- E. Clementi, D. L. Raimondi and W. P. Reinhardt, J. Chem. Phys., 1967, 47, 1300–1307 CrossRef CAS.
Footnote |
| † Electronic supplementary information (ESI) available. See DOI: https://doi.org/10.1039/d4nr03795b |
| This journal is © The Royal Society of Chemistry 2025 |