Toxicity of exfoliated-MoS2 and annealed exfoliated-MoS2 towards planktonic cells, biofilms, and mammalian cells in the presence of electron donor†
Jingjing
Fan
a,
Yifei
Li
b,
Hang N.
Nguyen
a,
Yan
Yao
*b and
Debora F.
Rodrigues
*a
aDepartment of Civil and Environmental Engineering, University of Houston, Houston, TX 77204-4003, USA. E-mail: dfrigirodrigues@uh.edu
bDepartment of Electrical and Computer Engineering & Materials Science and Engineering Program, University of Houston, Houston, TX 77204-4003, USA. E-mail: yyao4@uh.edu
First published on 19th May 2015
Abstract
We demonstrate for the first time that suspensions of single-layered MoS2 nanosheets can act as photocatalytic antimicrobial materials under visible light in the presence of ethylenediaminetetraacetic acid (EDTA) as an electron donor. The antimicrobial capacity of exfoliated MoS2 (Ex-MoS2) was found to be 5.7 times higher than that of annealed exfoliated MoS2 (Ae-MoS2) against planktonic cells in the presence of 40 ppm EDTA. This difference in the antimicrobial performance was attributed to the 1T-phase of Ex-MoS2, which presents higher electron conductivity than that of Ae-MoS2. This higher electron conductivity of Ex-MoS2 led to increase generation of reactive oxygen species (ROS), as observed by the superoxide anion and hydrogen peroxide production assays under visible light. Additionally, Ex-MoS2 could also inactivate 65% of mature E. coli K12 biofilms without significant cytotoxicity to mammalian fibroblast cells. The suspension of single-layered MoS2 nanosheets opens up new opportunities for the development of advanced functional nanomaterials for biomedical and environmental applications.
Nano impactThis study presents for the first time the mechanisms of antibacterial activity of exfoliated MoS2 under visible light in the presence of ETDA, as an electron donor. MoS2 shows great promise as an antibacterial agent against planktonic cells and biofilms without showing adverse cytotoxicity towards mammalian cells. We believe that this study can help and bring a new direction to research on antibacterial applications of nanomaterials under visible light. |
Introduction
Investigation of antimicrobial properties of nanomaterials has recently become a significant topic of discussion due to their large industrial, environmental and biomedical applications.1–3 For instance, titanium dioxide (TiO2) has shown promise in enhancing inactivation of microorganisms on biomedical devices.4 TiO2 has also been extensively used in environmental applications for water treatment to eliminate organic compounds and inactivate microorganisms under ultraviolet light. The TiO2 photocatalytic activity under visible light, however, is almost inexistent due to its large band gap. To address this problem, George and collaborators doped TiO2 with iron to tune the band gap energy of TiO2 and enhance its photocatalytic activity under visible light. This procedure, however, led to a nanocomposite material with higher human toxicity, since further studies of human toxicity with Fe-doped TiO2 nanorods demonstrated that this nanomaterial could affect liver, heart rate and systolic blood pressure.5,6 Thus, it is essential to investigate alternative photocatalysts that are activated under visible light, and are not harmful to humans.In the present study, we will investigate MoS2 as a potential photocatalyst under visible light. Besides the photocatalytic activity, this nanomaterial has various unique properties, such as large specific surface area and excellent reactivity.7 Recent research has briskly investigated several applications of MoS2. For instance, this nanomaterial has been shown to be a promising alternative to conventional water treatment by removing dyes from water, via photocatalysis using visible light.8 MoS2 also has been extensively investigated for water splitting, organic wastes remediation, and detection of DNA molecules.9,10 More recently, researchers have investigated the effects of the MoS2 nanostructures on their catalytic activity. For instance, Ex-MoS2 with double gyroid structure (1T-MoS2 and 2H-MoS2 mixture) shows much better performance in H2 evolution compared to bulk MoS2 (2H-MoS2), which is used to synthesize the Ex-MoS2.9 These different nanostructures of MoS2 have also been suggested to present different antibacterial properties, however, so far there are no studies investigating the possible antibacterial mechanisms of these different MoS2 nanostructures in the presence of electron donors.11
In this study, the anti-microbial activity of Ex-MoS2 and Ae-MoS2 was investigated using a model bacterial strain, Escherichia coli K12, in the presence or absence of a sacrificial electron donor and light exposure. In this study the antimicrobial properties of the bulk-MoS2 was not investigated, since this material is very different from Ex-MoS2 in many aspects, such as particle size, surface area, phase component and electronic structure. In addition, bulk-MoS2 cannot be uniformly dispersed into H2O, making it difficult to probe the antimicrobial activity under aqueous conditions. The annealed Ex-MoS2 (Ae-MoS2), on the other hand, shares similar properties to Ex-MoS2 and can be dispersed in H2O. Hence, Ae-MoS2 was used as the control sample. The production of reactive oxygen species (ROS) by these nanomaterials were also evaluated as their possible antimicrobial mechanisms. The production of superoxide anion and hydrogen peroxide by these nanomaterials were evaluated using the 2,3-Bis-(2-Methoxy-4-Nitro-5-Sulfophenyl)-2H-Tetrazolium-5-Carboxanilide (XTT) and glutathione (r-L-glutamyl-L-cysteinyl-glycine (GSH)) oxidation assays, respectively. The biofilm removal capacity and mammalian cell cytotoxic effects of Ex-MoS2 were also investigated.
Experimental
Synthesis of exfoliated and annealed exfoliated MoS2
One gram of bulk MoS2 (Sigma-Aldrich) was lithiated to form LixMoS2 by immersing in 6.25 ml n-butyl lithium solution (Sigma-Aldrich, 2.5 M in hexane) and stirred overnight inside a glove box. The LixMoS2 was filtrated and washed in hexane three times to remove organic residues. The dried LixMoS2 powder was poured into 100 ml deionized water, sonicated for 1 h, and stirred for another hour to enhance exfoliation. Exfoliated MoS2 was then centrifuged at 12![[thin space (1/6-em)]](https://www.rsc.org/images/entities/char_2009.gif) 000 rpm and washed with deionized water. This process was repeated three times. After centrifugation, the precipitate was resuspended in water to form stable suspensions of Ex-MoS2. The amount of nanomaterial produced was measured by drying the solvent and measuring the weight of the solid content. Ae-MoS2 was prepared by freeze-drying (Labconco, model 73820) the Ex-MoS2 suspension and, then by annealing in argon atmosphere at 300 °C for 3 h. The annealed sample was readily dissolved into H2O with sonication to form stable suspensions (Ae-MoS2). The antibacterial performance assays were conducted immediately after the synthesis.
000 rpm and washed with deionized water. This process was repeated three times. After centrifugation, the precipitate was resuspended in water to form stable suspensions of Ex-MoS2. The amount of nanomaterial produced was measured by drying the solvent and measuring the weight of the solid content. Ae-MoS2 was prepared by freeze-drying (Labconco, model 73820) the Ex-MoS2 suspension and, then by annealing in argon atmosphere at 300 °C for 3 h. The annealed sample was readily dissolved into H2O with sonication to form stable suspensions (Ae-MoS2). The antibacterial performance assays were conducted immediately after the synthesis.
SEM, UV-vis, XPS, XRD and TEM analyses
Scanning electron microscopy (SEM) images of bulk-, Ex- and Ae-MoS2 powders were collected with a Gemini LEO 1525 SEM operating at 10 kV. Ultraviolet-visible (UV-vis) spectrum was measured using the Cary 60 UV-vis from Agilent Technologies. X-ray photoelectron spectroscopy (XPS) was measured by a Physical Electronics Model 5700 XPS instrument. X-ray diffraction (XRD) was measured using a Rigaku MiniFlex 600 with Cu Kα radiation (λ = 1.5406 Å). Transmission electron microscopy images (TEM) were collected by JEOL 2100F.For the SEM analysis of the bacteria, aliquots of 1 mL of controls and cells exposed to the Ex-MoS2 with EDTA were fixed with 2% glutaraldehyde for 1 h and dehydrated by increasing concentrations of ethanol (25, 50, 75, 95, 100% v/v). The pre-treated samples were mixed with 10 μL of 1,1,1,3,3,3-hexamethyldisilazine (98%, Acros Organics) and then one drop of the solution was placed on a transmission electron microscopy (TEM) grid (CF200-Ni, cat. no. 71150). After drying the samples overnight at room temperature, specimens were sputter coated with gold (DENTON DESK V HP, Beijing, China). SEM images were acquired in Field-emission SEM (FESEM; LEO 1525, Oberkochen, Germany).
Bacterial culture
Before each experiment, a single isolated E. coli K12 colony was inoculated into 15 mL trypic soy broth (TSB) growth medium (Difco Laboratories, Detroit, MI), and incubated overnight at 35 °C. Cells were harvested by centrifugation for 10 min at 4000 rpm and resuspended in phosphate buffer solution (0.01 M PBS, pH = 7.4, Fisher Scientific, USA) to an optical density of 0.3 at the wavelength of 600 nm (OD600).Toxicity of EDTA
This investigation aimed to determine the maximum non-toxic EDTA concentration to be mixed with MoS2. The experiment consisted of 20 μL of bacterial suspension in PBS at OD600 = 0.3 inoculated into a 96-well microtiter plate (Costar 3370, Corning, NY) containing 200 μL of DI water with different concentrations of EDTA ranging from 10 ppm to 150 ppm. A positive control was prepared with 20 μL of bacterial suspension in 200 μL DI water only. Negative control samples were prepared with 200 μL EDTA solution without bacteria. The 96-well microtiter plate was incubated at room temperature for 3 h under visible light. After the incubation period, 20 μL of the bacterial-EDTA suspension was transferred to another 96-well microtiter plate containing 200 μL of TSB. The toxicity was determined by measuring the cell growth at 35°C and 80 rpm with a plate reader spectrophotometer (EL800 universal microplate reader; Bio-Tek Instruments, Inc., Winooske, VT) at 600 nm each hour. Each experiment was performed in triplicate.Assessment of MoS2 nanomaterial toxicity to planktonic cells by plate count method
The antimicrobial assay consisted of different concentrations of Ex-MoS2 (10 ppm, 50 ppm, 100 ppm and 150 ppm) dispersed in DI water supplemented with 40 ppm of EDTA. A 1 mL volume of bacterial culture at 0.3 OD600 was added to each concentration and irradiated under two 60 W lamps with constant stirring. Experiments to simulate dark conditions were performed with plates wrapped in aluminium foil. The number of surviving bacteria was analysed using the drop plate count method after 1 h and 3 h exposure times to the nanomaterials with EDTA.12 The control samples were prepared in DI water without Ex-MoS2 and/or EDTA. Colonies were counted and compared to control plates to calculate percentage growth inhibition. All treatments were prepared in triplicate. Identical experiments were also conducted with Ae-MoS2 to compare the effects of the different nanomaterial structures on toxicity.Plate agar assay for assessment of nanomaterial toxicity to biofilms
Circular coverslips with 12 mm in diameter were cleaned with 70% ethanol and deposited at the bottom of 12-well flat-bottom microtiter plates (Costar 3370, Corning, NY). A volume of 2 mL of bacterial culture at 0.5 OD600 in TSB was added into the same plate and incubated at 35 °C for 48 h without shaking to achieve mature biofilm on the top of the coverslip. After incubation, the surfaces were gently rinsed with PBS to wash any unattached bacteria to the surface and transferred to another 12 well-plate, which contained different concentrations of Ex-MoS2 (0 ppm, 10 ppm, 50 ppm, 100 ppm and 150 ppm) in DI water supplemented with 40 ppm of EDTA. Controls containing only DI water and DI water with 40 ppm of EDTA without Ex-MoS2 were also prepared. For the plate agar assay, all the samples were irradiated under two 60 W lamps and incubated for 3 h at 35 °C. After incubation, the coverslips were gently rinsed with PBS and then transferred to TSA plates with the biofilm facing down onto the agar surface. TSA plates were incubated overnight at 35 °C without shaking. The antibacterial activity was determined by measuring the diameter of bacterial growth around the coverslip exposed and not exposed to the nanomaterial. Both control samples, which contained DI water only and DI water with EDTA, were used to evaluate the toxicity. The percent toxicity was calculated from the bacterial growth on the plates based on the following equation:Detection of superoxide radical anion (O2˙−)
After determining the anti-microbial effects of MoS2-EDTA, the mechanism of anti-microbial activity was investigated. To determine the production of superoxide radical anion (O2˙−), the XTT assay was performed. The XTT can be reduced by superoxide radical anion (O2˙−) to form the water soluble XTT-formazan that has maximum absorption at 470 nm. Briefly, 5 ml of the XTT solution (1 mg ml−1) and 25 μl of the activation reagent (5 mM phenazine methosulfate (PMS)) were mixed in the dark to activate the XTT reagent. A 2 mL volume of the strongest antibacterial concentrations of Ex-MoS2 or Ae-MoS2 were mixed with 1 mL of freshly prepared activated XTT solution. The mixture was incubated under light with constant stirring for 3 h, and then was filtered through a 0.2 μm PTFE membrane filter (Millipore) to remove the nanomaterial. The filtered solution (100 μL) was then placed in a 96-well plate (Corning Inc., USA). The change in absorbance at 470 nm was monitored by the plate reader method (EL800 universal microplate reader; Bio-Tek Instruments, Inc., Winooske, VT). In this assay, 50 ppm and 100 ppm of TiO2 dispersion exposed to UV light served as positive controls. Negative controls included XTT solution alone and EDTA-XTT mixture. All experiments were done in triplicates and the results were averaged. Standard deviations were calculated based on the triplicate experiments.Thiol oxidation and quantification
The Ellman's assay was used to quantify the concentration of thiols in glutathione (GSH).2 Ex-MoS2, Ae-MoS2, Ex-MoS2-EDTA and Ae-MoS2-EDTA solutions were prepared in the following concentrations: 10 ppm, 50 ppm, 100 ppm and 150 ppm. A volume of 225 μL of each solution was added to 225 μL of GSH (0.4 mM in 50 mM bicarbonate buffer) to initiate oxidation. The negative control was the GSH solution only without the nanomaterial, while GSH oxidization by H2O2 (30%) was used as a positive control. All the samples were incubated at room temperature for 2 h at 150 rpm. After incubation, 785 μL of 0.05 M Tris-HCl and 15 μL of DNTB (Ellman's reagent, 5,5′-dithio-bis-(2-nitrobenzoic acid), Sigma-Aldrich) were added into the mixtures to yield a yellow product. All the samples were incubated for another 10 min in the dark, and then filtered through 0.2 μm pore size membrane filters (PTFE Milipore filter, KTGR04FH3). A 250 μL of each filtrate were transferred into a 96-well microtiter plate and the absorbance was measured at 412 nm using Synergy MX Microtiter plate reader (Biotek, U.S.A). The loss of GSH in each sample was calculated by the following formula:Cytotoxicity using MTS assay
The fibroblast NIH 3T3 cell line was obtained from Professor Ralph B. Arlinghaus (Hubert L. Stringer Chair of Cancer research, MD Anderson Cancer Center, Houston Texas). The cytotoxicity was investigated using CellTiter 96 AQueous One Solution Cell Proliferation Assay (Promega, U.S.A) with 40 ppm EDTA only, as control, and 40 ppm EDTA with either 100 ppm Ex-MoS2 or 50 ppm Ae-MoS2. The assay contained [3-(4,5-dimethylthiazol-2-yl)-5-(3-carboxymethoxyphenyl)-2-(4-sulfophenyl)-2H-tetrazolium], inner salt (MTS) and an electron coupling reagent, phenazine ethosulfate (PES). More details on the procedure can be found elsewhere.13Results and discussion
Synthesis and characterization of Ex-MoS2 and Ae-MoS2
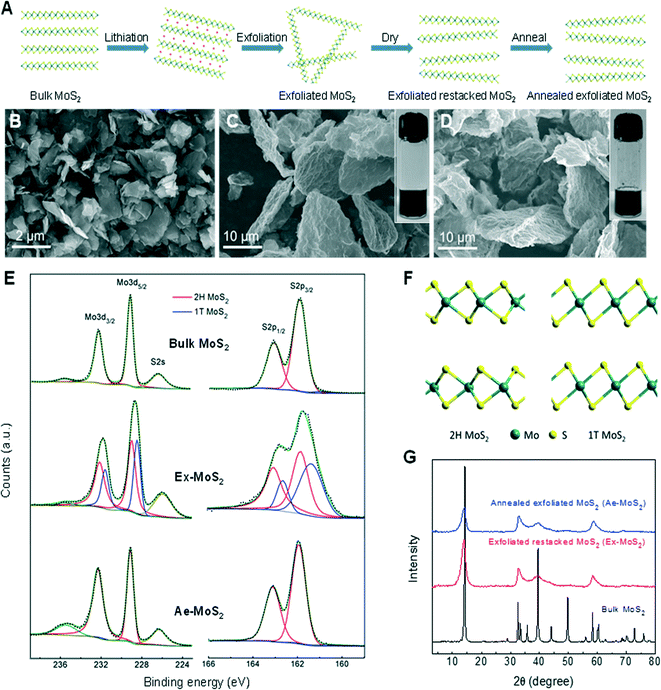
The MoS2 samples were synthesized following the procedure described by Eda and collaborators with some modifications (Fig. 1(A)).14 Ex-MoS2 was produced by exfoliation of lithiated MoS2 in water to form a quasi-stable suspension of single-layered MoS2 sheets (see inset of Fig. 1(C)). Ae-MoS2 was re-suspended in water by sonication (see inset of Fig. 1(D)). SEM images in Fig. 1(B–D) reveal the particle size of the three samples in the form of powders. The starting bulk-MoS2 materials were aggregates of nanoflakes with diameters of ~1–2 μm. Both Ex-MoS2 and Ae-MoS2 samples show large wavy flakes with sizes of ~10–30 μm, completely different from the initial bulk-MoS2, indicating a significant structure change during the exfoliation and restacking step. The indirect–direct bandgap transition of MoS2 after the exfoliation was probed by UV-vis measurement. For the Ex-MoS2 dispersions, two peaks can be identified at 623 nm (1.99 eV) and 670 nm (1.85 eV) (Fig. S2†), which arise from the direct excitonic transitions at the K point of the Brillouin zone, due to the spin–orbital splitting of the valence band.15,16 The presence and the absence of peaks at lower energy region of the spectrum are consistent with the results of few- and mono-layered MoS2.14,15,17 Raman spectroscopy (Fig. S3†) shows that the wavenumber difference between the E12g and A1g peaks of Ex-MoS2 is 2.2 cm−1 smaller than that of bulk-MoS2, which is in agreement with previous reports for few-layered MoS2 and is attributed to the weakened interlayer interaction.15,18The XPS analysis of the three samples is shown in Fig. 1(E). Bulk-MoS2 displayed a Mo 3d5/2 peak at 229.1 eV and a Mo 3d3/2 peak at 232.3 eV, manifesting itself as 2H-MoS2. After chemical exfoliation, de-convolution of Mo 3d peaks revealed additional peaks at 228.5 eV and 231.65 eV, corresponding to Mo 3d5/2 and Mo 3d3/2, respectively. S2p spectra also presented additional S2p3/2 and S2p1/2 peaks at 162.3eV and 161.4 eV respectively, which shifted to lower energy when compared to the peaks of 2H-MoS2 at 163.1 and 161.9 eV. These new peaks of Mo3d and S2p originated from 1T-MoS2, in which the sulfur atoms shifted from the original trigonal prismatic coordination in 2H-MoS2 to octahedral coordination in 1T-MoS2 (Fig. 1(F)). Therefore, Ex-MoS2 was determined to be a mixture of 2H and 1T phases. After annealing at 300°C for 3 h, peaks corresponding to 1T-MoS2 disappeared, indicating that Ae-MoS2 was mainly 2H-MoS2. These results are consistent with the literature report that – mild annealing of 1T phase MoS2 led to gradual transition to 2H phase.14 XRD results (Fig. 1(G)) show that the crystal structures of Ex-MoS2 and Ae-MoS2 are similar. Compared with bulk-MoS2, a small shift in peak position towards lower angle is observed in both Ex-MoS2 and Ae-MoS2, indicating an increased interlayer distance. Fig. S1† shows the high-resolution TEM (HRTEM) images of the cross-sectional view of bulk- and Ex-MoS2 powders, where the structures along the c-axis can be observed. As Fig. S1(A)† shows, the pristine bulk-MoS2 has well-ordered layered structure with the interlayer distance of 0.62 nm along c-axis. Ex-MoS2 (Fig. S1(B)†) has less ordered layered structure with a little larger interlayer distance of 0.64 nm, which agrees well with the broadened and slightly shifted diffraction peak in the XRD spectrum. The weakened crystallinity may be the result of the exfoliation-restacking procedure and the increased interlayer spacing may arise from the distortion of MoS2 layers after restacking.
Ex-MoS2 and Ae-MoS2 powders have analogous morphology and only differ in phase compositions. Furthermore, few- and even mono- layers of MoS2 with direct bandgap structure were confirmed in Ex-MoS2 dispersions or powders by UV-vis and Raman spectroscopy. Therefore it would be interesting to compare the antibacterial properties of these two samples.
EDTA as a sacrificial donor and its toxicity to bacteria
Previous studies have shown that photocatalytic activity of nanomaterials, such as MoS2, can be enhanced in the presence of sacrificial donors.19 These sacrificial donors donate electrons and keep the photoexcited electrons and holes of nanomaterials separate. In the case of MoS2, during water splitting for hydrogen generation, the electron donor transfers electrons to the photocatalyst, here the MoS2, leading to a strong reducing conduction band (CB) that can reduce protons to hydrogen molecules.20,21 Therefore, we hypothesized that if MoS2 requires a sacrificial electron donor to more efficiently split water by photocatalysis, it is possible that the inactivation of microorganisms will be enhanced in the presence of a sacrificial donor. Thus, we investigated the effects of the presence of a sacrificial donor, EDTA, on the anti-microbial properties of this nanomaterial.The rationale for selecting EDTA was that previous studies demonstrated that EDTA was the most effective sacrificial electron donor in water splitting compared to others, such as methanol, ethanol, lactic acid, and formaldehyde.22 Similarly, other studies also proposed that EDTA could enhance the efficiency of hydrogen generation.23 Hence, EDTA was selected for further investigation as an electron donor in this study.
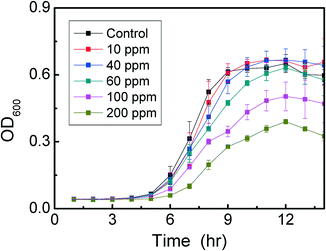
Before performing the experiments with EDTA, as a sacrificial electron donor to MoS2, we investigated the toxicity of EDTA to the microbial cells. This investigation aimed to determine the maximum non-toxic EDTA concentration to be used in subsequent experiments with the nanomaterials. The results indicated that concentrations of EDTA below 40 ppm displayed non-toxic effects towards E. coli K12 (Fig. 2). On the other hand, concentrations higher than 60 ppm were toxic to E. coli K12, since longer lag phases and lower optical density values at the stationary phase were observed. Based on our results with the E. coli strain K12, the optimum concentration of EDTA to be used with MoS2 was 40 ppm. Therefore this concentration was used for further investigations to determine the role of the sacrificial electron donor in the antimicrobial properties of MoS2.24,25
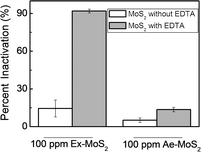
When comparing MoS2 in the presence and absence of EDTA under light, the results showed that the presence of EDTA increased the microbial inactivation by more than 50% (Fig. 3). This result suggests that EDTA, like in water splitting reaction, plays an important role in the antimicrobial activity of MoS2. Additionally, Ex-MoS2, in the presence of EDTA, presented higher antibacterial activity than other well-known nanomaterials. For example, 100 ppm of Ex-MoS2 presented 36% and 47% higher antibacterial activity than 5000 ppm TiO2 and SiO2 under light, respectively.26 Previous studies have also shown that to achieve similar microbial inactivation to our study, 400 ppm ZnO is necessary, which is three times higher than the concentration used in the present study.27 Therefore, Ex-MoS2 can be a potent antimicrobial agent with the advantage of not requiring UV light like TiO2.
Effects of contact time, concentration and type of nanomaterials under light and dark conditions on planktonic cells
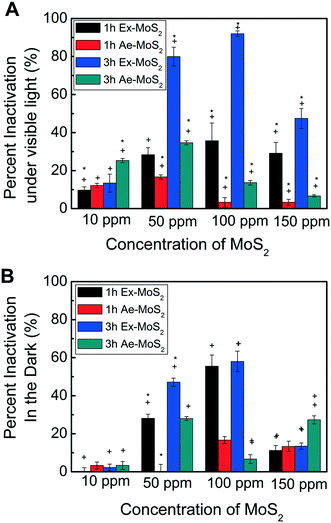
After determining the highest non-toxic EDTA concentration for E. coli K12, the contact time and concentration of the two different types of MoS2, namely, Ex-MoS2 and Ae-MoS2, were investigated in the presence of 40 ppm EDTA and under light exposure. The results show that the microbial inactivation is time dependent (Fig. 4(A)) since 3 h exposure led to 1.5 to four times greater inactivation than the 1 h exposure for both Ex-MoS2 and Ae-MoS2. Similar toxicity time dependency was observed with other two-dimensional layered materials, like graphene oxide and graphene.1,28 This time dependency for microbial inactivation can be explained by the fact that in a shorter exposure time, not all the bacterial cells will have enough time to get into contact or close proximity to the Ex-MoS2 and Ae-MoS2 to be fully inactivated. As described later in this study, these nanomaterials under visible light will produce reactive oxygen species (ROS). These ROS are typically produced in close proximity to the nanomaterials. Also, these ROS tend to be unstable over long time periods; therefore the cells need to be relatively close to the nanomaterials that are constantly generating ROS under visible light to be inactivated through ROS. The longer the exposure time, the higher will be the likelihood of a larger number of cells to get in contact or close proximity to the nanomaterials, which would lead to higher cellular inactivation.The concentration of Ex-MoS2 and Ae-MoS2 also influenced the inactivation of the microorganisms, since increasing concentrations of Ex-MoS2, up to 100 ppm, led to higher bacterial inactivation. The maximum bacterial removal was observed at 100 ppm Ex-MoS2 with 92% inactivation. However, at 150 ppm of Ex-MoS2, 48.4% less inactivation than 100 ppm was observed. As mentioned in previously studies, the photocatalytic reaction of MoS2 may be enhanced with increasing catalyst concentration within a certain range.29 This phenomenon has been previously described and is called shielding effect. This shield effect occurs when larger amounts of the catalyst is introduced in the reactor creating more active sites for the photocatalytic reaction and increasing the scattering of photons, which in return will decrease the efficiency of the reaction.30
Besides the contact time and concentration of the nanomaterials, the type of MoS2, also presented different antimicrobial capabilities. For instance, in Fig. 4(A), Ex-MoS2 had 1.7 to 10.7 times higher inactivation capacity than Ae-MoS2 in the concentration range of 50 to 150 ppm. The lower antimicrobial capacity of Ae-MoS2 may be explained by its density, the reactivity of the active sites, and poor electrical transport.31 Similarly, Maitra and collaborators proved that 1T-MoS2, major component present in Ex-MoS2, is a better catalyst for electrochemical and photochemical hydrogen evolution reactions than Ae-MoS2, which only consist of 2H-MoS2.9 Furthermore, the highest cell inactivation performance with Ae-MoS2 was achieved at 50 ppm, while for Ex-MoS2 was at 100 ppm. These findings suggest that the different nanomaterial structures have different optimum concentrations for antimicrobial inactivation.
It is worth to note that Ex-MoS2 showed excellent antibacterial effect under light (Fig. 4A). However, to confirm the importance of light in the antimicrobial process of this nanomaterial, antimicrobial experiments were also performed under dark conditions. As shown in Fig. 4(B), the highest inactivation percentage of Ex-MoS2 was found to be 58% after 3 h exposure to 100 ppm, while the maximum inactivation capacity for Ae-MoS2 was achieved at 50 ppm. A similar inactivation trend was also observed in the experiments conducted under light with increasing concentrations of the nanomaterials (Fig. 4(A)), but the light led to higher inactivation values. These results demonstrate that light is an important parameter, which can lead to almost 60% higher inactivation then dark conditions. Similar findings with TiO2 were also reported by Daoud and collaborators, which also observed significant bacterial growth reduction after exposure to UV light as opposed to dark conditions.32 This higher inactivation under light conditions could be explained by higher production of ROS under visible light irradiation of 1T-and 2H-MoS2 particles.33
Biofilm removal capacity of Ex-MoS2
Planktonic bacteria in the environment or in engineering processes can form colonies on surfaces to create biofilms.34 These microbial aggregates, called biofilms, can be 10 to 10![[thin space (1/6-em)]](https://www.rsc.org/images/entities/char_2009.gif) 000 times less susceptible to antimicrobial compounds than the same organism in suspension, i.e. planktonic phase.35 These resistant properties of biofilms can lead to antibiotic-resistant infections, clogging of pipes, and contamination of food in industrial settings.36 Therefore, the investigation of biofilm removal capacity by MoS2 can be extremely valuable for diverse engineering and biomedical applications.
000 times less susceptible to antimicrobial compounds than the same organism in suspension, i.e. planktonic phase.35 These resistant properties of biofilms can lead to antibiotic-resistant infections, clogging of pipes, and contamination of food in industrial settings.36 Therefore, the investigation of biofilm removal capacity by MoS2 can be extremely valuable for diverse engineering and biomedical applications.
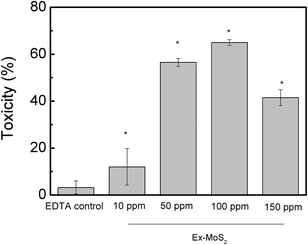
In the previous section, we determined that the best antibacterial capacity was achieved with Ex-MoS2 supplemented with 40 ppm of EDTA under light. Thus, the same condition was chosen to perform the biofilm detachment/inactivation investigation. The results (Fig. 5) showed that EDTA exhibited negligible toxicity after 3 h exposure. However, the biofilm removal capacity of Ex-MoS2 increased proportionally to the nanomaterial concentration from 10 to 100 ppm. The maximum biofilm removal (65%) was achieved at 100 ppm by Ex-MoS2 exposure. When the concentration of Ex-MoS2 went up to 150 ppm, the biofilm removal decreased to 41.5%.
The results of the comparison between planktonic cells and biofilm removal assays after 3 h of Ex-MoS2 exposure show that the planktonic cells always presented a higher loss of viability than biofilms for all the concentrations investigated. The lower toxicity of Ex-MoS2 towards biofilm can be explained by the presence of exopolymeric substances (EPS) secreted by biofilms.35 Several studies have proposed that EPS produced by biofilm can serve as a barrier against nanomaterials, thereby making the nanomaterial less toxic to cells in the biofilm than in planktonic phases.37,38 Similar observations have been reported for other antimicrobial chemicals and nanomaterials, like antibiotics, single-walled carbon nanotubes, and graphene oxide.1,35 It is also worth to point out that Ex-MoS2 presented a better performance than other nanomaterials. For instance, the study of Patil and collaborators demonstrated that 250 ppm of ZnO or 100 ppm of Ag/ZnO nanostructures can reduce biofilm growth by 50%.39 In the case of Ex-MoS2, 56.5% reduction of biofilm was obtained with only 50 ppm, which is 2–3 times lower than ZnO and Ag/ZnO. This biofilm reduction in biofilm growth by Ex-MoS2 can be explained by two potential mechanisms. The first one is that the cells are being inactivated by the ROS produced by the nanomaterials. The second mechanism could be that the reduction in biofilm growth was triggered by photocatalytic degradation or ROS oxidation of quorum sensing molecules involved in biofilm formation. The best performance shown by Ex-MoS2 compared to the other nanomaterials is probably because this nanomaterial is more efficient in inactivating microorganisms or degrading the quorum sensing molecules.40
Antimicrobial mechanisms of Ex-MoS2 and Ae-MoS2
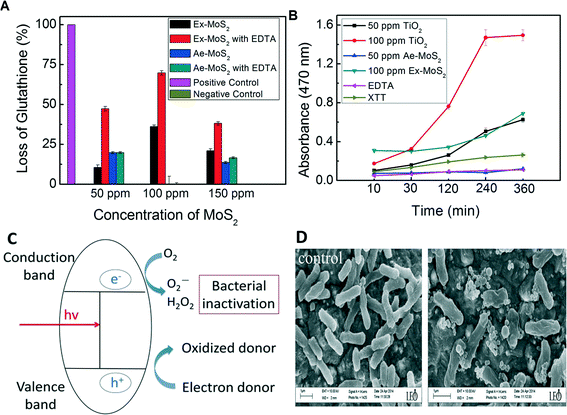
After determining the antimicrobial effects of Ex-MoS2-EDTA and Ae-MoS2-EDTA on E. coli, their antimicrobial activity mechanisms were investigated. Production of ROS is often suggested as a key antibacterial mechanism of several semiconductor and photocatalytic nanomaterials, such as TiO2 and MoO3.41,42 Because MoS2 is also a semiconductor and can perform photocatalytic reactions,43 we hypothesized that MoS2 could potentially produce ROS that could be inactivating the microorganisms. Therefore, in this present study we first used the thiol oxidation assay to evaluate the oxidative stress generated by H2O2.2 In this assay, EDTA, Ex-MoS2 and Ae-MoS2 alone were used as controls. The results show that EDTA (Fig. 6(A)) did not generate detectable H2O2. Ex-MoS2 and Ae-MoS2 alone produced some H2O2, but not as much as the Ex and Ae-MoS2 with EDTA. In the case of Ae-MoS2-EDTA, the highest oxidation capacity (19.8%) towards GSH was observed at 50 ppm. This assay also showed concentration dependency in the range of 50 ppm to 150 ppm (Fig. 6(A)). When comparing Ae-MoS2-EDTA with Ex-MoS2-EDTA, Ae-MoS2-EDTA showed less than 35% oxidation capacity than the latter.Furthermore, increasing concentrations, up to 100 ppm, of Ex-MoS2 in the presence of EDTA led to higher production of H2O2. At 150 ppm of Ex-MoS2-EDTA, the amount of GSH oxidized was 38.2%. In the absence of EDTA, on the other hand, the GSH oxidation capacity for Ex-MoS2 were at least 55% less than Ex-MoS2-EDTA. The results of the concentration-dependency of oxidation capacity of these nanomaterials were consistent with the antibacterial activity observed in Fig. 4(A) and (B).
Besides investigating the production of H2O2 by MoS2, production of superoxide anion (O2−) was also investigated using the XTT method. In this assay, the Ae-MoS2 and Ex-MoS2 concentrations that exhibited the highest antibacterial activity were selected. As shown in Fig. 6(B), the negative controls, XTT alone and EDTA-XTT dispersion did not show any increase in absorbance. In the case of Ex-MoS2, clear enhancement of absorbance was observed after 120 min incubation, whereas the Ae-MoS2 did not increase significantly the absorbance. These results indicate that Ae-MoS2 did not produce superoxide anions, but Ex-MoS2 did produce over time, which would explain not only the different antibacterial activities observed between the Ex-MoS2 and Ae-MoS2 presented in Fig. 4(A) and (B), but also the time-dependency of the antibacterial capacity of Ae-MoS2.
The mechanisms of production of superoxide ions and hydrogen peroxide by MoS2 and EDTA are suggested to happen in the following fashion: the semiconductor photocatalysts are excited by the presence of light to produce electron–hole pairs. Photogenerated electrons migrate to the conduction band, leaving a positive hole in the valence band.
| MoS2 + hv → MoS2(h+ + e−) |
The photoinduced hole can oxidize a donor molecule, which is EDTA in this study. Therefore, EDTA donates the electrons to the VB holes and form a MoS2-EDTA complex just like the process mentioned in the study of Kim and collaborators.44
| MoS2(h+) + EDTA4− → MoS2 − EDTA complex + MoS2(e−) |
Oxygen can act as an electron acceptor, and be reduced by the excited electron in the conduction band to form a superoxide ion.
| MoS2(e−) + O2 → O2− |
This unstable superoxide can react with water molecules and form hydrogen peroxides, which are responsible for the inactivation of E. coli.
| O2− + 2H2O → H2O2 + 2OH˙ |
The graphical toxicity mechanism of Ex-MoS2 is also presented in Fig. 6(C).
To further confirm the antimicrobial activity of Ex-MoS2-EDTA, scanning electron microscope images were taken to determine changes in cell morphology of E. coli K12 exposed to Ex-MoS2-EDTA. The SEM images (Fig. 6(D)) showed that the control cells (not exposed to Ex-MoS2-EDTA) were intact and maintained their outer membrane structure. In contrast, in Ex-MoS2-EDTA treated cells, instead of normal rod-shaped cells, the cells shrunk and were deformed, indicating cell damage. Previous studies demonstrated that ROS species can increase cell damage and leakage of cell contents, which could also been observed through SEM images like in our study.45–47
Cytotoxicity of MoS2 against NIH 3T3 fibroblast cells
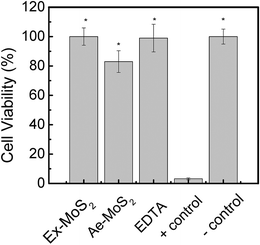
The antibacterial properties of nanomaterials open a window of opportunities for biomedical applications.48 However, it is critical to evaluate the adverse effects of these nanomaterials to human health for potential applications that will involve human exposure. To investigate the cytotoxic effects of the nanomaterial toward eukaryotic cells, NIH 3T3 fibroblast cells were exposed for 3 h to MoS2 concentrations with the highest antimicrobial activity, which was determined to be 50 and 100 ppm for Ae-MoS2 and Ex-MoS2, respectively.As shown in Fig. 7, the cells exposed to Ex-MoS2 presented no mortality, while the ones exposed to Ae-MoS2 presented a mortality of 18%. However, ZnO, another widely used nanomaterial, exhibited more than 80% cytotoxicity towards NIH 3T3 fibroblast cells after exposure to 40 ppm.13 Furthermore, nano-ZnO2 and nano-TiO2 also showed 34.4% and 33.7% cytotoxicity, respectively, as reported in a previous study.49 Therefore, the very low cytotoxicity observed for Ex-MoS2 makes it a very promising material for applications involving human exposure.
Conclusions
The antibacterial activity of Ex-MoS2 and Ae-MoS2 in the presence or absence of light and sacrificial electron donor was evaluated. Ex-MoS2 demonstrated higher antibacterial capacity than Ae-MoS2. The addition of electron donors and light source increased the antibacterial activity by more than 50%. The antibacterial activity of MoS2 may be attributed to oxidative stress coming from superoxide radical anion (O2−) and hydrogen peroxide (H2O2). The higher antibacterial capacity of Ex-MoS2 than Ae-MoS2 may be mostly due to a higher ratio of metallic 1T-phase. Most importantly, compared with the most commonly used photocatalyst, i.e. TiO2; Ex-MoS2 was demonstrated to have higher antibacterial effects in the presence of an electron donor with the advantage of activation under visible light. Additionally, we confirmed that Ex-MoS2 was not toxic to fibroblast cells. Nanomaterials with efficient antibacterial properties and that are non-toxic to humans have an enormous potential for industrial, biomedical, and water treatment applications. Thus, the potential of this nanomaterial for uses in biomedical applications is enormous, because of its antibacterial properties and low toxic effects to mammalian cells.Acknowledgements
We would like to thanks Dr. Felipe Ibanez for assisting with the agar plate count method and Professor Ralph B. Arlinghaus for giving us the mammalian cells for this investigation. Y. Yao acknowledge the funding support from the Office of Naval Research Young Investigator Award (ONR N00014-13-1-0543) for the synthesis and characterization of MoS2 samples.Reference
- I. E. Mejias Carpio, C. M. Santos, X. Wei and D. F. Rodrigues, Nanoscale, 2012, 4, 4746–4756 RSC
.
- S. Liu, T. H. Zeng, M. Hofmann, E. Burcombe, J. Wei, R. Jiang, J. Kong and Y. Chen, ACS Nano, 2011, 5, 6971–6980 CrossRef CAS PubMed
.
- M. N. Chong, B. Jin, C. W. Chow and C. Saint, Water Res., 2010, 44, 2997–3027 CrossRef CAS PubMed
.
- C. Srinivasan and N. Somasundaram, Curr. Sci., 2003, 85, 1431–1438 CAS
.
- S. George, S. Pokhrel, Z. Ji, B. L. Henderson, T. Xia, L. Li, J. I. Zink, A. E. Nel and L. Madler, J. Am. Chem. Soc., 2011, 133, 11270–11278 CrossRef CAS PubMed
.
- A. Nemmar, K. Melghit, S. Al-Salam, S. Zia, S. Dhanasekaran, S. Attoub, I. Al-Amri and B. H. Ali, Toxicology, 2011, 279, 167–175 CrossRef CAS PubMed
.
- X. Zong, Y. Na, F. Wen, G. Ma, J. Yang, D. Wang, Y. Ma, M. Wang, L. Sun and C. Li, Chem. Commun., 2009, 4536–4538, 10.1039/b907307h
.
- T. R. Thurston and J. P. Wilcoxon, J. Phys. Chem. B, 1998, 103, 11–17 CrossRef
.
- U. Maitra, U. Gupta, M. De, R. Datta, A. Govindaraj and C. N. Rao, Angew. Chem., Int. Ed., 2013, 52, 13057–13061 CrossRef CAS PubMed
.
- C. F. Zhu, Z. Y. Zeng, H. Li, F. Li, C. H. Fan and H. Zhang, J. Am. Chem. Soc., 2013, 135, 5998–6001 CrossRef CAS PubMed
.
- N. Qureshi, R. Patil, M. Shinde, G. Umarji, V. Causin, W. Gade, U. Mulik, A. Bhalerao and D. Amalnerkar, Appl. Nanosci., 2015, 5, 331–341 CrossRef CAS
.
- H. J. Hoben and P. Somasegaran, Appl. Environ. Microbiol., 1982, 44, 1246–1247 CAS
.
- T. O. Okyay, R. K. Bala, H. N. Nguyen, R. Atalay, Y. Bayam and D. F. Rodrigues, RSC Adv., 2015, 5, 2568–2575 RSC
.
- G. Eda, H. Yamaguchi, D. Voiry, T. Fujita, M. Chen and M. Chhowalla, Nano Lett., 2011, 11, 5111–5116 CrossRef CAS PubMed
.
- A. Splendiani, L. Sun, Y. Zhang, T. Li, J. Kim, C.-Y. Chim, G. Galli and F. Wang, Nano Lett., 2010, 10, 1271–1275 CrossRef CAS PubMed
.
- O. Y. Posudievsky, O. A. Khazieieva, V. V. Cherepanov, G. I. Dovbeshko, A. G. Shkavro, V. G. Koshechko and V. D. Pokhodenko, J. Mater. Chem. C, 2013, 1, 6411–6415 RSC
.
- K. F. Mak, C. Lee, J. Hone, J. Shan and T. F. Heinz, Phys. Rev. Lett., 2010, 105, 136805 CrossRef PubMed
.
- H. Li, Z. Yin, Q. He, H. Li, X. Huang, G. Lu, D. W. H. Fam, A. I. Y. Tok, Q. Zhang and H. Zhang, Small, 2012, 8, 63–67 CrossRef CAS PubMed
.
- A. Galińska and J. Walendziewski, Energy Fuels, 2005, 19, 1143–1147 CrossRef
.
- M. R. Hoffmann, S. T. Martin, W. Choi and D. W. Bahnemann, Chem. Rev., 1995, 95, 69–96 CrossRef CAS
.
- A. Kudo and Y. Miseki, Chem. Soc. Rev., 2009, 38, 253–278 RSC
.
- U. Pal, S. Ghosh and D. Chatterjee, Transition Met. Chem., 2012, 37, 93–96 CrossRef CAS
.
- M. Ni, M. K. H. Leung, D. Y. C. Leung and K. Sumathy, Renewable Sustainable Energy Rev., 2007, 11, 401–425 CrossRef CAS
.
- B. M. Rathgeber, P. McCarron and K. L. Budgell, Poult. Sci., 2013, 92, 2457–2462 CrossRef PubMed
.
- A. D. Satroutdinov, E. G. Dedyukhina, T. I. Chistyakova, I. G. Minkevich, V. K. Eroshin and T. Egli, Microbiology, 2003, 72, 8–11 CAS
.
- L. K. Adams, D. Y. Lyon and P. J. Alvarez, Water Res., 2006, 40, 3527–3532 CrossRef CAS PubMed
.
- N. Padmavathy and R. Vijayaraghavan, Sci. Technol. Adv. Mater., 2008, 9 Search PubMed
.
- X. Yang, J. Li, T. Liang, C. Ma, Y. Zhang, H. Chen, N. Hanagata, H.-X. Su and M. Xu, Nanoscale, 2014, 6, 10126–10133 RSC
.
- D. Pei and J. Luan, Int. J. Photoenergy, 2012, 2012, 13 CrossRef
.
- P. H. Chen, C. Y. Chen and C. H. Jenq, Water Supply, 1995, 13, 29–34 CAS
.
- M. A. Lukowski, A. S. Daniel, F. Meng, A. Forticaux, L. Li and S. Jin, J. Am. Chem. Soc., 2013, 135, 10274–10277 CrossRef CAS PubMed
.
- W. A. Daoud, J. H. Xin and Y.-H. Zhang, Surf. Sci., 2005, 599, 69–75 CrossRef CAS
.
- W. Kangwansupamonkon, V. Lauruengtana, S. Surassmo and U. Ruktanonchai, Nanomedicine, 2009, 5, 240–249 CrossRef CAS PubMed
.
- D. G. Davies, M. R. Parsek, J. P. Pearson, B. H. Iglewski, J. W. Costerton and E. P. Greenberg, Science, 1998, 280, 295–298 CrossRef CAS PubMed
.
- D. F. Rodrigues and M. Elimelech, Environ. Sci. Technol., 2010, 44, 4583–4589 CrossRef CAS PubMed
.
- M. A. Schembri, K. Kjaergaard and P. Klemm, Mol. Microbiol., 2003, 48, 253–267 CrossRef CAS PubMed
.
- I. W. Sutherland, Microbiology, 2001, 147, 3–9 CrossRef CAS PubMed
.
-
M. Starkey, K. A. Gray, S. I. Chang and M. R. Parsek, Microbial biofilms, ASM Press, Washington, DC, 2004, pp. 174–191 Search PubMed
.
- S. Patil, R. Patil, S. Kale, M. Tamboli, J. Ambekar, W. Gade, S. Kolekar and B. Kale, J. Nanopart. Res., 2014, 16, 1–11 CrossRef CAS
.
- S. Gurunathan, J. Han, D.-N. Kwon and J.-H. Kim, Nanoscale Res. Lett., 2014, 9, 1–17 CrossRef PubMed
.
- K. Krishnamoorthy, M. Premanathan, M. Veerapandian and S. J. Kim, Nanotechnology, 2014, 25, 315101 CrossRef PubMed
.
- S. Liu, T. H. Zeng, M. Hofmann, E. Burcombe, J. Wei, R. Jiang, J. Kong and Y. Chen, ACS Nano, 2011, 5, 6971–6980 CrossRef CAS PubMed
.
- K. Sunada, Y. Kikuchi, K. Hashimoto and A. Fujishima, Environ. Sci. Technol., 1998, 32, 726–728 CrossRef CAS
.
- G. Kim and W. Choi, Appl. Catal., B, 2010, 100, 77–83 CrossRef CAS
.
- I. Sondi and B. Salopek-Sondi, J. Colloid Interface Sci., 2004, 275, 177–182 CrossRef CAS PubMed
.
- S. Kang, M. Pinault, L. D. Pfefferle and M. Elimelech, Langmuir, 2007, 23, 8670–8673 CrossRef CAS PubMed
.
- S. C. Smith and D. F. Rodrigues, Carbon, 91, 122–143 CrossRef CAS
.
- F. Ahmed, C. M. Santos, R. A. M. V. Vergara, M. C. R. Tria, R. Advincula and D. F. Rodrigues, Environ. Sci. Technol., 2011, 46, 1804–1810 CrossRef PubMed
.
- G. Karunakaran, R. Suriyaprabha, P. Manivasakan, R. Yuvakkumar, V. Rajendran and N. Kannan, Ecotoxicol. Environ. Saf., 2013, 93, 191–197 CrossRef CAS PubMed
.
Footnote |
| † Electronic supplementary information (ESI) available. See DOI: 10.1039/c5en00031a |
| This journal is © The Royal Society of Chemistry 2015 |


