Nanoproducts – what is actually available to European consumers?
Steffen
Foss Hansen
*,
Laura Roverskov
Heggelund
,
Pau
Revilla Besora
,
Aiga
Mackevica
,
Alessio
Boldrin
and
Anders
Baun
Department of Environmental Engineering, Technical University of Denmark, Kgs. Lyngby, DK-2800, Denmark. E-mail: sfha@env.dtu.dk
First published on 17th December 2015
Abstract
It remains unclear which kinds of nanoproducts are available on the European market, although this information is a prerequisite for any kind of exposure and risk assessment. In order to address this lack of information, we have established The Nanodatabase (http://www.nanodb.dk), which is an online inventory of products claimed by manufacturers to contain nanomaterials (NMs) or be based on nanotechnology. The database currently entails 2231 products. The database is unique and includes basic information about the product (name, NM used, location of NM, product category, etc.) as well as a safety evaluation of each individual product according to the NanoRiskCat-framework. Our analysis of products that are currently present in the database shows that most products fall into “personal care” and “clothing” categories (≥300), followed by “sporting goods” and “cleaning” (>200). Silver and titanium dioxide are the most used NMs, but it is not possible to identify the NMs used for almost 60% of the products in the database. The data analysis shows that for most product categories the dominant route of exposure is dermal, and that the exposure potential as well as human and environmental hazard potential of most products is either “high” or “unknown”. In order to address the current lack of reporting by manufacturers when it comes to nanoproducts, we recommend that it is made mandatory to disclose and report any nanomaterials used in a consumer product and it becomes illegal to advertise and market products as “nano” when they have no content of nanomaterials.
Nano impactIn this paper we present The Nanodatabase, which is a unique online database on European consumer products that are claimed to entail nanomaterials or are based on nanotechnology. The database is contumely updated with 10–25 products per week and provides a unique overview of which kinds of products and nanomaterials are being used. It furthermore maps potential exposure pathways and provide an initial safety evaluation of the products in The Nanodatabase. The information provided by The Nanodatabase provides key information needed to enable future exposure and risk assessment of nanomaterials used in consumer products. |
1. Introduction
The development of nanotechnology and nanomaterials has the potential to revolutionize all aspects of production and manufacturing of goods and services in Europe, as well as in the rest of the world. When it comes to the application of nanotechnology and nanomaterials in consumer products, it is unclear what is actually on the European market and how the number and types of products have developed and changed over time. Very little information is also available with respect to what and how much consumers are exposed to, and when they are exposed. The general lack of data hampers qualitative and quantitative consumer exposure assessment of nanomaterials.A number of inventories containing information about nanomaterials and nanoproducts do exist, such as the Consumer Product Inventory (CPI) of the Project of Emerging Nanotechnologies (PEN), the Nanoproduktdatenbank maintained by the Bund für Umwelt und Naturschutz Deutschland (BUND) and the inventory established by the European Association for the co-ordination of Consumer Representation in Standardisation (ANEC)/The European Consumer Organisation (BEUC) containing products available on the EU market claiming to contain nanosilver particles. The inventory by the PEN, which was the first of its kind, arguably tends to have a focus on North American market and has only been updated about once a year since it originally launched in 2006.1,2 The BUND datenbank is mainly focused on products available on the German market and is only available in German, whereas the ANEC/BEUC focusses specifically on products with nanosilver and has not been updated since 2013.3,4
According to the cosmetics regulation in the EU, the European Commission is required to publish a catalogue of nanomaterials used in cosmetic products on the European market, but the publication has been delayed due to “anomalities” in the notifications by the industry.5 Recently, the European Commission decided against the establishment of an EU-wide nanomaterial register, as it was not perceived as an appropriate way to provide information to consumers on nanomaterials and that full coverage of all nanomaterials and mixtures would be difficult to achieve.6 Conversely, Belgian, Danish and French governments have proposed and established their own nanomaterial/product inventories, but the gathered information is only made publically available in an overview and summary format and has generally been considered not to “…add much more to what it could be already known by an informed audience”.7
Collectively, all the above-mentioned inventories have a number of limitations. First of all, they are not being continuously updated, meaning that months or even years may pass before the provided information is checked and updated. Secondly, the inventories contain a large number of ‘dead’ products, i.e. products that are no longer on the market. Thirdly, some of the inventories are not available to the public, thereby preventing consumers from easy access to information regarding products they buy. None of the inventories provide analysis tools that would enable researchers and others to do their own independent analysis of the data and information. Finally, the inventories do not contain any health and safety information, so the provided information has only a limited use. A comparative analysis of the different databases and inventories is provided in Table 1.
| Name | Est. | Scope | Update frequency | Sources | Limitations | Strengths | Ref. |
|---|---|---|---|---|---|---|---|
| The Nanodatabase | 2012 | 1) Products claimed to contain NMs or be based on NT | Daily | 1) Online search | 1) Based on claims | 1) Updated daily | 8, 9 |
| 2) Products available to European consumers | 2) Reporting by users | 2) Specifically focused on EU | 2) Possible for users to do their own analysis | ||||
| 3) Includes hazard potential evaluation (NanoRiskCat) | |||||||
| 4) Publically available | |||||||
| CPI | 2006 | 1) Products claimed to contain NMs or be based on NT | Annually | 1) Online search | 1) Based on claims | 1) Evaluation of claims in regard to credibility | 2, 10, 11 |
| 2) Products available globally | 2) Reporting by users | 2) Only updated periodically | 2) Publically available | ||||
| 3) Tends to have a focus on American market | |||||||
| ANEC/BEUC | 2010 | 1) Products claimed to contain nanosilver | Unclear | 1) Online search | Not updated since 2013 | 1) Publically available | 1, 11 |
| 2) Products available to European consumers | 2) Reporting by users | ||||||
| CSF Nanotechnology in Food | 2015 | 1) Food-products claimed to contain NMs | Unclear | Other nanodatabases e.g. The Nanodatabase | 1) Based on other databases | 1) Publically available | 12 |
| Bund Nanoproduktdatenbank | 2010 | 1) Products claimed to contain NMs or be based on NT | Unclear | 1) Online search | 1) Only available in German | 1) Publically available | 11, 13 |
| 2) Products available in Germany | 2) Reporting by users | 2) Tends to have a focus on German market | |||||
| Danish nanoproduct registry | 2014 | Nanoproducts available in Denmark | Annually | Producers and importers to report products containing or releasing nanomaterials | 1) Numerous exemptions include food contact materials, cosmetics, mixtures, printed articles (newspapers or labels), textiles containing NMs in the colours or dyes; paints, wood preservatives, glues and fillers, that contain nanoscale pigments used solely as colourants, rubber articles that contain nano carbon black or silicon dioxide and articles containing a) unintentionally produced NMs, b) “fixed” NMs | 1) Reporting mandatory by manufacturers | 7, 14 |
| 2) Information about concentration of the nanomaterial in the product, particle size distribution and specific surface area is voluntary | |||||||
| 3) Not publically available | |||||||
| Belgian NM registry | 2016 | Substance manufactured at the nanoscale | Annually | Producers of at least 100 grams nanoparticles per year | 1) Not publically available | 1) Reporting mandatory by manufacturers | 7, 15, 16 |
| 2) Exemptions include e.g. cosmetic products, biocides and treated articles, pigments, etc. | |||||||
| French NM compulsory reporting scheme | 2013 | Substance manufactured at the nanoscale | Annually | Producers, importers or distributers at least 100 grams nanoparticles per year | 1) Limited information made publically available e.g. chemical name and the uses of the NMs | 1) Reporting mandatory by manufacturers | 7, 17 |
In order to address these limitations, we established The Nanodatabase (http://www.nanodb.dk) in 2012. The Nanodatabase is an online inventory of products claimed by manufacturers or others (e.g. retailers, product reviews) to contain nanomaterials (NMs) in Europe. Along with a description of the product, The Nanodatabase provides the available exposure/hazard information. To broaden its usefulness, The Nanodatabase is equipped with different analytical tools, allowing the user to sort and extract data in different ways.
The objective of this paper is two-fold. The first objective is to describe the general structure of The Nanodatabase, to illustrate its functioning and to explain how data is collected. The second objective is to present the findings of our analysis of the products currently in The Nanodatabase when it comes to i) the development of commercialization of nanoproducts in the EU since 2012, ii) distribution of nanoproducts and nanomaterials across various product categories and iii) distribution of products according to their potential route of exposure and nanomaterial exposure and hazard potential. In the following, the methodology used to identify products to include in The Nanodatabase will be presented along with the methodology used to collect data and information about each individual product. In the second part of the paper, the findings from our analysis of the products currently listed in The Nanodatabase will be presented and discussed. Finally, we will highlight the limitations of our work and provide a set of recommendations on how they can be overcome in the future.
2. Methodology
2.1. Product identification
In order to identify products to include in The Nanodatabase in 2012, we first trawled the existing databases including the PEN inventory (now CPI), the BUND database, BEUC and http://Nanotech-data.com. Criteria for including products in our inventory were: 1) there is a “nano-claim” and the presence of “nano” or nanomaterials is explicitly mentioned in the product description and 2) the products can be purchased by EU consumers in retail or via online shopping. Since 2012, we have continued to identify new products and added these to The Nanodatabase by searching on-line webshops as well as following up on hints from the users of The Nanodatabase.2.2. Collecting information about nanoproducts
For individual products fulfilling the above mentioned criteria and entered in the database, we collected a series of information and data on the product (i.e. the year of production, the type of product, the type of nanomaterial, the country of origin, the country of production, the manufacturer), along with the manufacturer's description, an image of the product, and (when available) a link to an external website where the product was originally found. The product types or categories and subcategories e.g. “health and fitness”, “home and garden” and “sporting good” were adopted from the CPI in order to allow for transatlantic comparison between the CPI and The Nanodatabase. Based on the collected information and data, we then derived information about the potential exposure pathway (i.e. dermal, inhalation, oral), the location of the nanomaterial in the matrix, and the likely waste material fraction where the product could end up at its end-of-life (EOL). With respect to nanostructure, products were classified according to the methodology proposed and applied by Hansen et al.,18,19 where nanomaterials are categorized according to whether the “nanoelement” is located in the bulk or on the surface of a given product or whether it consists of a) surface bound nanoparticles, b) nanoparticles suspended in a solid, c) nanoparticles suspended in a liquid or as d) airborne nanoparticles. For the EOL phase, we have identified 13 fractions potentially relevant (see Table 2) while only 10 are currently significant (Heggelund et al.20).| Item | Options | Hypothetical example | |
|---|---|---|---|
| General information | Entry date | 21-08-2015 | |
| Product information | T-shirt | ||
| Manufacturer's description | “Nanopro-T-shirt exploits the unique properties of nanosilver to limit smell during exercise” | ||
| Others say | Not available | ||
| Image | Not available | ||
| Product classification | Year of production | 2012 | 2014 |
| 2013 | |||
| 2014 | |||
| 2015 | |||
| Category | Appliances | Health and fitness | |
| Automotive | |||
| Electronics and computers | |||
| Food and beverage | |||
| Goods for children | |||
| Health and fitness | |||
| Home and garden | |||
| Impossible to categorize | |||
| Location of the nanomaterial | Airborne | Surface bound | |
| Film | |||
| Multiphase | |||
| Powder | |||
| Structured film | |||
| Surface bound | |||
| Suspended in liquid | |||
| Suspended in solid | |||
| Unknown | |||
| Waste material | Batteries | Textile | |
| Ceramics | |||
| Electronics | |||
| Glass | |||
| Metal | |||
| Multi material waste | |||
| Other plastic | |||
| Paper | |||
| Plastic from used product containers | |||
| Shredder waste | |||
| Textile | |||
| Unknown | |||
| Wood | |||
| Country of origin | Spain | ||
| Country of production | Denmark | ||
| Manufacturer | Nano-T | ||
| Availability | Denmark and all other European countries | Europe | |
| Potential exposure pathways | Dermal, inhalation, oral | Dermal | |
| NanoRiskCat | Exposure potential for professional end-users | Red (high), yellow (medium), green (low), gray (unknown) | Red (high) |
| Exposure potential for consumers | Red (high), yellow (medium), green (low), gray (unknown) | Red (high) | |
| Exposure potential for environment | Red (high), yellow (medium), green (low), gray (unknown) | Red (high) | |
| Human hazard potential | Red (high), yellow (medium), green (low), gray (unknown) | Red (high) | |
| Environmental hazard potential | Red (high), yellow (medium), green (low), gray (unknown) | Red (high) |
For each of the products entered in The Nanodatabase, we furthermore filled out a so-called NanoRiskCat-profile following the methodology outlined in Hansen et al.,21 which includes a short-title describing the intended use of the product and five colored dots providing our evaluation on exposure and hazard potential for the nanoproduct in question (see Fig. 1). The first three dots refer to the qualitative exposure potential for professional end-users, consumers and the environment, whereas the last two refer to the hazard potential for humans and the environment. Each dot can be assigned one of four different colors, i.e. red, yellow, green, and gray indicating high, medium, low, and unknown potentials, respectively. NanoRiskCat is a systematic tool that was originally developed to support companies and regulators in their first-tier assessment and communication on what they know about the hazard and exposure potential of consumer products containing engineered nanomaterials (see Hansen et al.21 for more details on NanoRiskCat). The scope of NanoRiskCat is to evaluate the nanomaterial as an ingredient as it occurs in a given product, considering the physical conditions and immediate availability of the nanomaterial. However, NanoRiskCat does not include an evaluation of the amount of nanomaterial in the product as well as exposure and effects from the other constituents and impurities in the product. In this sense, NanoRiskCat is a tool that can be used for safety evaluation, risk screening and categorization, but it cannot be used for risk assessment per se.
 | ||
| Fig. 1 Example of a NanoRiskCat evaluation on exposure and hazard potential for a given nanoproduct. | ||
All the above-mentioned information is made available at http://www.nanodb.dk, where products are classified, searchable and sortable based on the collected information as shown in Table 2.
2.3. Analytical capabilities
The Nanodatabase is equipped with a number of analytical options for filtering, sorting and extracting data from The Nanodatabase. The analytical options are publically available and can be found under the header “analysis” at http://www.nanodb.dk and allow filtering the products included in The Nanodatabase according to the ‘product classification’ properties listed in Table 2 (all combinations are possible). The results of the search can be displayed in different chart types (i.e. column, line, pie, area), depending on the preferences of the user; the charts can be exported in different formats, such as PNG, JPEG, PDF, SVG.3. Results and discussion
3.1. Development of commercialization of nanoproducts in the EU
The number of products contained in The Nanodatabase has been steadily increasing over time: 1212 products were originally in the database from the outset in 2012 and this number has risen to more than 2200 in 2015 (see Fig. 2). At the moment, between 10 and 25 products are added per week. The increase in the number of products is primarily the result of increased marketing of nanoproducts, as nanomaterials are employed in new applications. A total of 59 products have been retracted from the market and 16 products have lost their “nanoclaim” since 2012.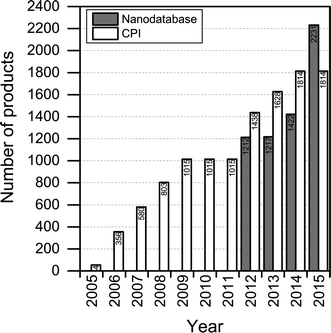 | ||
| Fig. 2 Number of products listed in The Nanodatabase in the period January, 2012–August, 2015, and in the Consumer Product Inventory (CPI) in the period 2005–2015. | ||
Compared to the CPI, The Nanodatabase contains 400 more products (corresponding to about 20%) (see Fig. 2), despite of the fact that the scope of The Nanodatabase is limited to Europe whereas CPI has a global perspective (see Table 1). This can be explained by the fact that The Nanodatabase is updated weekly, whereas the CPI is updated every 18 months, and the fact that there has been a rapid growth in the number of products available in Europe in 2015 and hence listed in The Nanodatabase.
3.2. Distribution of nanoproducts in product categories and subcategories
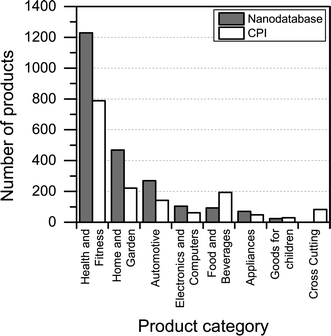
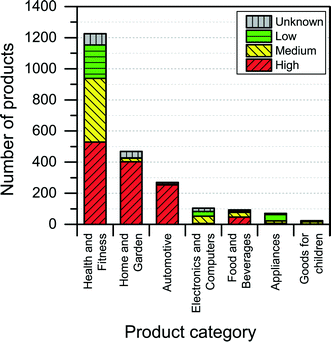
Most of the products listed in The Nanodatabase belong the product category “health and fitness” (55%), followed by “home and garden” (21%) and “automotive” (12%) (see Fig. 3).Compared to the CPI, The Nanodatabase contains 53%, 47%, 35% and 32% more products in the categories of “home and garden”, “automotive”, “health and fitness” and “appliances”, respectively. When it comes to “goods for children”, the CPI contains 5 more products than The Nanodatabase corresponding to 20% (see Fig. 3). In The Nanodatabase individual product categories entail a number of subcategories such as for instance personal care, clothing and cleaning (see Fig. 4). In some cases, for example in the ‘health and fitness’ category, products fall into several different subcategories, suggesting a broad range of applications of nanotechnologies in a specific field (see Fig. 4a). In other cases, such as ‘home and garden’, nanomaterial utilization is restricted to fewer or single subcategories, suggesting a potential for further development and utilization of nanotechnologies in this area (see Fig. 4b).
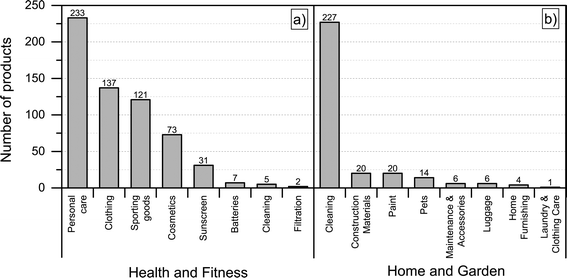 | ||
| Fig. 4 Distribution of a) ‘health and fitness’ products into subcategories; b) “home and harden” products into subcategories. | ||
3.3. Nanomaterials reported to be used
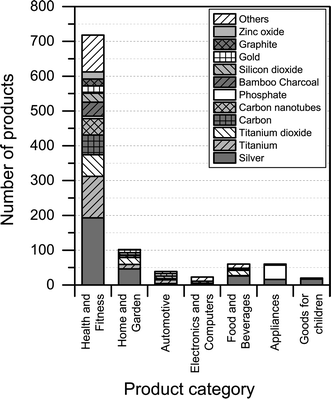
Fig. 5 shows the identity of nanomaterials that are claimed to be used across the various product categories in The Nanodatabase.The analysis shows that silver is the most prominently used nanomaterials across all product categories (see Fig. 5). Other nanomaterials are specifically relevant for specific product categories: carbon nanotubes and bamboo charcoal in “health and fitness”; titanium dioxide in “health and fitness” and “home and garden”; gold in “appliances”, “health and fitness” and “home and garden”; titanium in “automotive”, “health and fitness” and “home and garden”; and phosphate in “appliances”. It should be noted that for a large number of products, it was not possible to identify and/or report the type of nanomaterial employed due to the lack of information provided by the manufacturer. This was especially the case for the product categories ‘automotive’, ‘electronics and computers’, and ‘home and garden’, where 89%, 79%, and 80% of the products respectively could not be associated with a specific nanomaterial type. The share of unknown nanomaterial was 15%, 17%, 35%, and 47% for ‘appliances’, ‘goods for children’, ‘food and beverages’, and ‘health and fitness’ respectively.
When it comes to the nanomaterial reported being used in the different products, there is quite some difference between the CPI and The Nanodatabase (see Fig. 6). With respect to titanium/titanium dioxide, carbon, carbon nanotubes and gold, The Nanodatabase has 62%, 32%, 36% and 26% more products, respectively, compared to the CPI. The CPI contains 43% more products than The Nanodatabase when it comes to nanosilver. This might be explained by global perspective of the CPI and the fact that many of the nanosilver-containing products originate from America or Asia (e.g. Korea, China, Japan, Taiwan) not commercially available in the EU.22 Furthermore, CPI has historically put a large effort into including nanosilver-containing products.23
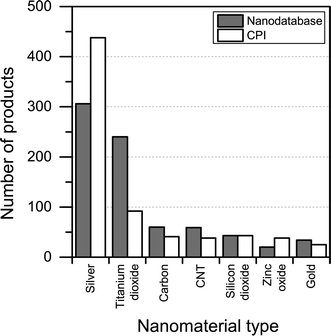 | ||
| Fig. 6 Nanomaterial claimed to being used in the different products in The Nanodatabase compared to CPI. | ||
The Nanodatabase (and CPI, the BUND Nanoproduktdatenbank and other public inventories) only contains products where the manufacturer or others have claimed that they contain nanomaterials, but nanomaterials are also being used in consumer products where the manufacturer has not disclosed this information publically. In 2012, the European Commission24 published a so-called Staff Working Paper (SWP) accompanying the second regulatory review on nanomaterials. From this SWP, it is clear that a wide range of nanomaterials is used in products and processes that could potentially be relevant for consumers. For instance, silica is also well known to be widely used in food industry (e.g. for clarifying wine, beer and fruit juice) but according to the data collected in The Nanodatabase, silica is not proclaimed to be used in any of the more than 90 products currently listed in the category of “food and beverages”. There are 2 products with nanosilica in the category of “food and beverages”, but both of these are reported to contain nanoparticles by third parties. Similarly, carbon black and carbon nanotubes are widely used in ‘automotive’ industry, but do not appear under that category in the database.
The lack of reporting of the identity of the nanomaterials used is a major limitation for any effort to obtain an overview of what kind of nanomaterials are actually being used in products available to European consumers, as well as for any kind of subsequent exposure and hazard evaluation. Knowing the identity of the nanomaterial or chemical substance is the starting point for any kind of exposure assessment, hazard evaluation and risk assessment. It is noteworthy that even for the category “cosmetics”, in which products containing nanomaterials must be labelled with the term [nano] as part of the list of ingredients according to the European Cosmetics Directive, the identity of the nanomaterial is not reported for almost 50% of the products found in The Nanodatabase.
3.4. Potential route of exposure
Another interesting aspect when it comes to understanding the health and safety aspects of nanoproducts is the potential route of exposure associated with use. We found that dermal exposure is the most prominent route of exposure for most product categories (Fig. 7). Inhalation exposure may be significant for “automotive” and “home and garden” categories, whereas, as expected, oral exposure may be more significant when considering product categories such as “food and beverages” and “health and fitness”. When looking at Fig. 7, it is important to note that the figure only displays the potential route of exposure across the individual product categories (if exposure takes place), while not including any considerations regarding whether the exposure is high, medium or low.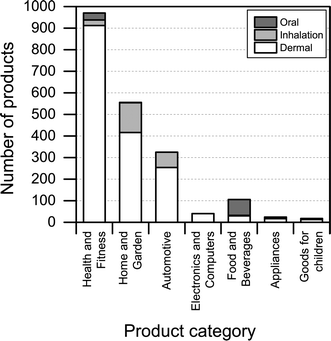 | ||
| Fig. 7 Potential route of exposure for individual product categories. Please note that individual products may have more than one route of exposure. | ||
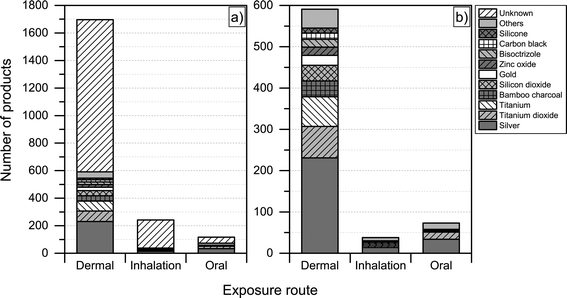
For the nanoproducts in the database for which the nanomaterials are reported, silver is the most prominent nanomaterial type when it comes to dermal exposure (see Fig. 8 and 9), followed by titanium dioxide and bamboo charcoal. For inhalation, silver is the most prevalent nanomaterial followed by titanium, titanium dioxide and gold. Finally, a total 34 products would lead to the oral exposure of nanosilver, whereas 17 and 4 would lead to oral exposure of nanotitanium dioxide and nanocalcium, respectively (see Fig. 8 and 9).
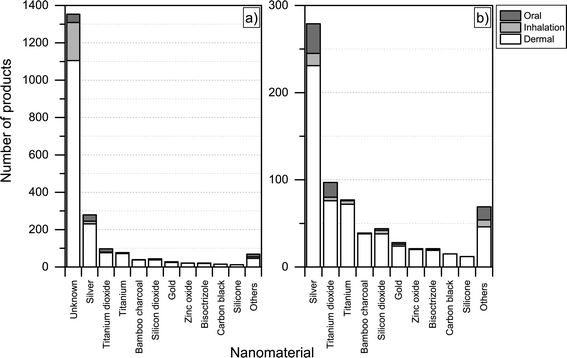 | ||
| Fig. 8 Potential routes of exposure with respect to individual nanomaterials a) including unknown; b) excluding products where the used nanomaterial is ‘unknown’. | ||
3.5 NanoRiskCat – safety evaluation of the individual products
Too provide some health and safety information about the individual nanoproducts in the database, the NanoRiskCat-framework is applied to the 2231 different products in the database. This NanoRiskCat-profile, which explains the reasoning behind the exposure and hazard profile for each specific product, is made available along with the information collected and listed in Table 2.The consumer and environmental exposure potential was found to be high (i.e., red) for many of the products that were intended for direct application on skin and could cause subsequent environmental release (see Fig. 10 and 11).
When it comes to potential route of exposure, an interesting finding was that if the identity of the nanomaterial used in the product is not reported by the manufacturers, then there also seems to be a high potential of human and environmental exposure to that product. This was also reflected in the exposure evaluation of the NanoRiskCat-profiles of many of the various products, which turned out to be “red”, thereby indicating a high level of exposure potential. Out of the 1311 products for which the nanomaterial is not reported, 64% have a red NanoRiskCat-profile when it comes to consumer and environmental exposure. For nanosilver, nanotitanium dioxide and nanosilica the numbers for a high exposure potential are 46%, 98% and 98%, respectively.
However, it has to be noted that the exposure evaluation is quite simple in the sense that the exposure evaluation in the NanoRiskCat-framework is solely based on the information provided by the manufacturers and an evaluation of the location of the “nanoelement” in the product, if no other information is available to perform the evaluation. More often than not, the manufacturers provide no information that enables a more detailed exposure evaluation. For example, the concentration of nanomaterial(s) in the product is most often not available and. this is a major obstacle hampering quantitative exposure evaluations.25,26 In order to make these exposure evaluations more relevant for nanomaterials and not rely solely on exposure assessment methods and models developed for conventional chemicals crucial information would be, the particle number concentration, size and coating of the nanomaterials used in the products, their state of aggregation and agglomeration as well as their dustiness, and potential for penetrating the skin (Mackevica & Hansen, 2016).
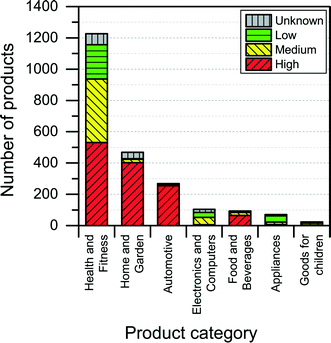
The NanoRiskCat human hazard and environmental hazard evaluation turns out either red or gray for a majority of the products (see Fig. 12 and 13). The “gray” human hazard potentials are due to the unknown identity of the nanomaterial used. Without even knowing the chemical composition of the nanomaterial, it is impossible to make any kind of hazard evaluation.
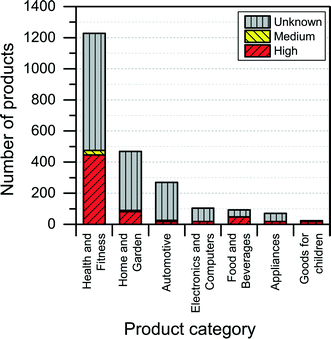 | ||
| Fig. 12 Distribution of NanoRiskCat human hazard profiles across different product categories. Red, yellow, green and gray colors indicate high, medium, low and unknown hazard potential. | ||
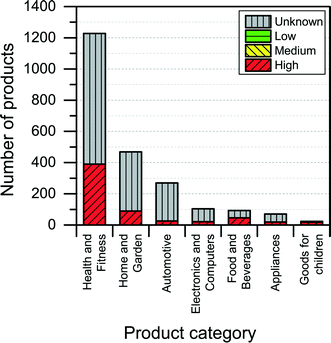 | ||
| Fig. 13 Distribution of NanoRiskCat environmental hazard profiles across different product categories. Red, yellow, green and gray colors indicate high, medium, low and unknown hazard potential. | ||
When it comes to the NanoRiskCat-profile for human health, the subcategories that have most products with a red NanoRiskCat profile are “personal care” (157 products), “sporting goods” (129 products), “cosmetics” (82 products), “clothing” (63 products) and “cleaning” (52 products). For environmental hazards, the subcategories that have most products with a red NanoRiskCat-profile are “personal care” (167 products), “cosmetics” (82 products), “clothing” (67 products) “sporting goods” (67 products), and “cleaning” (59 products). The fact that so many products end up having a red human hazard NanoRiskCat-profile could indicate that the hazard evaluation is biased towards assigning the “high potential” (i.e. the red color) to the products. However, this is not the case, as various nanomaterials are assigned the red color for different reasons as explained by Hansen et al.21 For instance, for nano zinc oxide, the red color is due to properties of the bulk form of the material, whereas titanium dioxide and silica resulted in a red human hazard evaluation because of the acute toxicity of these two specific nanomaterials. Finally, for carbon nanotubes and gold the red hazard profile is due to a combination of toxicity and persistency. As part of the continuing work with The Nanodatabase, the literature of environmental, health and safety impacts of nanomaterials is followed closely, and the hazard evaluations are continuously re-evaluated in light of the published scientific literature as well as independent scientific expert evaluations.
It is, however, important to underline that although a product might be assigned a red human hazard profile, it does not imply that there necessarily is a risk of using the given products. Risk is often said to be a function of exposure and hazard, and if the exposure profile of a given product is green, meaning that there is a low likelihood of exposure for both professional end-users, consumers and the environment, then the overall risk might be low simply due to the fact that there is no exposure. Even if both the evaluation of the exposure potential as well as the hazard evaluation is all red, it does not necessarily mean that there is a risk associated with using the product, as the actual concentrations used in the product might be too low to cause adverse effects when used.
4. Conclusion and outlook
The Nanodatabase provides an initial overview of which kind of nanoproducts are available on the European market by establishing and continuously maintaining an online inventory. The database currently entail 2231 products, and most products are in “personal care” and “clothing” product categories (≥300) followed by “sporting goods” and “cleaning” (>200). Silver and titanium dioxide are the most used NMs, but it is not possible to identify the NMs used for almost 60% of all the products in the database. The data analysis of the registered products in The Nanodatabase furthermore shows that the dominant route of exposure is dermal for most product categories. Interestingly, it seems that if the identity of the nanomaterial used in the product is not reported by the manufacturers, then there also seems to be a high likelihood of human and environmental exposure to that product. Applying the NanoRiskCat-framework for each individual product in The Nanodatabase, the exposure potential, human and environmental hazard potential of most products is either “high” or “unknown”.One of the key limitations of The Nanodatabase and many other inventories that are currently available is that they are based on manufacturer's claim that the product they produce and sell contains nanomaterials or is based on nanotechnology. However, it seems to be the best one can do at this moment in time, where only very few pieces of legislation require mandatory labelling of nanoproducts.9,27 There is no doubt that there has been a lot of hype about “nano” and it can therefore not be ruled out that some manufacturers might make false or exaggerated claims about “nano” in order to advertise and sell their products. Relying of manufacturer's claim about “nano” might on the one hand lead to an overestimation of how many products are actually commercially available to European consumers that contain nanomaterials or are based on nanotechnology. On the other hand it might also lead to an underestimation in the light of the lack of claims and reporting in relation to, for instance, the application of nanomaterials in food. A lot of research is currently underway in order to enable independent identification, determination and verification of nanomaterials in a given material sample or product, but this research is explorative at the moment, limited to a small set of products (e.g. sunscreens) and often requires the use of a multitude of different characterization methods. Hopefully in the near future analytical techniques will be able to provide us with methods to investigate whether the certain substance is in the sample and verify the identity of the nanomaterial used, as well as quantify the content of the substance found in the sample. Ideally, the latter should provide information on nanomaterial content both by mass and number of particles, and specify the physical form and size of the particles present in the product.25
To address the limitations of The Nanodatabase that currently hampers a full overview of what is actually available to European consumers, we recommend that it is made mandatory to disclose and report the use of any nanomaterials in a consumer product and make it illegal to advertise and market the products as “nano” when they do not contain nanomaterials. We also recommend that efforts should be initiated to further promote research and development related to the establishment of a set of methods to determine the presence of nanomaterials in a wide variety of categories of consumer products. Finally, we recommend that comprehensible consumer exposure assessment is preformed and required from manufacturer before the product goes on the market.
Acknowledgements
This work is part of the project ENVNANO (Environmental Effects and Risk Evaluation of Engineered Nanoparticles) supported by the European Research Council (grant no. 281579). This project has furthermore received funding from the European Union's Seventh Framework Programme [FP7/2007-2013] under EC-GA no. 604305 ‘SUN’.References
- Updates. Project of Emerging Nanotechnologies, http://www.nanotechproject.org/cpi/about/updates/ (accessed October 2015)
.
- M. E. Vance, T. Kuiken, E. P. Vejerano, S. P. McGinnis, M. F. Hochella Jr., D. Rejeski and M. S. Hull, Beilstein J. Nanotechnol., 2015, 6, 1769–1780 CrossRef CAS PubMed
.
- Nanoproduktdatenbank, http://www.bund.net/nc/themen_und_projekte/nanotechnologie/nanoproduktdatenbank/produktsuche/ (accessed August 2015)
.
- List of Nanotech, http://www.beuc.eu/publications/2013-00141-01-e.xls (accessed August 2015)
.
- ‘Anomalies’ in notifications behind nanomaterials inventory delay Cosmetics industry confused by different national rules, lack of test methods, https://chemicalwatch.com/23044/anomalies-in-notifications-behind-nanomaterials-inventory-delay?q=nano%2C%20inventory (accessed August 2015)
.
- EU nanomaterials register looks unlikely Not a good way to provide information to consumers, EU Commission says, https://chemicalwatch.com/22241/eu-nanomaterials-register-looks-unlikely?q=nano%2C%20unlikely, (accessed August 2015)
.
-
BIPRO and RPA, Study to Assess the Impact of Possible Legislation to Increase Transparency on Nanomaterials on the Market, DG Enterprise and Industry, European Commission, Brussels, 2014 Search PubMed
.
- The Nanodatabase, http://www.nanodb.dk (accessed October 2015)
.
-
K. Aschberger, H. Rauscher, H. Crutzen, K. Rasmussen, F. M. Christensen, B. Sokull-Klüttgen and H. Stamm, Considerations on information needs for nanomaterials in consumer products, European Commission Joint Research Centre Institute for Health and Consumer Protection, Brussels, 2014 Search PubMed
.
- Consumer Product Inventory. Project of Emerging Nanotechnologies, http://www.nanotechproject.org/cpi/ (accessed August 2015)
.
- S. W. P. Wijnhoven, A. G. Oomen, A. J. A. M. Sips, F. C. Bourgeois, G. J. P. M. te Dorsthorst, M. W. Kooi and M. I. Bakker, Development of an inventory for consumer products containing nanomaterials. Final Report 070307/2010/580587/SER/D3, European Commission, Brussels, 2010 Search PubMed.
- Nanotechnology in Food, http://salsa3.salsalabs.com/o/1881/p/salsa/web/common/public/content?content_item_KEY=14112 (accessed October 2015)
.
- BUND veröffentlicht Datenbank mit über 200 Nano-Produkten, http://www.bund.net/nc/presse/pressemitteilungen/detail/zurueck/pressemitteilungen/artikel/bund-veroeffentlicht-datenbank-mit-ueber-200-nano-produkten/ (accessed October 2015)
.
- Denmark launches consumer product register for nano, https://chemicalwatch-com.globalproxy.cvt.dk/20265/denmark-launches-consumer-product-register-for-nano?q=Belgium%20notifies%20EU%20Commission%20of%20nano%20register%20plan, https://www.retsinformation.dk/Forms/R0710.aspx?id=163367 (accessed October 2015)
.
- Belgium notifies EU Commission of nano register plan, https://chemicalwatch-com.globalproxy.cvt.dk/15632/belgium-notifies-eu-commission-of-nano-register-plan?q=Belgium%20notifies%20EU%20Commission%20of%20nano%20register%20plan (accessed October 2015)
.
- Belgium to implement nanomaterials register in 2016, https://chemicalwatch-com.globalproxy.cvt.dk/15632/belgium-notifies-eu-commission-of-nano-register-plan?q=Belgium%20notifies%20EU%20Commission%20of%20nano%20register%20plan (accessed October 2015)
.
- French nanomaterials register receives 3400 declarations, https://chemicalwatch-com.globalproxy.cvt.dk/17530/french-nanomaterials-register-receives-3400-declarations?q=French%20register (accessed October 2015)
.
- S. F. Hansen, B. H. Larsen, S. I. Olsen and A. Baun, Nanotoxicology, 2007, 1, 243–250 CrossRef CAS
.
- S. F. Hansen, E. Michelson, A. Kamper, P. Borling, F. Stuer-Lauridsen and A. Baun, Ecotoxicology, 2008, 17, 438–447 CrossRef CAS PubMed
.
- L. Heggelund, S. F. Hansen, T. Astrup, A. Boldrin, unpublished work.
- S. F. Hansen, K. A. Jensen and A. Baun, J. Nanopart. Res., 2014, 16(1), 2195, DOI:10.1007/s11051-013-2195-z
.
- Silver. Project of Emerging Nanotechnologies, http://www.nanotechproject.org/cpi/browse/nanomaterials/silver-nanoparticle/ (accessed October 2015)
.
- Silver nanotechnology. A database of silver nanotechnology in Commercial Products. Project of Emerging Nanotechnologies, http://www.nanotechproject.org/inventories/silver/ (accessed October 2015)
.
-
European Commission, COMMISSION STAFF WORKING PAPER Types and uses of nanomaterials, including safety aspects Accompanying the Communication from the Commission to the European Parliament, the Council and the European Economic and Social Committee on the Second Regulatory Review on Nanomaterials SWD (2012) 288 final, 2012, European Commission, Brussels, http://eur-lex.europa.eu/LexUriServ/LexUriServ.do?uri=SWD:2012:0288:FIN:EN:PDF (accessed August 2015)
.
- A. Mackevica and S. F. Hansen, Nanotoxicology, 2016 DOI:10.3109/17435390.2015.1132346
.
- Guidance on information requirements and chemical safety assessment, Chapter R. 15: consumer exposure estimation, http://echa.europa.eu/documents/10162/13632/information_requirements_r15_en.pdf (accessed August 2015)
.
- Legal feasibility study on the introduction of a nanoproduct register. Freiburg, Institute for Applied Ecology, http://www.bmu.de/files/pdfs/allgemein/application/pdf/bericht_nanoproduktregister_en_bf.pdf (accessed October 2015)
.
| This journal is © The Royal Society of Chemistry 2016 |

