High thermoelectric performance of polycrystalline In4Se3−δ(CuI)x: synergistic effects of the Se-deficiency and CuI-doping†‡
Yan-Chun
Chen
,
Hua
Lin
and
Li-Ming
Wu
*
Key Laboratory of Theoretical and Computational Photochemistry, Ministry of Education, College of Chemistry, Beijing Normal University, Beijing 100875, People's Republic of China. E-mail: wlm@bnu.edu.cn
First published on 4th October 2016
Abstract
Polycrystalline n-type In4Se3-based materials are established and promising mid-temperature range thermoelectric materials. Herein, we report that synergistic effects of a Se-deficiency and CuI-doping significantly improve the thermoelectric properties of CuI-doped In4Se3−δ materials via increasing the power factor (PF), an increase of up to 105%, and enhancing the figure-of-merit (ZT), by about 80%, compared to the undoped ones. The CuI-doping (x) significantly lowers the electrical resistivity and enhances the power factor (PF); and the PF increases with increase of x. But the maximum solubility of the CuI-dopant (xm) is restricted by the amount of the Se-deficiency (δ), and it closely approaches the δ in the form of xm < δ. Thus, the greater the δ, the greater the PF. On the other hand, the greater the Se-deficiency, the more Cu that will occupy the intercalation sites, which increases the atom packing density and thus indispensably increases the thermal conductivity (κ); and consequently the lower the δ, the lower the κ. Such a synergistic effect ensures a balance between improving the PF and lowering the κ, so as to give rise to a considerable ZT enhancement. For example, In4Se2.70(CuI)0.2 and In4Se2.50(CuI)0.3 provide a ZTmax of 1.20 and 1.08, respectively, which are about 80 and 66% enhanced in comparison with the un-doped ones. Especially, a ZTmax = 1.34 at 723 K is obtained for In4Se2.95(CuI)0.01, representing the highest value obtained for Pb-free polycrystalline In4Se3-based materials to date. This insight offers guidance for further studies on these and related TE materials.
Introduction
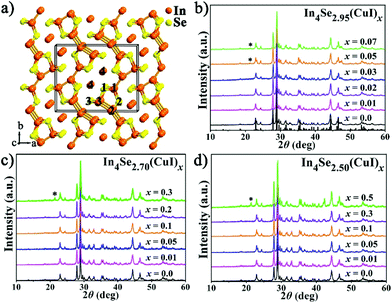
Thermoelectric (TE) materials that are able to directly convert waste heat into electricity are regarded as an alternative source of global sustainable energy because of their excellent advantages as devices, such as no moving parts, a long operating lifetime, reliability and simplicity.1–4 Usually, an outstanding TE material must have a high ZT, which is a dimensionless figure-of-merit ZT = S2σT/κ, where S, σ, T, and κ are the Seebeck coefficient, electrical conductivity, absolute temperature and thermal conductivity (including lattice thermal conductivity and electrical thermal conductivity), respectively. However, achieving an appropriate balance between the three parameters of S, σ, and κ is the most inevitable obstacle in increasing the ZT value.5–7In4Se3−δ crystals (with a Se-deficiency, δ) represent a noteworthy class of n-type mid-temperature (500–900 K) TE materials showing an intrinsically low and strongly anisotropic thermal conductivity, and remarkable ZT values of 1.48 at 705 K or 1.53 at 698 K for the bc plane of single crystals of In4Se2.35 (δ = 0.65)8 or In4Se2.67Cl0.03 (δ = 0.33).9 As shown in Fig. 1a, the In4Se3 single crystal features [In3Se3]− corrugated layers that are interconnected by In+ ions (In4) via ionic bonds and each layer consists of (In3)5+ multivalent clusters (In1–3) covalently bonded to Se ions (Se1–3).10,11 Due to the quantum confinement effect and quasi one-dimensional lattice distortion (Periels distortion), the single crystal has an intrinsically low lattice thermal conductivity and a high Seebeck coefficient (S).8 Nevertheless, the strongly anisotropic thermal conductivity8,12 and the cleavage habit of the single crystals are drawbacks for practical application. Thus, research on the polycrystalline In4Se3-based materials is of great importance. The usual approach to improve TE properties is to increase the power factor (PF = S2σ) and reduce the thermal conductivity (κ).
Recently, Luo et al. reported ZT values of 1.1 at 723 K and 1.3 at 723 K for CuBr2 doped13 or Cu/I2-codoped14 polycrystalline In4Se2.50 materials. The Cu prefers to occupy intercalation positions as a donor.13 Besides, studies have demonstrated that electron doping using a halogen that has one additional p electron in comparison with the selenium can enhance the TE properties of In4Se3−δ materials.13–16 Inspired by these studies, it is likely that the TE properties of such materials will be further enhanced by copper halide doping. Furthermore, the self-doping effect of a Se-deficiency is not only beneficial for optimizing the electrical transport behavior,17,18 but is also critical in reducing the thermal conductivity.17–19 However, the complexity and possible synergistic effects of a Se-deficiency and copper halide doping remain unclear.
Herein, we have systematically investigated the synergistic effects of a Se-deficiency and CuI-doping on the electrical and thermal transport properties of polycrystalline In4Se3−δ(CuI)x samples (δ = 0.05, 0.3 and 0.5). Such combinations significantly enhance the ZT by about 68%, 80% and 66% in comparison with the un-doped ones for In4Se2.95(CuI)0.01, In4Se2.70(CuI)0.2 and In4Se2.50(CuI)0.3 at 723 K, respectively. The enhancement originates from the significantly increased PF and the relatively low κ. A maximum ZT value of 1.34 at 723 K is obtained with In4Se2.95(CuI)0.01, the highest value obtained for Pb-free polycrystalline In4Se3-based materials to date.
Experimental
Synthesis
Polycrystalline CuI-doped In4Se3−δ(CuI)x (δ = 0.05, 0.3, 0.5) samples were prepared using solid-state methods and a hot-pressing technique. For each Se-deficiency, the CuI doping concentration was varied: the sample compositions were In4Se2.95(CuI)x (x = 0.0, 0.01, 0.02, 0.03, 0.05 and 0.07), In4Se2.70(CuI)x (x = 0.0, 0.01, 0.05, 0.1, 0.2 and 0.3) and In4Se2.50(CuI)x (x = 0.0, 0.01, 0.05, 0.1, 0.3 and 0.5). In a typical reaction, the required amounts of In (granular, 99.995%), Se (granular, 99.999%) and CuI (powder, 99.95%) were weighed and mixed in a silica tube in an Ar-filled glove box. Then the silica tube was flame sealed under high vacuum and heated at 1173 K for 1 day, followed by water quenching. The melted ingot was annealed at 743 K for 5 days, then ground into a fine powder and subsequently sintered by hot-pressing under a uniaxial pressure of 57 MPa at 793 K for 50 min under vacuum. The measured relative density for all the samples was usually higher than 98% of the theoretical one.Characterization and measurements
The powder X-ray diffraction (PXRD) data were collected using a MiniFlex II powder diffractometer with Cu Kα radiation in a 2θ range from 10 to 60° with a step size of 0.02°. The electrical resistivity (ρ) and Seebeck coefficient (S) were measured simultaneously from room temperature to 723 K under an argon atmosphere using a standard four-probe method with the aid of a ULVAC-RIKO ZEM-3 instrument system. The total thermal conductivity (κtot) was calculated using κtot = αCpd, where α, Cp and d are the thermal diffusivity, specific heat and density, respectively. The thermal diffusivity was measured using a laser flash method (LFA-457, NETZSCH, Germany) under an argon atmosphere in the range of 300–723 K. The specific heat was directly derived from the Dulong–Petit value at high temperatures (T ≥ 300 K).8,9,20–23 The measured density was determined using the dimensions and mass of the sample, and then reconfirmed from measurements using the Archimedes’ principle with a home-built device. The measurements of the thermal and electrical transport properties were performed for the directions perpendicular to the pressing direction, and there was no obvious preferential orientation as demonstrated in Fig. S1.‡ The Hall coefficient RH (RH = ρxy/H) and Hall resistivity (ρxy) were measured with the aid of a K2500-5RSLP Variable Temperature Hall Measurement System with a magnetic flux density up to ±1.3 T. The carrier concentration was calculated based on RH, using nH = −1/RHe. The Hall mobility was then calculated from the Hall coefficient and electrical resistivity with μH = RH/ρxy. The combined measurement uncertainty for the thermoelectric figure of merit was generally assumed to be ∼15%.Results and discussion
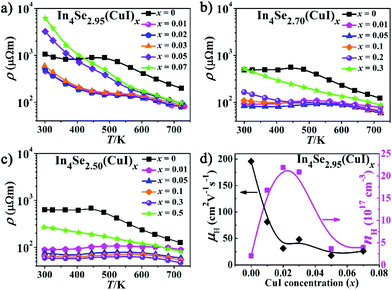
Fig. 1b–d show PXRD patterns for the three series of polycrystalline In4Se3−δ(CuI)x (δ = 0.05, 0.3 and 0.5) samples, which were well indexed as Pnnm In4Se3 (PDF-83-0039). A detectable impurity of InSe (PDF-34-1431) was found when x ≥ δ, indicating that the maximum solubility of CuI (xm) in the In4Se3−δ(CuI)x materials is limited by δ. Within the detection limit of the PXRD technique, no impurity peaks for Cu or I were detected, but with the aid of EDS, Cu and I elements were found, especially in the high CuI concentration doped In4Se2.50(CuI)0.5 sample. The copper may prefer to occupy intercalation sites due to energy reasons,13 and the iodine may occupy either Se vacancy or Se lattice sites.16 These results provide some new insight, as follows: (1) the upward solubility limit for the CuI-doping is directly related to the amount of Se-deficiency (δ). For instance, when the δ increases from 0.05 to 0.5, the upward limit of xm increases from 0.03 to 0.3. (2) The upward solubility limit xm is defined by xm < δ, which means the greater the Se-deficiency, the more CuI that can be doped in. Such a rule offers useful guidance for future designed syntheses and preparations of In4Se3-based materials.The temperature dependent electrical resistivity ρ(T) of the three series of CuI-doped samples of In4Se3−δ(CuI)x (δ = 0.05, 0.3 and 0.5) is shown in Fig. 2a–c. These data reveal that there exists an optimal concentration range of CuI dopant for samples with a certain Se-deficiency. Taking In4Se2.5(CuI)x as an example (Fig. 2c), when x < δ, the ρ decreases with increase of x; when x ≥ δ, the ρ increases because of the occurrence of the InSe impurity. Fig. 2 also shows that the higher the δ is, the lower the ρ that can be reached. Consistently, a higher power factor (PF) will be realized for samples with a higher δ. Such an inverse correlation of ρ(T) and δ reveals the synergistic effects of the Se-deficiency and CuI-doping on the electrical transport properties. When x < δ, all the ρ(T) curves reflect a semiconductor to metal transition. The saturation point of ρ(T) around 550 K means that the intrinsic excitation begins to take effect at this temperature,14,18 subsequently, the ρ decreases with further increase of the temperature and reaches even lower values at elevated temperatures. Such a reduction of the ρ(T) also explains the reduction in the absolute S with increasing δ, as displayed in Fig. 3a–c. The carrier concentration nH(x) and Hall mobility μH(x) correlations were measured for the In4Se2.95(CuI)x (x = 0.0–0.07) samples at 300 K (Fig. 2d). The electrical conductivity can be expressed as σ = 1/ρ = μne, where n is the carrier concentration and μ is the carrier mobility.2Fig. 2d shows that the significant decrease in ρ(T) for x = 0.01–0.03 is mainly due to a sharp increase of nH, not of μH. Instead, the μH drops rapidly. Note that when x ≥ 0.05, the μH slightly declines with increase of x; whereas the nH reduces sharply, under which conditions the InSe impurity occurs and decreases the electrical conductivity, similar to results reported for In4Pb0.01Sn0.03Se2.9Clx (x = 0–0.06)24 and In4Se2.7Clx (x = 0–0.05) samples.15 The behaviour of nH is related to knowledge that Cl and I atoms located in Se vacancy sites show hole character, while they show electron character when they occupy sites at the Se sublattice.16 In addition, the μH values of In4Se2.95(CuI)x decrease with increasing CuI doping concentrations (Fig. 2d), which indicates an enhancement of the scattering of charge carriers. In short, the electrical transport behavior of the Se-deficient In4Se3−δ materials can be optimized through CuI-doping within a suitable concentration range (x < δ), through which the carrier concentration is sharply increased, whereas the carrier mobility is decreased.
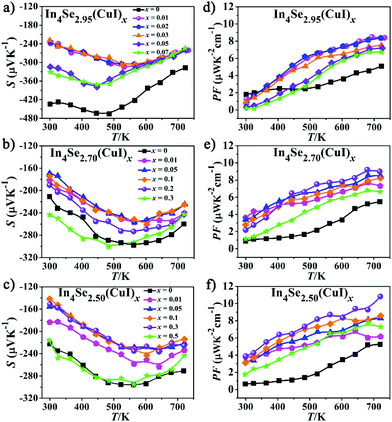 | ||
| Fig. 3 (a–c) Temperature dependence of the Seebeck coefficient (S); (d–f) temperature dependence of the power factor (PF = S2σ) for the In4Se3−δ(CuI)x samples. | ||
Fig. 3a–c represent the temperature-dependence of S(T) for all the samples. The negative values of S verify them as n-type TE materials. The absolute values of S (|S|) for all the doped samples are lower than that of the un-doped ones and tend to converge at high temperature. Such a variation for S(T)–x is consistent with those of ρ(T). Similar to previous studies,13,18,25 there exists a peak in the S(T) curve, which is related to electron–hole bipolar transport. The final S value, including positive and negative charge carriers, can be expressed as a conductivity weighted average:26,27
 | (1) |
For an n-type TE material, at low temperature, the S value mainly stems from the electron conductivity (σn); however, at higher temperatures, an exponential increase in the minority carrier conductivity (σp) induces a decrease of |S|. As a consequence, the peak for |S| was generated. In the bipolar region, the semiconductor band gap values can be estimated roughly using the relationship developed by Goldsmid and Sharp:27Eg = 2e|S|maxTmax, where |S|max and Tmax are the maximum |S| and the temperature at which the |S|max occurs. The Eg values for the CuI-doped In4Se3−δ (δ = 0.05, 0.3, and 0.5) samples are about 0.33, 0.29 and 0.29 eV, respectively, while those for the corresponding un-doped ones are about 0.43, 0.33 and 0.34 eV. Such a band gap decrease should result from a band structure change caused by the synergistic effects of both the CuI-doping and the Se-deficiency. This is contrary to that found for CuBr-doped In4Se2.5,13 possibly because the band gap of CuI is usually smaller than that of CuBr. As a result, a large enhancement of the PF for all the CuI-doped samples is achieved, owing to the relatively high |S| and low ρ (Fig. 3d–f). For example, the samples of In4Se2.95(CuI)x, In4Se2.70(CuI)x and In4Se2.50(CuI)x realize a maximum PF at 723 K of 8.4, 9.05, and 10.84 μW K−2 cm−1, respectively, which is enhanced about 64, 65 and 105% in comparison with those of the un-doped ones. Fig. 4a–c show the temperature-dependence of the total thermal conductivity κtot(T) for all the samples. It is clear that those samples with a higher Se-deficiency show a larger κtot. From 300 to 723 K, for δ values of 0.05, 0.3 and 0.5, the κtot decreases from 0.95–0.90 to 0.45 W m−1 K−1, from 1.25–1.06 to 0.66–0.51 W m−1 K−1 and from 1.43–1.12 to 0.72–0.60 W m−1 K−1, respectively. For the samples with a higher Se-deficiency, e.g., δ = 0.5, the increase of κtot with the increase of x (0.01–0.3) is similar to results with CuBr- or CuBr2-doped In4Se2.50 samples13 (Fig. 4c). On the contrary, the samples with a lower Se-deficiency, such as δ = 0.05, do not show a significant increase in the κtot (Fig. 4a). The electrical thermal conductivity (κe) was calculated according to the Wiedemann–Franz relationship κe = LTσ, where the Lorenz number L = 2.45 × 10⁻⁸ W Ω K−2.13,16 The κe was calculated using the calculated L value and measured σ. Then, on subtracting the κe from κtot, the κlat was obtained. As shown in Fig. 4d–f, the κe for all the samples increased with the increasing temperature, and at 723 K, the κe values for the three series of CuI-doped In4Se3−δ samples (δ = 0.05, 0.3 and 0.5) were 0.18–0.22 W m−1 K−1, 0.20–0.30 W m−1 K−1 and 0.20–0.38 W m−1 K−1, respectively. These samples simultaneously display a κe increase and a PF enhancement, especially for the heavily doped ones. Besides, the κlat decreases monotonously within the measured temperature range, indicating typical crystalline heat transport behavior. Particularly, such a conventional 1/T behavior indicates the dominance of phonon–phonon Umklapp scattering in the phonon transport. Meanwhile, the κlat values of all these doped samples at high temperature are lower than or similar to those of the un-doped ones. For example, at 723 K, the κlat falls within a range of 0.24–0.28 W m−1 K−1 for In4Se2.95(CuI)x, 0.27–0.44 W m−1 K−1 for In4Se2.70(CuI)x, and 0.36–0.45 W m−1 K−1 for In4Se2.50(CuI)x. Obviously, the In4Se2.95(CuI)x samples with the lowest Se-deficiency exhibit the lowest κlat values, as the greater the Se-deficiency, the more Cu that occupies the intercalation sites, which increases the atom packing density and thus is beneficial for thermal conductivity.
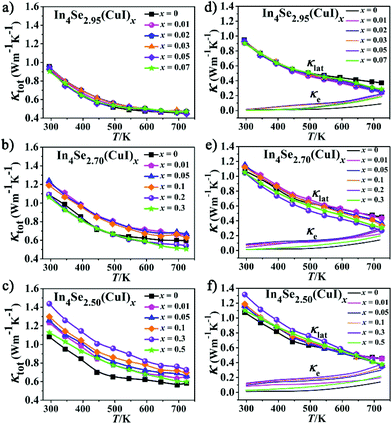 | ||
| Fig. 4 The (a–c) total thermal conductivity (κtot), (d–f) lattice thermal conductivity (κlat) and electrical thermal conductivity (κe) of the In4Se3−δ(CuI)x samples. | ||
As is manifested in Fig. 5, the ZT values increase with increasing temperature for all the samples. It also reveals that there is an optimal concentration (x) for the CuI-doping, which is x = 0.01 when δ = 0.05 (Fig. 5a); x = 0.2 when δ = 0.3; and x = 0.3 when δ = 0.5. The highest ZT value of 1.34 at 723 K for the In4Se2.95(CuI)0.01 sample shows an enhancement of ∼68% over the un-doped In4Se2.95, for which ZT = 0.8 at 723 K. For the other two series with a higher Se-deficiency, In4Se2.70(CuI)0.2 and In4Se2.50(CuI)0.3 realize maximum ZT values of 1.20 and 1.08 at 723 K, respectively, which are about 80 and 66% enhanced compared to the un-doped ones. The ZT enhancement mostly arises from the remarkable PF increase. The CuI-doping improves the PF by optimizing the electrical transport behavior, meanwhile the κtot also increases mainly because of the increase in the κe, especially for samples with a high Se-deficiency. These effects together demonstrate the cooperative relationship between the S, σ and κtot parameters. The highest ZT value was obtained with the In4Se2.95(CuI)0.01 sample, which suggests that in order to improve the TE performance of In4Se3-based materials, one needs to consider simultaneously the CuI-doping and the Se-deficiency amounts, which synergistically regulate the electrical and thermal transport behavior.
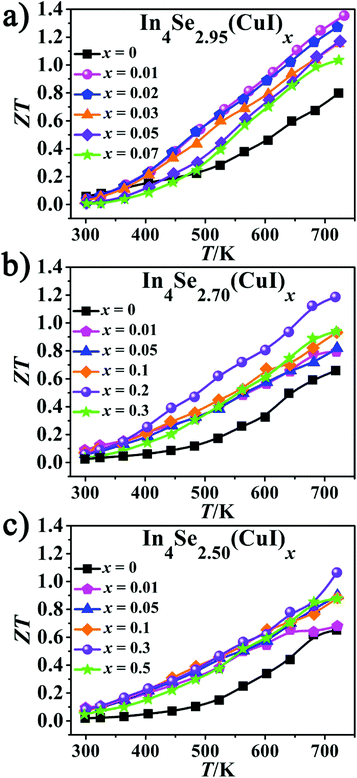 | ||
| Fig. 5 (a–c) The temperature-dependent dimensionless figure-of-merit ZT of In4Se2.95(CuI)x, In4Se2.70(CuI)x and In4Se2.50(CuI)x. | ||
Conclusions
In summary, systematic investigations of polycrystalline In4Se3−δ (δ = 0.05, 0.3 and 0.5) materials have demonstrated that the synergistic effects of the Se-deficiency and CuI-doping significantly enhance the thermoelectric properties by greatly increasing the power factor (PF) and the figure of merit (ZT). The CuI-doping (x) enhances the PF via optimization of the electrical transport behavior, owing to the fact that both Cu and I act as donors that mainly increase the carrier concentration and suppress the mobility; the higher x is, the larger the PF. However, the maximum solubility of the CuI-dopant (xm) is restricted by the Se-deficiency amount (δ) and closely approaches the δ in the form of xm < δ. Thus, the greater the δ, the greater the PF. On the other hand, the greater the Se-deficiency, the more Cu that will occupy the intercalation sites, which increases the atom packing density and thus indispensably increases the thermal conductivity (κ); and consequently, the lower the Se-deficiency (δ), the lower the κ. Taking all this into consideration, a remarkable ZT enhancement can only be achieved via an appropriate balance between the PF and κ, which means a high TE performance for the In4Se3-based materials should be sought in systems with a low Se-deficiency (low δ), for which the electrical transport properties should be further optimized by CuI doping (x) with an appropriate concentration defined by xm < δ. Such a synergy leads to the best TE performance with ZT = 1.34 for the In4Se2.95(CuI)0.01 sample, which represents a 68% enhancement over the un-doped material and the highest value obtained for any Pb-free polycrystalline In4Se3-based materials to date. This insight is useful for future studies on these and related promising TE materials.Acknowledgements
This research was supported by the National Natural Science Foundation of China (under projects 91422303, 21225104, 21571020, 21233009, and 21301175).References
- M. H. Elsheikh, D. A. Shnawah, M. F. M. Sabri, S. B. M. Said, M. H. Hassan, M. B. A. Bashir and M. Mohamad, Renewable Sustainable Energy Rev., 2014, 30, 337–355 CrossRef.
- G. J. Snyder and E. S. Toberer, Nat. Mater., 2008, 7, 105–114 CrossRef CAS PubMed.
- B. C. Sales, Smaller is cooler, Science, 2002, 295, 1248–1249 CrossRef CAS PubMed.
- F. J. DiSalvo, Science, 1999, 285, 703–706 CrossRef CAS PubMed.
- C. Xiao, Z. Li, K. Li, P. C. Huang and Y. Xie, Acc. Chem. Res., 2014, 47, 1287–1295 CrossRef CAS PubMed.
- H. Alam and S. Ramakrishna, Nano Energy, 2013, 2, 190–212 CrossRef CAS.
- W. S. Liu, X. Yan, G. Chen and Z. F. Ren, Nano Energy, 2012, 1, 42–56 CrossRef CAS.
- J. S. Rhyee, K. H. Lee, S. M. Lee, E. Cho, S. I. Kim, E. Lee, Y. S. Kwon, J. H. Shim and G. Kotliar, Nature, 2009, 459, 965–968 CrossRef CAS PubMed.
- J. S. Rhyee, K. Ahn, K. H. Lee, H. S. Ji and J. H. Shim, Adv. Mater., 2011, 23, 2191–2194 CrossRef CAS PubMed.
- Y. B. Losovyj, L. Makinistian, E. A. Albanesi, A. G. Petukhov, J. Liu, P. Galiy, O. R. Dveriy and P. A. Dowben, J. Appl. Phys., 2008, 104, 083713 CrossRef.
- J. H. C. Hogg, H. H. Sutherland and D. J. Williams, J. Chem. Soc. D, 1971, 1568–1569 RSC.
- Y. B. Zhai, Q. S. Zhang, J. Jiang, T. Zhang, Y. K. Xiao, S. G. Yang and G. J. Xu, J. Mater. Chem. A, 2013, 1, 8844–8847 CAS.
- Y. B. Luo, J. Y. Yang, G. Li, M. Liu, Y. Xiao, L. W. Fu, W. X. Li, P. W. Zhu, J. Y. Peng, S. Gao and J. Q. Zhang, Adv. Energy Mater., 2014, 4, 1300599 CrossRef.
- Y. B. Luo, J. Y. Yang, M. Liu, Y. Xiao, L. W. Fu, W. X. Li, D. Zhang, M. Y. Zhang and Y. D. Cheng, J. Mater. Chem. A, 2015, 3, 1251–1257 CAS.
- J. S. Rhyee and D. Choi, J. Appl. Phys., 2011, 110, 083706 CrossRef.
- K. Ahn, E. Cho, J. S. Rhyee, S. I. Kim, S. Hwang, H. S. Kim, S. M. Lee and K. H. Lee, J. Mater. Chem., 2012, 22, 5730–5736 RSC.
- G. H. Zhu, Y. C. Lan, H. Wang, G. Joshi, Q. Chen and Z. F. Ren, Phys. Rev. B: Condens. Matter, 2011, 83, 115201 CrossRef.
- J. S. Rhyee, E. Cho, K. H. Lee, S. M. Lee, S. I. Kim, H. S. Kim, Y. S. Kwon and S. J. Kim, Appl. Phys. Lett., 2009, 95, 212106 CrossRef.
- H. S. Ji, H. Kim, C. Lee, J. S. Rhyee, M. H. Kim, M. Kaviany and J. H. Shim, Phys. Rev. B: Condens. Matter, 2013, 87, 125111 CrossRef.
- K. A. Borup, J. de Boor, H. Wang, F. Drymiotis, F. Gascoin, X. Shi, L. D. Chen, M. I. Fedorov, E. Muller, B. B. Iversen and G. J. Snyder, Energy Environ. Sci., 2015, 8, 423–435 CAS.
- Y. L. Li, T. S. Zhang, Y. T. Qin, T. Day, G. J. Snyder, X. Shi and L. D. Chen, J. Appl. Phys., 2014, 116, 203705 CrossRef.
- S. I. Johnson, A. Zevalkink and G. J. Snyder, J. Mater. Chem. A, 2013, 1, 4244–4249 CAS.
- H. J. Wu, S. W. Chen, T. Ikeda and G. J. Snyder, Acta Mater., 2012, 60, 6144–6151 CrossRef CAS.
- J. H. Kim, M. J. Kim, S. Oh, J. S. Rhyee, S. D. Park and D. Ahn, Dalton Trans., 2015, 44, 3185–3189 RSC.
- Z. S. Lin, L. Chen, L. M. Wang, J. T. Zhao and L. M. Wu, Adv. Mater., 2013, 25, 4800–4806 CrossRef CAS PubMed.
- Z. M. Gibbs, H. S. Kim, H. Wang and G. J. Snyder, Appl. Phys. Lett., 2015, 106, 022112 CrossRef.
- H. J. Goldsmid and J. W. Sharp, J. Electron. Mater., 1999, 28, 869–872 CrossRef CAS.
Footnotes |
| † Dedicated to Professor Mercouri G. Kanatzidis on the occasion of his 60th birthday. |
| ‡ Electronic supplementary information (ESI) available. See DOI: 10.1039/c6qi00340k |
| This journal is © the Partner Organisations 2016 |

