Green synthesis of carbon quantum dots from lemon peel waste: applications in sensing and photocatalysis†
Ankit Tyagi‡
a,
Kumud Malika Tripathi‡a,
Narendra Singhab,
Shashank Choudharya and
Raju Kumar Gupta*ab
aDepartment of Chemical Engineering, Indian Institute of Technology Kanpur, Kanpur-208016, UP, India. E-mail: guptark@iitk.ac.in; Fax: +91-5122590104; Tel: +91-5122596972
bCenter for Nanosciences and Center for Environmental Science and Engineering, Indian Institute of Technology Kanpur, Kanpur-208016, UP, India
First published on 25th July 2016
Abstract
In this work, water soluble carbon quantum dots (wsCQDs) were synthesized from lemon peel waste using a facile and cost effective hydrothermal process. As synthesized wsCQDs were 1–3 nm in size with spherical morphology and oxygen rich surface functionalities. These wsCQDs manifest excellent photoluminescence (PL) properties and exhibited quantum yield (QY) ∼14% with high aqueous stability. wsCQDs were further used to design an economic, green and highly sensitive fluorescent probe for the detection of Cr6+ ions with a detection limit of ∼73 nM. This wsCQDs based fluorescent probe could provide a simple, rapid, convenient technique for the sensitive and selective detection of Cr6+ in water purification processes. Further, wsCQDs were immobilized over electrospun TiO2 nanofibers and the photocatalytic activity for such a TiO2–wsCQDs composite was demonstrated using methylene blue (MB) dye as a model pollutant. Photocatalytic activity for the TiO2–wsCQDs composite was found to be ∼2.5 times more than that of TiO2 nanofibers. The synthesis method for wsCQDs could be easily scaled up for gram scale synthesis of carbon quantum dots.
1. Introduction
Chromium contamination brought about by various industrial revolutions such as electroplating, textile dyeing, leather tanning, mining, and wood preserving has been accompanied by significant environmental deterioration.1,2 In contrast to other valence states of chromium, Cr6+ is highly toxic and carcinogenic in nature due to its higher oxidation potential, smaller size and greater mobility.2 In addition, it has the ability to produce reactive oxygen species and ultimately results in the generation of other highly toxic (especially genotoxic) byproducts.3–5 Therefore, its concentration is strictly restricted in drinking water even at a trace level.6 Consequently, sensitive and selective detection of Cr6+ in aqueous systems is crucial for both human health concerns and an ecological point of view.7,8 Significant efforts have been made to develop various techniques for the selective determination of Cr6+ ions, such as, inductively coupled plasma-mass spectroscopy (ICPMS),9 surface enhanced Raman scattering (SERS),10 X-ray absorption spectroscopy,11 atomic absorption spectrometry (AAS),12 electroanalytical,8 and colorimetric detection.13 Although, most of the analytical methods required extra processing in terms of surface modification, sample preparation and are coupled with sophisticated instruments. Recently, carbon nano particles based fluorescent sensors have opened up a new avenue for the detection of heavy metal ions posing environmental and health risks.14 Fluorescence based sensors offer a noninvasive detection technique in homogenous medium, high sensitivity, simplicity and rapid detection.Carbon quantum dots (CQDs)15 have received much attention in recent past decades, due to their unique physical, chemical, optical and surface properties.16 Carbon dots are recognized as paracrystalline carbon, having angstrom size polyaromatic carbon core shell, surrounded by amorphous carbon domains. However, their defined structure is still a matter of debate.17 Instead of other nano sized allotropes of paracrystalline carbons, carbon dots exhibited excellent biocompatibility, photostability and innocuousness properties.18 As a consequences of their fascinating virtues, carbon quantum dots (CQDs) have found promising potential for a wide range of applications from environmental,19,20 water purification,21,22 biomedical23–25 to energy storage devices26–29 along with many more future applications.30–33 Their characteristics of multicolor tunable emission properties throughout the visible and NIR region34 are highly desirable for biomedical applications such as bio-imaging,35,36 bio-sensing,21,37 cell labeling,38 photodynamic therapy39 and drug delivery.40,41
Since first report of arc-discharge synthesis of photoluminescent carbon dots (CDs),42 a number of effective synthetic approaches are in practice for the easy fabrication of CDs.6,43,44 In past few years, waste materials especially bio-wastes have been turned into the most fascinating carbon sources for CDs synthesis. Since, bio-wastes offer economic nature and added advantage of green synthesis. For instances, Sun and co-workers adopted hydrothermal technique for CDs synthesis with 1–4 nm in diameter by using low-cost waste, willow bark.45 Dubey et al. reported the synthesis of wsCQDs by using soya nuggets as a carbon source.43 Wang et al. adopted microwave assisted technique for the synthesis of fluorescent CDs with egg shell membrane and further utilized them for the detection of copper ions.46 Most of the approaches for green synthesis of wsCQDs either involved hydrothermal technique or microwave assisted synthesis due to fabrication ease and faster synthesis processes. The use of lemon as energy source and refreshing agent brings nutrition and refreshment but simultaneously lead to increase of enormous bio-waste. Discarded lemon peels waste is generally left for biodegradation and ultimately end up to air/dust pollution. Second life usage of lemon peels into value added products via cost effective approaches, still needs serious concern. In an attempt to manage lemon peel wastes in a more convenient way, we used lemon peel as carbon source for the synthesis of wsCQDs via hydrothermal technique.
Furthermore, characteristic electron transfer properties of CQDs were explored for the photocatalytic removal of organic pollutant. Sustainable removal of non-biodegradable organic pollutants from contaminated waste water is crucial to protect human health and aquatic life.47 Among all available methods, photocatalytic degradation of organic dyes into environmental benign products has emerged as an effective way to remove organic contaminates from waste water using TiO2.48 TiO2 has been used as photocatalyst over 40 years, due to its economic nature, chemical inertness and resistant to corrosion. However, its UV range activity due to wide band gap (energy band gap ∼ 3.0–3.2 eV) semiconductor and recombination of excitons (electron and hole pair) are some of the major drawbacks that still needs to be addressed.49–51 Exploiting the improved photocatalytic activity of TiO2 composites, various photocatalysts have been developed. Hetero-structures of TiO2 with CDs are found to improve its charge separation along with transportation and ultimately lead to enhanced photocatalytic activity. Prasannan et al. fabricated ZnO–CDs composites through hydrothermal route and reported the superior photocatalytic activity of ZnO–CDs composite due to suppressed charge recombination.52 Yu et al. reported the fabrication of TiO2(P25)–CDs composite with enhanced photocatalytic H2 evolution.28 Li et al. synthesized TiO2–CDs composites and showed that nanocomposites exhibited improved photocatalytic activity than pure TiO2 under UV light irradiation because of electron transfer process between CDs and TiO2.53
Herein, wsCQDs were synthesized via a green and economic hydrothermal route utilizing lemon peel as carbon source, generally discarded as waste. Synthesized wsCQDs possessed high photostability with ∼9% of QY even after one year of storage as compared to ∼14% of QY for fresh sample. wsCQDs has been successfully applied for the simple, sensitive and selective detection of Cr6+ based upon fluorescent “turn off” technique. Further, composites of wsCQDs and TiO2 nanofibers were developed at room temperature using 6-aminohexanoic acid as linker molecule. Photocatalytic activity of TiO2–wsCQDs composites was explored for the degradation of model pollutant methylene blue (MB) dye and found ∼2.5 times higher than that of TiO2 nanofibers.
2. Experimental section
2.1. Materials
Waste lemon peels were collected in-house at IIT Kanpur and washed several times with water before use. Titanium isopropoxide (TIP, 97%), methylene blue, 6-aminohexanoic acid, sodium hypo chloride and other inorganic salts used in this study were purchased from Sigma Aldrich, India and used as received without any further purification. Polyvinylpyrrolidone (PVP, MW = 1![[thin space (1/6-em)]](https://www.rsc.org/images/entities/char_2009.gif) 300
300![[thin space (1/6-em)]](https://www.rsc.org/images/entities/char_2009.gif) 000) was purchased from Alfa Aesar and used as received. Ethanol, dichloromethane, acetic acid and quinine sulphate were purchased from Merck. Cr6+ solution was prepared from K2Cr2O7. The solutions of other metal ions used in this study were prepared from their respective nitrate or acetate salts. The instrumentation details are discussed in ESI.†
000) was purchased from Alfa Aesar and used as received. Ethanol, dichloromethane, acetic acid and quinine sulphate were purchased from Merck. Cr6+ solution was prepared from K2Cr2O7. The solutions of other metal ions used in this study were prepared from their respective nitrate or acetate salts. The instrumentation details are discussed in ESI.†
2.2. Synthesis of carbon quantum dots from lemon peel
Carbon dots were synthesized through greener synthetic route. Initially, 5 g lemon peels were washed with water and dried initially in sunlight and then in oven at 100 °C for 10 h. The dried lemon peels were crushed and put in 100 mL solution of 0.1 M H2SO4. After 5 min, lemon peels were washed with plenty of water for several times, followed by filtration and then drying in oven at 100 °C for 4 h. The sample was mixed with 150 mL of sodium hypo chloride solution and kept for 4 h. Further, the sample was washed with water for several times until pH ∼ 7. Then, lemon peels sample under went through hydrothermal in a Teflon lined autoclave and kept at 200 °C for 12 h. Autoclave was allowed to cool down at room temperature naturally, then sample was collected and washed with dichloromethane to remove the unreacted organic moieties. The resulted aqueous solution was centrifuged at 10![[thin space (1/6-em)]](https://www.rsc.org/images/entities/char_2009.gif) 000 rpm for 30 min to separate solvent from the wsCQDs and finally dried at 100 °C.
000 rpm for 30 min to separate solvent from the wsCQDs and finally dried at 100 °C.
2.3. Synthesis of TiO2 nanofibers and carbon quantum dots composite
TiO2 nanofibers were fabricated by electrospinning technique using TIP as titania precursor according to earlier reported protocols.54 In brief, 0.45 g of PVP was dissolved in 7.5 mL ethanol at 55 °C and stirred continuously for 30 min. 1.5 g TIP was mixed in mixture of 3 mL ethanol and 3 mL acetic acid at room temperature under continuous stirring for 30 min. After that TIP solution was poured in PVP solution and continuously stirred for another 8 h to get homogeneous mixture. TIP/PVP solution was then loaded to the 10 mL plastic syringe. Solution was pushed at 20 μL min−1 through the syringe pump and nanofiber mat was collected on aluminum foil wrapped over rotary drum. Distance and voltage applied between syringe needle and collector was 10 cm and 12 kV, respectively. Nanofibers matrix over aluminum foil was then placed in oven at 60 °C for 1 h to collect free standing mat. Free standing mat was calcined in muffle furnace at 500 °C for 2 h. Calcined TiO2 nanofibers mat was further functionalized with wsCQDs.50 mg of as fabricated TiO2 nanofibers mat was dispersed in 50 mL DI water. Further, 246 mg of 6-aminohexanoic acid was added to it and continuously stirred for 6 h at room temperature. After functionalization, TiO2 nanofibers were washed with water via centrifugation (5000 rpm for three times) to remove excess 6-aminohexanoic acid. After that, functionalized nanofibers were mixed with 10 mL aqueous solution of wsCQDs (1 mg mL−1) and again continuously stirred for 6 h at room temperature. Finally, TiO2–wsCQDs composite was collected through centrifugation process.
2.4. Fluorescence detection of Cr6+
Cr6+ detection was performed at room temperature in aqueous solution. 10 μL solution of different metal ions (1 × 10⁻³ M) were mixed in 2 mL aqueous solution of wsCQDs (125 μg mL−1). The solutions were mixed thoroughly, left for 1 min and then fluorescence spectra were recorded immediately. The fluorescence emission intensities for all the metal detection experiments were recorded at 360 nm excitation wavelength. Excitation, emission slits (5 nm) and all other experimental parameters were kept constant throughout the experiment. Experiments for sensitivity and selectivity of Cr6+ were repeated for three times.2.5. Photocatalytic experiment
TiO2–wsCQDs composite (10 mg) was dispersed in 20 mL MB solution (20 μM) and stirred for 2 h to get adsorption–desorption equilibrium. The equilibrated solution was then exposed under UV light (12 W), aliquots were collected at different time interval and centrifuged before analysis to remove composite. Absorption spectra of MB aliquots were recorded with UV-vis spectrophotometer. The kinetic rate constant of MB degradation in the presence of photocatalyst was calculated using Langmuir–Hinshelwood model as given below:55where Kapp is apparent kinetic rate constant, Co is initial concentration of MB dye and C is concentration of MB at irradiance time t.
3. Results and discussion
wsCQDs were synthesized by the carbonization of lemon peels via facile and cost effective hydrothermal process. Hydrothermal carbonization has been turned into a popular approach for the green synthesis of carbon nano particles from organic precursor. Hydrothermal carbonization converts organic mass into CDs and also, imparts surface functionalization resulting them to be water soluble and photoluminescent.56 The synthetic process of wsCQDs is shown in Scheme 1. However, the exact mechanism for the synthesis of wsCQDs from organic mass is still unclear. The possible mechanism for the conversion of carbonaceous organic materials of lemon peels to wsCQDs involves a number of processes such as dehydration, fragmentation, condensation, aromatization and carbonization.57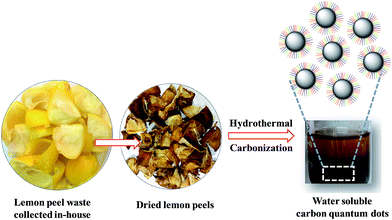 | ||
| Scheme 1 Schematic illustration for the synthetic procedure of wsCQDs by hydrothermal treatment of lemon peel waste precursor. | ||
3.1. Microscopic and spectroscopic characterization
Morphological characterization of wsCQDs was analyzed with TEM. The TEM images (Fig. 1) clearly show that wsCQDs are well dispersed in nature with spherical morphology. Synthesized wsCQDs are monodisperse with a narrow size distribution having 1–3 nm in diameter as indicated in inset of Fig. 1(a).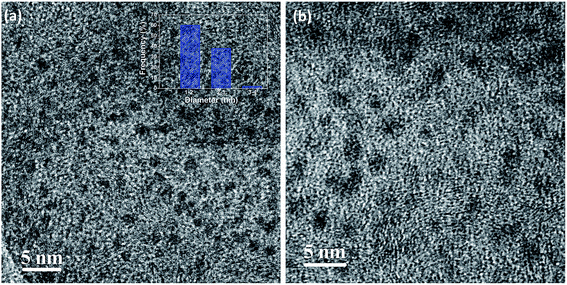 | ||
| Fig. 1 (a) Low and (b) high resolution TEM images of wsCQDs; inset (a) corresponding size distribution histogram. | ||
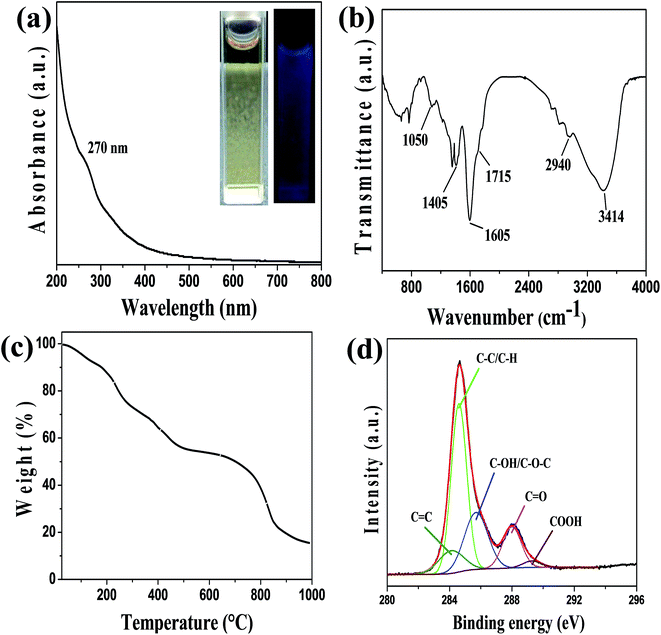
Typical UV-vis absorption spectrum of wsCQDs is illustrated in Fig. 2(a). A continuous increase in absorption from 800–200 nm with a broad absorption band at 270 nm was observed. This band was assigned to n–π* and π–π* transition of the –C![[double bond, length as m-dash]](https://www.rsc.org/images/entities/char_e001.gif) O and conjugated C
O and conjugated C![[double bond, length as m-dash]](https://www.rsc.org/images/entities/char_e001.gif) C bonds and are in accordance with earlier reports for graphitic nano carbons.58,59 The aqueous solution of wsCQDs exhibited bright blue luminescence under UV light irradiation as demonstrated in inset of Fig. 2(a) wsCQDs are highly soluble in water resulting in a highly dispersed solution (inset of Fig. 2(a)). Aqueous dispersion of wsCQDs showed zeta potential value of −57.9 mV (Fig. S2†) confirming the presence of high density negatively charged carboxylic groups on their surface. The solution was highly stable for a very long period of time and showed no signs of precipitation or aggregation.
C bonds and are in accordance with earlier reports for graphitic nano carbons.58,59 The aqueous solution of wsCQDs exhibited bright blue luminescence under UV light irradiation as demonstrated in inset of Fig. 2(a) wsCQDs are highly soluble in water resulting in a highly dispersed solution (inset of Fig. 2(a)). Aqueous dispersion of wsCQDs showed zeta potential value of −57.9 mV (Fig. S2†) confirming the presence of high density negatively charged carboxylic groups on their surface. The solution was highly stable for a very long period of time and showed no signs of precipitation or aggregation.
FTIR analysis was performed to analyze the presence of polar functional groups over wsCQDs surface. The characteristic absorption bands for –COOH and –OH groups are observed as shown in Fig. 2(b). A broad band at ∼3414 cm−1 appears for the –OH stretching frequency. Peak at 1605 cm−1 and 1405 cm−1 is a signature for the existence of –COO−. Peak at 1715 is due to existence of C![[double bond, length as m-dash]](https://www.rsc.org/images/entities/char_e001.gif) O. A C–H vibration peak appears at 2940 cm−1. FTIR spectrum reveals the presence of hydrophilic surface functional groups over wsCQDs surface, imparting the excellent water solubility. The thermal stability of as synthesized wsCQDs was analyzed by TGA in inert atmosphere up to 1000 °C. Weight loss versus temperature plot for wsCQDs is demonstrated in Fig. 2(c). wsCQDs start losing weight progressively and ∼84.7% weight loss were observed at 1000 °C. The weight loss was attributed due to decomposition of hydrophilic functional groups present on the surface of wsCQDs.37,58,60,61
O. A C–H vibration peak appears at 2940 cm−1. FTIR spectrum reveals the presence of hydrophilic surface functional groups over wsCQDs surface, imparting the excellent water solubility. The thermal stability of as synthesized wsCQDs was analyzed by TGA in inert atmosphere up to 1000 °C. Weight loss versus temperature plot for wsCQDs is demonstrated in Fig. 2(c). wsCQDs start losing weight progressively and ∼84.7% weight loss were observed at 1000 °C. The weight loss was attributed due to decomposition of hydrophilic functional groups present on the surface of wsCQDs.37,58,60,61
X-ray photoelectron spectroscopy (XPS) was used for further confirmation of the different functional groups on the surface of wsCQDs. The XPS spectrum for C1s shown in Fig. 2(d) confirms the five diverse chemical surroundings. C![[double bond, length as m-dash]](https://www.rsc.org/images/entities/char_e001.gif) C at 284.1 eV, C–C and C–H at 284.6 eV correspond to sp2 and sp3 carbons, respectively. Peaks at 285.7 eV, 288 eV and 289.3 eV corroborates the –C–OH/C–O–C, –C
C at 284.1 eV, C–C and C–H at 284.6 eV correspond to sp2 and sp3 carbons, respectively. Peaks at 285.7 eV, 288 eV and 289.3 eV corroborates the –C–OH/C–O–C, –C![[double bond, length as m-dash]](https://www.rsc.org/images/entities/char_e001.gif) O and –COOH, respectively. Presence of C–OH/C–O–C, –C
O and –COOH, respectively. Presence of C–OH/C–O–C, –C![[double bond, length as m-dash]](https://www.rsc.org/images/entities/char_e001.gif) O and –COOH reveal the hydrophilic surface functionalization of wsCQDs which is consistent with FTIR and zeta potential analysis.61
O and –COOH reveal the hydrophilic surface functionalization of wsCQDs which is consistent with FTIR and zeta potential analysis.61
3.2. Photoluminescence study
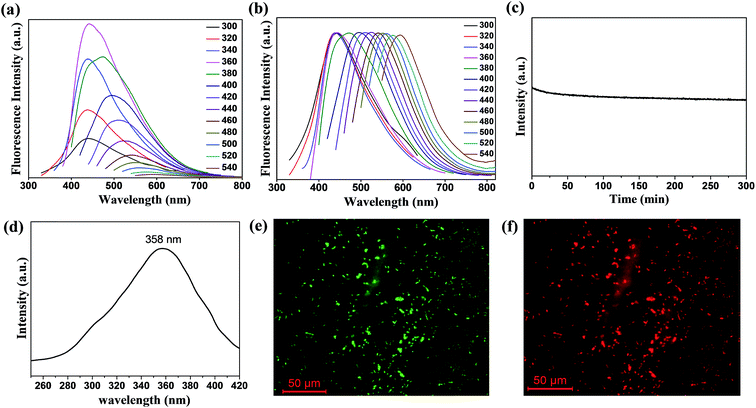
Photoluminescence (PL) behavior is the classic signature of CQDs and considered as most significant property from the application viewpoint. Fluorescence emission spectra of wsCQDs were analyzed at different excitation wavelengths ranging from 300 to 540 nm with a continuous span of 20 nm. Emission spectra as demonstrated in Fig. 3(a) clearly reveal the tunable emissive nature of wsCQDs. On increasing excitation wavelengths, red shift on emission wavelengths were observed, which is recognized as generic feature of graphitic carbon core.36 These tunable emissions depicted the multicolor behavior of wsCQDs. The emission intensity increases from λex 300 nm to 360 nm then gradually decreases up to λex 540 nm. The highest emission intensity was observed for excitation at 360 nm. Hence, λex of 360 nm was selected and employed for the further study of metal detection. Fig. 3(b) shows the normalized fluorescent emission intensity. PL mechanism for tunable emissions of CQDs is not clearly understood up to now. A number of recent studies have been reported to investigate the origin of tunable emissions. According to Sun and coworkers, optical behaviors of CDs can be partially explained on the basis of surface energy traps and/or quantum confinement effects.62 Deng et al. adapted hydrophilicity gradient ultracentrifuge separation technique for the synthesis of CDs with diverse hydrophilic nature.63 They proposed that tunable emissions of CDs mainly arose from the particles' surface molecular states and were independent of their sizes. The effect of surface functionalities on the tunable emission behavior of CDs was recently investigated by Dhenadhayalan et al.64The PL emissions of wsCQDs are quite stable and highly suitable for biomedical applications. Almost negligible photobleaching was observed after continuous irradiation with λex = 360 nm for 5 h as demonstrated in Fig. 3(c). Fig. 3(d) shows the photoluminescent excitation spectra of wsCQDs at 358 nm. The wsCQDs exhibited different emission colors under optical microscopic investigation. Green and red colors were observed at λex = 488 nm and λex = 540 nm, respectively as shown in Fig. 3(e) and (f). This phenomenon is extensively observed for a wide variety of luminescent nano carbons and could be explained on the basis of optical selection of different surfacial defects.35,65 PL QY were measured using quinine sulphate as a reference and found ∼14% for the freshly prepared aqueous solution of wsCQDs and retained ∼9% even after one year of storage (Fig. S1†). Formula for the calculation of quantum yield is shown in ESI.† Table S1† shows the comparison between synthetic methods, quantum yields and applications of wsCQDs obtained from lemon peel waste with other reported methods. It can be seen that wsCQDs obtained through a facile and cost effective method in the present work exhibited a relatively higher QY.
3.3. Detection of Cr6+ ions
wsCQDs with excellent water solubility and PL properties were used as a fluorescent probe for the selective and sensitive detection of Cr6+ ions. Herein, a simple, fast and economic approach was adopted for the specific detection of toxic metal ions in water. At λex of 360 nm, wsCQDs exhibited λem at 441 nm and the fluorescence intensity was effectively quenched on the addition of Cr6+ (1 × 10⁻³ M) solution. Fig. 4(a) illustrates the PL spectrum of wsCQDs after addition of 5 μL Cr6+ solution (red line) followed by a series of spectra obtained as increasing Cr6+ concentration progressively by 10 μL till 100 μL. Fig. 4(a) clearly reveals an obvious decrease in PL intensity in presence of Cr6+ ions. Hence, indicating that the fluorescence quenching of wsCQDs is sensitive towards Cr6+ ions with a linear relationship and almost quenched after the addition of 100 μL solution. A linear response was observed between Cr6+ concentration and decrease in fluorescence quenching efficiency in the range of 2.5–50 μM. Fig. 4(b) represents the Stern–Volmer plot for the dependence of (Io/I) with Cr6+ concentration, where Io is initial PL intensity, and I is PL intensity after the addition of Cr6+ solution with time. The linear response curve can be fitted as Io/I = 0.1024X + 0.4573 (X is the concentration of Cr6+ solution, μM) with a correlation coefficient of 0.9542. Five parallel determinations were conducted at fixed Cr6+ concentration (10 μM) to achieve relative standard deviation (RSD). RSD of 0.25% anticipated the reliability of fluorescence “turn off” sensor. The detection limit is anticipated to be as low as 73 nM at a signal-to-noise ratio of 3. Table S2† shows the comparison of the various fluorescence based sensors towards Cr6+ detection with wsCQDs obtained from lemon peel waste. As per world health organization (WHO), Cr6+ concentrations lower than ∼900 nM are acceptable in drinking water. Thus, our fluorescent based method is sensitive enough to monitor Cr6+ concentration in drinking water. This wsCQDs based sensor provides significant advantages including simplicity, low instrumentation cost and fast response and thus exhibited the potential application for the detection of Cr6+ in environmental industry. Regarding the mechanism for the quenching of PL intensity by metal ions, a number of investigations have been carried out.46 Cr6+ can assist non-radiative recombination of electron–hole pair extinction via effective electron transfer/energy transfer process due to the presence of vacant d orbitals and low lying d–d transition state3 and consequently lead to the fluorescence quenching of wsCQDs.66To evaluate the selectivity of wsCQDs towards Cr6+, the fluorescence responses were investigated in presence of other metal ions such as Ni2+, Cd2+, Fe2+, Cu2+, Mn2+, Co2+, and Ba2+ under the same experimental conditions. Fig. 4(c) represents the selectivity of wsCQDs towards Cr6+ ions. It was observed that quenching of wsCQDs emission was more effective for Cr6+ rather than other metal ions. Only small interference was observed by Cd2+, Fe2+ and Cu2+ ions. The selectivity can be explained on the basis of higher thermodynamic affinity of Cr6+ ions to wsCQDs. The presence of oxygenous surfacial group as confirmed by FTIR, TGA, XPS and zeta potential studies brings the selectivity of wsCQDs towards Cr6+ ions.
3.4. Photocatalytic study
Fig. 5 demonstrated the FESEM and TEM micrographs of fabricated TiO2 nanofibers and TiO2–wsCQDs composite. The TiO2 retains nanofibers morphology after the calcination step as shown in Fig. 5(a). Diameter of TiO2 nanofibers were found in the range of 80–120 nm and several μm in length, as observed by FESEM image in Fig. 5(a). TEM image of TiO2 nanofibers reveals its rough and porous nature as shown in Fig. 5(b). FESEM image of TiO2–wsCQDs composite is shown in Fig. 5(c). Immobilization of wsCQDs on TiO2 nanofibers did not affect its morphology. Surface of TiO2–wsCQDs composites were more roughened as compared to the pure TiO2 nanofibers, due to the deposition of wsCQDs. TEM micrograph of the composite as shown in Fig. 5(d) reveals that wsCQDs are evenly distributed over TiO2 nanofibers surface.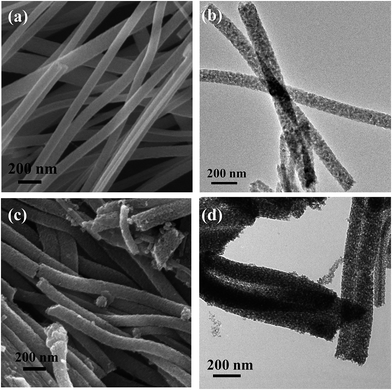 | ||
| Fig. 5 (a) FESEM and (b) TEM micrograph of TiO2 nanofibers; (c) FESEM and (d) TEM micrograph of TiO2–wsCQDs composites. | ||
To quantify the loading of wsCQDs over TiO2 nanofibers, TGA of TiO2 nanofibers and TiO2–wsCQDs composites was carried out in air environment from room temperature to 600 °C as shown in Fig. 6(a). TiO2 nanofibers lost ∼2% weight due to adsorbed water, while TiO2–wsCQDs composite lost ∼5.7% of total weight. The effective loading of wsCQDs over TiO2 nanofibers was find out to be 3.7% (on weight basis). Fig. 6(b) shows the PL graph of TiO2 nanofibers and TiO2–wsCQDs composite. It can be observed that both the samples exhibited the evident emission peak upon excitation with 370 nm light. Immobilization of wsCQDs upon TiO2 nanofibers exhibited considerable reduction in emission intensity due to the lowering of excitons recombination. For the bare TiO2 nanofibers, highest intensity peak at 423 nm is assigned to the self-trapped excitations of anatase TiO2 nanofibers, while the other low intensity peaks at 487, 505 and 528 nm are attributed due to the oxygen vacancies and defect states in the surface of TiO2 nanofibers.67,68 After wsCQDs immobilization over TiO2 nanofibers, the highest intensity peak gets reduced, owing to the effective excitons separation and enhancement in the life time of excitons.
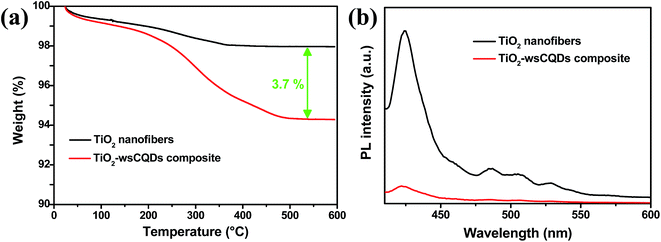 | ||
| Fig. 6 (a) TGA graph of TiO2 solid nanofibers and TiO2–wsCQDs composite and (b) PL spectra of TiO2 nanofibers and TiO2–wsCQDs composite. | ||
UV-vis spectra of TiO2 nanofibers and TiO2–wsCQDs composite are shown in Fig. S3(a).† TiO2 nanofibers did not exhibit any absorption in visible region, while TiO2–wsCQDs composite shows an additional absorption tail in visible region.28,69 Fig. S3(b)† shows the XRD spectra of bare TiO2 nanofibers and TiO2–wsCQDs composite. The XRD pattern of TiO2 nanofibers was well matched with the reference pattern (JCPDS no. 01-083-2243) and peaks were assigned accordingly. TiO2 nanofibers contain anatase phase and have tetragonal structure. Nanofibers also contain a very small rutile peak at 27.2° corresponding to the (110) plane. There is no significant change in the XRD pattern of TiO2–wsCQDs composite which may be due to poor crystallinity and low loading of wsCQDs.
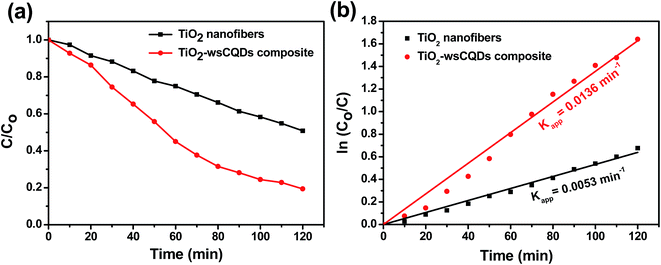
Photocatalytic degradation of MB was performed in a Petri dish under UV light irradiation. Adsorption–desorption equilibrium was carried out for 2 h with continuous stirring under dark conditions. Initial concentration for photocatalytic experiment was taken after the adsorption–desorption equilibrium and no significant degradation of MB was observed when exposed to UV light without photocatalyst. Further, MB was exposed under the irradiation of UV light in presence of TiO2 nanofibers and TiO2–wsCQDs composite separately. Characteristic peak for absorption of MB was observed at 664 nm. Upon irradiation, both the blue colour of MB solution and absorption peak intensity were decreased continuously with time and corresponding C/Co vs. irradiance time graph is shown in Fig. 7(a). Rate constant of MB degradation was calculated using ln(Co/C) vs. time plot (Fig. 7(b)) and found 0.0053 and 0.0136 min−1 for TiO2 nanofibers and TiO2–wsCQDs composite, respectively. TiO2–wsCQDs composite exhibited improved photocatalytic activity than that of TiO2 nanofibers. Kinetic rate constant of TiO2–wsCQDs composite was found ∼2.5 times higher than the TiO2 nanofibers. Table S3† shows the comparison of the photocatalytic performance of various carbon dot heterostructures with TiO2–wsCQDs composite.
Fig. 8(a) shows the schematic presentation for photocatalytic degradation mechanism of MB with TiO2–wsCQDs composite under UV irradiation. Photocatalytic activity was enhanced due to the increased catalytic spot at TiO2–wsCQDs interface. Upon UV irradiation, excitons (electron–hole pair) were created over TiO2 nanofibers and electrons were transferred to wsCQDs from TiO2 conduction band, while holes remain in the valance band of TiO2. This reduces the recombination of excitons and thus, enhances the photocatalytic reaction.28,53 These electrons lead to the generation of superoxide ion (O2−) upon reaction with oxygen at TiO2–wsCQDs photocatalyst surface and the holes produce hydroxyl radical (OH˙) upon reaction with water. The other intermediate steps are discussed in detail in the ESI.† O2− ions, OH˙ radicals and other intermediates subsequently degrade the MB into harmless products. Digital images of MB before and after degradation are shown in Fig. 8(b) wsCQDs also enhance the adsorption of MB over TiO2–wsCQDs surface due to its adsorptive property and thus, favouring their photocatalytic activity.
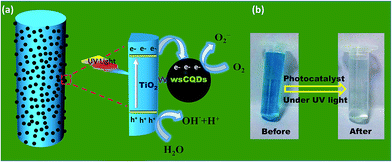 | ||
| Fig. 8 (a) Schematic illustration for the photocatalytic degradation of MB on TiO2–wsCQDs composite under UV light irradiation and (b) digital images of MB before and after degradation. | ||
4. Conclusions
Water soluble carbon quantum dots with high QY were synthesized using a facile and cost effective hydrothermal process utilizing lemon peel waste. Hydrothermal synthesis possesses the merits of green synthesis and resource-saving process with short reaction time. As synthesized wsCQDs have the nearly spherical morphology and narrow size distribution. A fluorescent probe for label free sensitive and selective turn-off sensing of Cr6+ was demonstrated, with linear range and low detection limit of ∼73 nM. The wsCQDs based fluorescence assay exhibited promising potential for the detection of toxic metal ions as well as for bioimaging applications. Further, TiO2–wsCQDs composite was fabricated and employed for the photocatalytic degradation of MB dye. Photocatalytic activity for TiO2–wsCQDs composite was found ∼2.5 times more than TiO2 nanofibers due to improved charge separation at the interface. The synthesis method for wsCQDs could be easily scaled up for gram scale synthesis of carbon quantum dots.Acknowledgements
This work is supported by Department of Science and Technology (DST), India INSPIRE Faculty Award (Project No. IFA-13 ENG-57). DST support is acknowledged to the Center for Nanosciences.References
- D. Zhang, Z. Dong, X. Jiang, M. Feng, W. Li and G. Gao, Anal. Methods, 2013, 5, 1669–1675 RSC
.
- A. Zhitkovich, Chem. Res. Toxicol., 2011, 24, 1617–1629 CrossRef CAS PubMed
.
- Y. Han, Y. You, Y.-M. Lee and W. Nam, Adv. Mater., 2012, 24, 2748–2754 CrossRef CAS PubMed
.
- S. K. Sonkar, K. M. Tripathi and S. Sarkar, J. Nanosci. Nanotechnol., 2014, 14, 2532–2538 CrossRef CAS PubMed
.
- J. Vacek, T. Mozga, K. Cahová, H. Pivoňková and M. Fojta, Electroanalysis, 2007, 19, 2093–2102 CrossRef CAS
.
- D. G. Babar, S. K. Sonkar, K. M. Tripathi and S. Sarkar, J. Nanosci. Nanotechnol., 2014, 14, 2334–2342 CrossRef CAS PubMed
.
- X. Mao, H. Su, D. Tian, H. Li and R. Yang, ACS Appl. Mater. Interfaces, 2013, 5, 592–597 CAS
.
- J. P. Metters, R. O. Kadara and C. E. Banks, Analyst, 2012, 137, 896–902 RSC
.
- R. Chomchoei, M. Miró, E. H. Hansen and J. Shiowatana, Anal. Chem., 2005, 77, 2720–2726 CrossRef CAS PubMed
.
- T. Senapati, D. Senapati, A. K. Singh, Z. Fan, R. Kanchanapally and P. C. Ray, Chem. Commun., 2011, 47, 10326–10328 RSC
.
- A. Bernaus, X. Gaona, J. M. Esbrí, P. Higueras, G. Falkenberg and M. Valiente, Environ. Sci. Technol., 2006, 40, 4090–4095 CrossRef CAS PubMed
.
- R. Kunkel and S. E. Manahan, Anal. Chem., 1973, 45, 1465–1468 CrossRef CAS PubMed
.
- N. Gogoi, M. Barooah, G. Majumdar and D. Chowdhury, ACS Appl. Mater. Interfaces, 2015, 7, 3058–3067 CAS
.
- Y. Zhi, L. Zhaohui, X. Minghan, M. Yujie, Z. Jing, S. Yanjie, G. Feng, W. Hao and Z. Liying, Nano-Micro Lett., 2013, 5, 247–259 CrossRef
.
- Y.-P. Sun, B. Zhou, Y. Lin, W. Wang, K. A. S. Fernando, P. Pathak, M. J. Meziani, B. A. Harruff, X. Wang, H. Wang, P. G. Luo, H. Yang, M. E. Kose, B. Chen, L. M. Veca and S.-Y. Xie, J. Am. Chem. Soc., 2006, 128, 7756–7757 CrossRef CAS PubMed
.
- S. N. Baker and G. A. Baker, Angew. Chem., Int. Ed., 2010, 49, 6726–6744 CrossRef CAS PubMed
.
- W. Kwon, S. Do, J.-H. Kim, M. Seok Jeong and S.-W. Rhee, Sci. Rep., 2015, 5, 12604 CrossRef CAS PubMed
.
- L. Cao, M. J. Meziani, S. Sahu and Y.-P. Sun, Acc. Chem. Res., 2013, 46, 171–180 CrossRef CAS PubMed
.
- M. Zhang, Q. Yao, C. Lu, Z. Li and W. Wang, ACS Appl. Mater. Interfaces, 2014, 6, 20225–20233 CAS
.
- J. Sun, L. Bo, L. Yang, X. Liang and X. Hu, RSC Adv., 2014, 4, 14385–14391 RSC
.
- A. Basu, A. Suryawanshi, B. Kumawat, A. Dandia, D. Guin and S. B. Ogale, Analyst, 2015, 140, 1837–1841 RSC
.
- K. M. Tripathi, N. R. Gupta and S. K. Sonkar, in Smart Materials for Waste Water Applications, ed. A. K. Mishra, Scrivener Publishing LLC, UK, 2016, ch. 5, pp. 127–153 Search PubMed
.
- J. Wang, S. Sahu, S. K. Sonkar, K. N. Tackett Ii, K. W. Sun, Y. Liu, H. Maimaiti, P. Anilkumar and Y.-P. Sun, RSC Adv., 2013, 3, 15604–15607 RSC
.
- X. Huang, F. Zhang, L. Zhu, K. Y. Choi, N. Guo, J. Guo, K. Tackett, P. Anilkumar, G. Liu, Q. Quan, H. S. Choi, G. Niu, Y.-P. Sun, S. Lee and X. Chen, ACS Nano, 2013, 7, 5684–5693 CrossRef CAS PubMed
.
- H. Wang, J. Yi, S. Mukherjee, P. Banerjee and S. Zhou, Nanoscale, 2014, 6, 13001–13011 RSC
.
- X. Li, M. Rui, J. Song, Z. Shen and H. Zeng, Adv. Funct. Mater., 2015, 25, 4929–4947 CrossRef CAS
.
- A. Tyagi, K. M. Tripathi and R. K. Gupta, J. Mater. Chem. A, 2015, 3, 22507–22541 CAS
.
- H. Yu, Y. Zhao, C. Zhou, L. Shang, Y. Peng, Y. Cao, L.-Z. Wu, C.-H. Tung and T. Zhang, J. Mater. Chem. A, 2014, 2, 3344–3351 CAS
.
- Prateek, V. K. Thakur and R. K. Gupta, Chem. Rev., 2016, 116, 4260–4317 CrossRef CAS PubMed
.
- G. E. LeCroy, S. K. Sonkar, F. Yang, L. M. Veca, P. Wang, I. Kenneth, N. Tackett, J.-J. Yu, E. Vasile, H. Qian, Y. Liu, P. G. Luo and Y.-P. Sun, ACS Nano, 2014, 8, 4522–4529 CrossRef CAS PubMed
.
- S. K. Sonkar, M. Roy, D. G. Babar and S. Sarkar, Nanoscale, 2012, 4, 7670–7675 RSC
.
- M. Saxena, S. K. Sonkar and S. Sarkar, RSC Adv., 2013, 3, 22504–22508 RSC
.
- K. M. Tripathi, A. Tyagi, M. Ashfaq and R. K. Gupta, RSC Adv., 2016, 6, 29545–29553 RSC
.
- H. Tao, K. Yang, Z. Ma, J. Wan, Y. Zhang, Z. Kang and Z. Liu, Small, 2012, 8, 281–290 CrossRef CAS PubMed
.
- P. G. Luo, S. Sahu, S.-T. Yang, S. K. Sonkar, J. Wang, H. Wang, G. E. LeCroy, L. Caoa and Y.-P. Sun, J. Mater. Chem. B, 2013, 1, 2116–2127 RSC
.
- P. G. Luo, F. Yang, S.-T. Yang, S. K. Sonkar, L. Yang, J. J. Broglie, Y. Liua and Y.-P. Sun, RSC Adv., 2014, 4, 10791–10807 RSC
.
- K. M. Tripathi, A. K. Sonker, S. K. Sonkar and S. Sarkar, RSC Adv., 2014, 4, 30100–30107 RSC
.
- W. Wang, Y. Li, L. Cheng, Z. Cao and W. Liu, J. Mater. Chem. B, 2014, 2, 46–48 RSC
.
- H. Wu, F. Zeng, H. Zhang, J. Xu, J. Qiu and S. Wu, Adv. Sci., 2015, 3, 1500254 CrossRef
.
- H. Ding, F. Du, P. Liu, Z. Chen and J. Shen, ACS Appl. Mater. Interfaces, 2015, 7, 6889–6897 CAS
.
- S. Chen, C. Xiong, H. Liu, Q. Wan, J. Hou, Q. He, A. Badu-Tawiah and Z. Nie, Nat. Nanotechnol., 2015, 10, 176–182 CrossRef CAS PubMed
.
- X. Xu, R. Ray, Y. Gu, H. J. Ploehn, L. Gearheart, K. Raker and W. A. Scrivens, J. Am. Chem. Soc., 2004, 126, 12736–12737 CrossRef CAS PubMed
.
- P. Dubey, K. M. Tripathi, R. Mishra, A. Bhati, A. Singh and S. K. Sonkar, RSC Adv., 2015, 5, 87528–87534 RSC
.
- H. Li, Z. Kang, Y. Liu and S.-T. Lee, J. Mater. Chem., 2012, 22, 24230–24253 RSC
.
- X. Qin, W. Lu, A. M. Asiri, A. O. Al-Youbi and X. Sun, Catal. Sci. Technol., 2013, 3, 1027–1035 CAS
.
- Q. Wang, X. Liu, L. Zhang and Y. Lv, Analyst, 2012, 137, 5392–5397 RSC
.
- M. Misra, R. K. Gupta, A. K. Paul and M. Singla, J. Power Sources, 2015, 294, 580–587 CrossRef CAS
.
- N. Singh, K. Mondal, M. Misra, A. Sharma and R. K. Gupta, RSC Adv., 2016, 6, 48109–48119 RSC
.
- M. R. Hoffmann, S. T. Martin, W. Choi and D. W. Bahnemann, Chem. Rev., 1995, 95, 69–96 CrossRef CAS
.
- M. Montazer and E. Pakdel, J. Photochem. Photobiol., C, 2011, 12, 293–303 CrossRef CAS
.
- M. N. Chong, B. Jin, C. W. K. Chow and C. Saint, Water Res., 2010, 44, 2997–3027 CrossRef CAS PubMed
.
- A. Prasannan and T. Imae, Ind. Eng. Chem. Res., 2013, 52, 15673–15678 CrossRef CAS
.
- F. Li, F. Tian, C. Liu, Z. Wang, Z. Du, R. Li and L. Zhang, RSC Adv., 2015, 5, 8389–8396 RSC
.
- D. Li and Y. Xia, Nano Lett., 2003, 3, 555–560 CrossRef CAS
.
- K. V. Kumar, K. Porkodi and F. Rocha, Catal. Commun., 2008, 9, 82–84 CrossRef CAS
.
- B. Hu, K. Wang, L. Wu, S.-H. Yu, M. Antonietti and M.-M. Titirici, Adv. Mater., 2010, 22, 813–828 CrossRef CAS PubMed
.
- B. Yin, J. Deng, X. Peng, Q. Long, J. Zhao, Q. Lu, Q. Chen, H. Li, H. Tang, Y. Zhang and S. Yao, Analyst, 2013, 138, 6551–6557 RSC
.
- P. Dubey, K. M. Tripathi and S. K. Sonkar, RSC Adv., 2014, 4, 5838–5844 RSC
.
- P. Dubey, S. K. Sonkar, S. Majumder, K. M. Tripathi and S. Sarkar, RSC Adv., 2013, 3, 7306–7312 RSC
.
- K. M. Tripathi, A. K. Sonker, A. Bhati, J. Bhuyan, A. Singh, A. Singh, S. Sarkar and S. K. Sonkar, New J. Chem., 2016, 40, 1571–1579 RSC
.
- S. Sahu, B. Behera, T. K. Maiti and S. Mohapatra, Chem. Commun., 2012, 48, 8835–8837 RSC
.
- X. Wang, L. Cao, F. Lu, M. J. Meziani, H. Li, G. Qi, B. Zhou, B. A. Harruff, F. Kermarrec and Y.-P. Sun, Chem. Commun., 2009, 25, 3774–3776 RSC
.
- L. Deng, X. Wang, Y. Kuang, C. Wang, L. Luo, F. Wang and X. Sun, Nano Res., 2015, 8, 2810–2821 CrossRef CAS
.
- N. Dhenadhayalan, K.-C. Lin, R. Suresh and P. Ramamurthy, J. Phys. Chem. C, 2016, 120, 1252–1261 CAS
.
- M. Ghosh, S. K. Sonkar, M. Saxena and S. Sarkar, Small, 2011, 7, 3170–3177 CrossRef CAS PubMed
.
- S. Liu, J. Tian, L. Wang, Y. Zhang, X. Qin, Y. Luo, A. M. Asiri, A. O. Al-Youbi and X. Sun, Adv. Mater., 2012, 24, 2037–2041 CrossRef CAS PubMed
.
- Z. Lian, W. Wang, S. Xiao, X. Li, Y. Cui, D. Zhang, G. Li and H. Li, Sci. Rep., 2015, 5, 10461 CrossRef CAS PubMed
.
- R. Verma, S. K. Samdarshi and J. Singh, J. Phys. Chem. C, 2015, 119, 23899–23909 CAS
.
- J. Pan, Y. Sheng, J. Zhang, J. Wei, P. Huang, X. Zhang and B. Feng, J. Mater. Chem. A, 2014, 2, 18082–18086 CAS
.
Footnotes |
| † Electronic supplementary information (ESI) available: Characterization techniques, quantum yield determination of wsCQDs, comparison tables for quantum yield, detection limit and photocatalytic activity, zeta potential curve, UV-vis/XRD spectra and photocatalytic reactions. See DOI: 10.1039/c6ra10488f |
| ‡ Contributed equally. |
| This journal is © The Royal Society of Chemistry 2016 |


