Incorporation of STED technique into single-molecule spectroscopy to break the concentration limit of diffusing molecules in single-molecule detection†
Namdoo
Kim‡
 a,
Jiwoong
Kwon‡
 b,
Youngbin
Lim
 b,
Jooyoun
Kang
 a,
Sohyeon
Bae
 a and
Seong Keun
Kim
 *ab
*ab
aDepartment of Chemistry, Seoul National University, Seoul 08826, Korea. E-mail: seongkim@snu.ac.kr
bDepartment of Biophysics and Chemical Biology, Seoul National University, Seoul 08826, Korea
First published on 13th August 2018
Abstract
By incorporating STED (stimulated emission depletion) nanoscopy into single-molecule spectroscopy, we demonstrate that the concentration limit imposed by optical diffraction can be overcome in diffusion-based single-molecule measurement. We showed that single-molecule detection is feasible at a concentration of 5 nM, which is 100-times higher than the limit of conventional single-molecule measurements.
In the last two decades, single-molecule spectroscopy has provided useful information about individual biomolecules, unclouded by ensemble averaging, for problems in biochemical kinetics, photophysical dynamics, conformational changes, inter- and intra-molecular interactions, molecular movements, force measurements, and even DNA sequencing.1–9 Despite its many advantages, however, use of the diffusion-based single molecule technique has been restricted to dilute samples (with a concentration down to tens of pM) due to the diffraction-limited observation volume (typically ∼1 fL with a conventional confocal microscope).6 Considering that many biomolecular interactions of interest have a dissociation constant larger than ∼nM,10 this certainly poses a grave limit in applying the diffusion-based single molecule technique to study such interactions.
Various methods have been developed to break the concentration limit and detect a single molecule in high concentrations of the order of ∼nM. Total internal reflection is broadly used to confine the detection volume to a depth of ∼100 nm with evanescent wave.11 A zero-mode waveguide, whose diameter is much smaller than the wavelength of the light used, is employed to generate an evanescent field with a penetration depth of tens of nm.12 The nanopores and other nanoparticle-based single-molecule sensors can also detect single DNA or RNA molecules in nM scale through selective observation of targets.13,14 Convex lens induced confinement (CLIC) utilizes the small contact point of a plano-convex lens and coverglass to confine the z-axis dimension down to 5 nm.15 Concentration-independent single molecule spectroscopy (ciSMS) uses UV and visible lights for reversible photo-switching of a fluorophore in high concentration of fluorescent protein.16 Most of these techniques have been applied to only immobilized samples or spatially confined species, however, and are subject to the possibility of surface-induced perturbations in the presence of a high level of background.
The purpose of this study is to incorporate a super-resolution nanoscopic technique that ensures a sub-diffraction-limit detection volume into an existing single-molecule detection platform to achieve a concentration limit far beyond that of diffusion-based single-molecule spectroscopy.
Like many single-molecule detection method that uses FRET (fluorescence resonance energy transfer),17 the detection method of our choice in this study, ALEX (alternating laser excitation)-FRET, also uses FRET but it involves alternating excitation of the fluorescence donor and acceptor to obtain information about the inter-probe distance as well as their stoichiometric composition.6 ALEX-FRET has been applied to measuring four inter-probe distances as well as their compositions18,19 in addition to other studies about conformations, kinetics, mechanisms and millisecond dynamics of biomolecules.20–23
The super-resolution platform we employed is STED (stimulated emission depletion) nanoscopy, which had been developed as a means of breaking the optical diffraction limit in far-field optical microscopy: d = λ/(2NA) (d: maximally resolved spatial dimension, λ: wavelength of the light, NA: numerical aperture of the microscope). Stimulated emission is applied to conventional confocal microscopy to actively switch off molecules in the excited state in regions other than a tightly confined focal volume using a doughnut-shaped STED beam.24
Simultaneous employment of STED and ALEX-FRET to respectively confine the excitation volume under the diffraction limit and measure the inter-probe distance as well as stoichiometric composition would allow one to overcome the concentration limit in diffusion-based single-molecule detection for diverse intermolecular interactions.
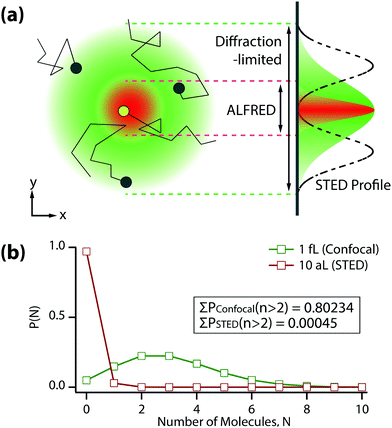
In this paper, we demonstrate the feasibility of such simultaneous use of ALEX-FRET and STED (to be whimsically called “ALFRED”) to detect a single diffusing molecule in a highly concentrated solution. Fig. 1(a) shows that the observation volume of conventional single-molecule detection as dictated by the optical diffraction limit (green) can be drastically reduced to a much smaller volume (red) upon applying the STED beam. A high concentration situation that would have forbidden single-molecule detection in the diffraction-limited volume (black dots in green sphere) does not prevent single-molecule detection if the detection volume becomes sub-diffraction-limited (yellow dot in red sphere).
The probability for the number of molecules N that exist in the detection volume at certain concentration is given by the Poisson distribution, P(N; n) = nNe−n/N!, where n represents the average number of molecules in the volume. Fig. 1(b) shows the Poisson distribution for two different detection volumes, 1 fL (diffraction-limited detection volume, green) and 10 aL (100-times reduced STED detection volume, red), at a concentration of 5 nM, which is 100-times higher than the conventional concentration encountered in the detection of single diffusing molecule. The probability of more than two molecules existing in the detection volume is >80% in the diffraction-limited case, whereas it is drastically reduced to <0.05% in the STED case. This shows that single-molecule detection is totally ensured by ALFRED even at a concentration as high as 5 nM.
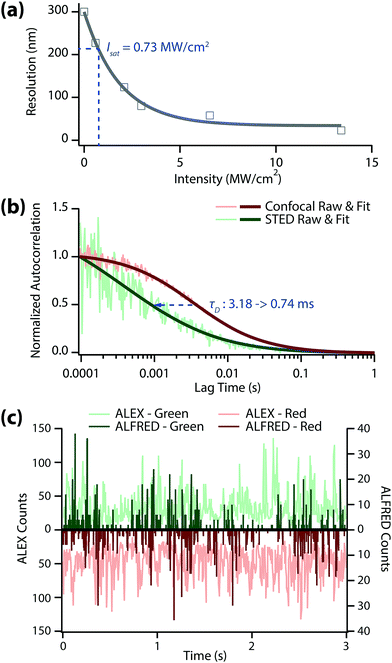
We investigated how small the detection volume can be made in our system (Fig. 2(a)) using a home-built STED microscope (Fig. S1, ESI†). The resolution was determined from the full-width at half maximum (FWHM) value of the STED image of 20 nm fluorescent Crimson beads in 97% thiodiethanol (TDE) solution. We obtained a saturation intensity (Isat) of 0.73 MW cm−2 from Fig. 2(a) off the resolution that equals to ro/√2 (ro = λ/2NA, diffraction-limit resolution). The best resolution we achieved was ∼23 nm (at 13.4 MW cm−2 of depletion intensity), which is >10-times better than the resolution without the depletion laser (∼300 nm). This result means that the concentration limit in single-molecule detection can be easily enhanced to >5 nM with a STED depletion beam.
As a model system to further demonstrate the feasibility of ALFRED, we prepared a 30 bp double stranded DNA (dsDNA) labeled with a FRET pair, DY510XL and Atto647N. In order to efficiently deplete the excited state population of both fluorophores with a single depletion laser, we chose DY510XL that has a large Stokes’ shift and broad emission spectrum. We used 30% of poly(ethylene glycol) (PEG) to increase the viscosity and diffusion time so that we could collect enough photons from the fluorophores traveling across the reduced detection volume. Moreover, the quantum yield of DY510XL, which is only 0.025 in phosphate buffered saline solution, increases notably in the viscous solution (Fig. S2, ESI†).
In single-molecule spectroscopy, the diffusion time (τD) of target molecule plays an important role when we use an intensity-based analysis method such as FRET. In this case, a longer binning time than τD is required to accurate obtain the fluorescence intensity (Fig. S3, ESI†). Furthermore, the alternation period of each excitation laser should also remain shorter than τD in ALEX-FRET.18 We performed fluorescence correlation spectroscopy to evaluate the diffusion times of dsDNA under the ALEX vs. ALFRED conditions with 30% PEG (Fig. 2b). The diffusion time of dsDNA dropped markedly as we switched from ALEX to ALFRED (3.18 ms → 0.74 ms), suggesting the detection volume was accordingly reduced. Based on these FCS results, we set the photon binning time at 3.5 ms for ALEX and 1.0 ms for ALFRED (both slightly longer than the respective diffusion times), while the alternation time of each excitation laser was fixed at 50 μs in both cases.
Fig. 2(c) shows the fluorescence time trace of the dual-labeled dsDNA in 30% PEG solution at 5 nM concentration. In this measurement, we binned the collected photons with the afore-mentioned binning times (3.5 ms for ALEX and 1.0 ms for ALFRED). For ALEX measurement (light green/light red), there may exist more than two molecules in the diffraction-limited detection volume at this concentration, which results in a time trace of their average values with considerable stochastic fluctuations. In contrast, for ALFRED measurement (dark green/dark red), at most only one molecule can exist in the reduced detection volume, yielding only fluorescence ‘bursts’ above zero background. These bursts are regarded as the sum of all photons from individual molecules, and therefore one can extract information about the target at the single-molecule level by analyzing each burst.
Next, we tested whether ALFRED can distinguish two different dsDNAs, each labeled with only either the fluorescence donor or acceptor in a highly concentrated solution. Comparison between ALEX-FRET measured at 100 pM and ALFRED measured at 1 nM concentration of the same sample shows a good agreement (Fig. S4, ESI†).
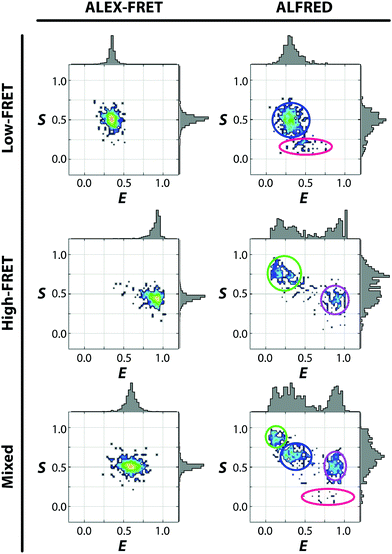
We then employed a dual-labeled dsDNA in heterogeneous compositions with a deliberate design of a large or small inter-probe distance, in addition to the inevitable populations of partially labeled species (donor-only and acceptor-only). The 2D E–S diagrams of Fig. 3 (right panel) show how clearly ALFRED can resolve these 4 distinct species, in contrast to the ALEX-FRET data obtained at the same concentration, which appear all lumped together (left panel). In ALEX-FRET, the signals from multiple species having different fluorophore compositions were collected together in the binning time, yielding the averaged FRET value in the diagram. On the other hand, in ALFRED, the condition for single-molecule detection is warranted by the reduced detection volume, allowing extraction of information about individual dsDNA molecules.
Although all possible 4 compositions of the labeled dsDNA were unambiguously identified by ALFRED, the standard deviation of their signals is larger than that of ALEX-FRET measurement. The lower signal-to-noise ratio of ALFRED is likely a result of smaller photon counts, which must be due to the reduction in the time of passage through the detection volume and/or the photobleaching of the fluorophores by the intense depletion laser. Photobleaching may also account for the higher populations of the donor- and acceptor-only species detected with the application of the depletion laser (Fig. S5, ESI†), since photobleaching would turn some of the doubly labeled species into singly-labeled (or even unlabeled) species.
In conclusion, we demonstrated successful incorporation of super-resolution STED nanoscopy into single-molecule spectroscopy (ALEX-FRET in this study) to drastically reduce the detection volume below the diffraction-limited size. We showed that the concentration limit in the conventional single-molecule detection is completely overcome now to reach 5 nM, which is 100-times higher than in conventional diffusion-based single molecule spectroscopy. Since this level of concentration is comparable to the dissociation constant of many enzymes interacting with their substrates, this new method will allow one to investigate many enzyme–substrate reactions at the single-molecule level. The concentration limit of ALFRED is now restricted by the quantum yield and stimulated emission cross-section of the fluorophores, which can be overcome by developing new fluorophores with more suitable properties to enable single-molecule detection at even higher concentrations.
This work was supported by the National Research Foundation of Korea grant (No. 2018R1A2B2001422). We also acknowledge the BK21 Plus Program and SNU Brain Fusion Grant.
Conflicts of interest
There are no conflicts to declare.Notes and references
- W. Moerner and L. Kador, Phys. Rev. Lett., 1989, 62, 2535–2538 CrossRef PubMed.
- D. Haarer and L. Kador, Angew. Chem., Int. Ed. Engl., 1991, 30, 540–541 CrossRef.
- R. A. Keller, W. P. Ambrose, P. M. Goodwin, J. H. Jett, J. C. Martin and M. Wu, Appl. Spectrosc., 1996, 50, 12A–32A CrossRef.
- W. E. Moerner, J. Phys. Chem. B, 2002, 106, 910–927 CrossRef.
- B. Schuler, E. A. Lipman and W. A. Eaton, Nature, 2002, 419, 743–747 CrossRef PubMed.
- A. N. Kapanidis, N. K. Lee, T. A. Laurence, S. Doose, E. Margeat and S. Weiss, Proc. Natl. Acad. Sci. U. S. A., 2004, 101, 8936–8941 CrossRef PubMed.
- S. Myong, I. Rasnik, C. Joo, T. M. Lohman and T. Ha, Nature, 2005, 437, 1321–1325 CrossRef PubMed.
- D. Deamer, M. Akeson and D. Branton, Nat. Biotechnol., 2016, 34, 518–524 CrossRef PubMed.
- K. C. Neuman and A. Nagy, Nat. Methods, 2008, 5, 491–505 CrossRef PubMed.
- P. Tinnefeld, Nat. Nanotechnol., 2013, 8, 480–482 CrossRef PubMed.
- E. J. Ambrose, Nature, 1956, 178, 1194 CrossRef PubMed.
- M. J. Levene, J. Korlach, S. W. Turner, M. Foquet, H. G. Craighead and W. W. Webb, Science, 2003, 299, 682–686 CrossRef PubMed.
- T. Xie, M. Li and Y.-T. Long, Chem. Commun., 2017, 53, 7768–7771 RSC.
- J. Yu, C. Cao and Y.-T. Long, Anal. Chem., 2017, 89, 11685–11689 CrossRef PubMed.
- S. R. Leslie, A. P. Fields and A. E. Cohen, Anal. Chem., 2010, 82, 6224–6229 CrossRef PubMed.
- C. Eggeling, M. Hilbert, H. Bock, C. Ringemann, M. Hofmann, A. C. Stiel, M. Andresen, S. Jakobs, A. Egner, A. Schönle and S. W. Hell, Microsc. Res. Tech., 2007, 70, 1003–1009 CrossRef PubMed.
- T. Förster, Ann. Phys., 1948, 437, 55–75 CrossRef.
- N. K. Lee, A. N. Kapanidis, H. R. Koh, Y. Korlann, S. O. Ho, Y. Kim, N. Gassman, S. K. Kim and S. Weiss, Biophys. J., 2007, 92, 303–312 CrossRef PubMed.
- J. Lee, S. Lee, K. Ragunathan, C. Joo, T. Ha and S. Hohng, Angew. Chem., Int. Ed., 2010, 49, 9922–9925 CrossRef PubMed.
- J. Kang, J. Jung and S. K. Kim, Biophys. Chem., 2014, 195, 49–52 CrossRef PubMed.
- N. K. Lee, H. R. Koh, K. Y. Han and S. K. Kim, J. Am. Chem. Soc., 2007, 129, 15526–15534 CrossRef PubMed.
- I. H. Stein, C. Steinhauer and P. Tinnefeld, J. Am. Chem. Soc., 2011, 133, 4193–4195 CrossRef PubMed.
- J.-Y. Kim, C. Kim and N. K. Lee, Nat. Commun., 2015, 6, 153 Search PubMed.
- S. W. Hell and J. Wichmann, Opt. Lett., 1994, 19, 780–782 CrossRef PubMed.
Footnotes |
| † Electronic supplementary information (ESI) available: Full experimental schemes including the details of the experimental setup, sample preparation, data analysis and supporting figures. See DOI: 10.1039/c8cc05726e |
| ‡ These authors equally contributed to this work. |
| This journal is © The Royal Society of Chemistry 2018 |


