Copper matrix nanocomposites based on carbon nanotubes or graphene
Dawid
Janas
 *a and
Barbara
Liszka
b
aDepartment of Chemistry, Silesian University of Technology, B. Krzywoustego 4, 44-100 Gliwice, Poland. E-mail: dawid.janas@polsl.pl; Tel: +48 32 2372958
bFaculty of Earth Sciences, University of Silesia, 75 Pułku Piechoty 1, 41-500 Chorzów, Poland
First published on 31st August 2017
Abstract
Recently, copper–nanocarbon composites have become the focal point of many research groups around the world. The reason for this phenomenon is that carbon nanotubes or graphene have proven that they can bring the technology of copper to a whole new level due to their extraordinary electrical, thermal and mechanical properties. The addition of even small amounts of nanocarbon into a copper matrix can significantly enhance its performance, but unfortunately integration of these two materials is not trivial. In this review article, we highlight methods of manufacture of Cu–nanocarbon composites and properties of the resulting material. We stress their strong and weak points as well as indicate pending challenges remaining to be sorted out to produce a nanocomposite of significantly improved properties as compared to neat Cu. Finally, we identify future directions, which must be taken to bring these materials closer to mass-production and eventually to real-life applications.
1. Introduction
During the last few decades, there has been a growing interest in nanotechnology, which encompasses objects so tiny (of the order of 10−9 m) that they are actually quite difficult to imagine. The conception of the possibility of material construction, modification and application on such a small scale, given by the famous lecture “There is plenty of room at the bottom” by American physicist Richard Feynman1 became an inspiration to taking up the subject for many researchers, and continues to this day. Some accomplishments have been particularly successful in boosting the R&D in this field: the discovery of new forms of carbon such as fullerenes in 1985,2 carbon nanotubes (CNTs) in 19913 and graphene in 20044 were particularly successful. Nanotechnology has since then had a much wider impact and opened up new horizons in almost all modern disciplines such as materials science,5,6 biochemistry,7,8 catalysis,9–11 medicine,12,13 various parts of engineering14–16 and many others.Bulk copper has been one of the leading choices for applications requiring high performance in terms of electrical and thermal conductivity for hundreds of years. It is the second least resistive metal after silver (copper: 1.68 × 10⁻⁸ Ω m, silver: 1.59 × 10⁻⁸ Ω m)17 with impressive current-carrying capacity of the order of 106 A cm−2![[thin space (1/6-em)]](https://www.rsc.org/images/entities/char_2009.gif) 18 and the highest thermal conductivity among metals, 398 W m−1 K.19 From a practical point of view, it can easily be formed into conductive wires or tracks, which explains its abundance in many applications ranging from microelectronics, overhead power transmission lines, active heat exchangers to heat sinks. Ever since carbon nanomaterials such as CNTs or graphene came into existence, researchers wondered how to utilize their unbeaten electrical and thermal properties to further improve the established technology of copper. Enhancements are necessary to meet the requirements of our modern world wherein energy demand is growing and its management has to be of the highest possible efficiency. Research on copper nanocomposites is now in the exponential phase (Fig. 1) and scientific groups from all around the world work on the development of copper–nanocarbon composites with significantly improved properties. In fact, first attempts to integrate copper with carbon (e.g. graphite, carbon fiber) took place as early as the 1970s20,21 or before.
18 and the highest thermal conductivity among metals, 398 W m−1 K.19 From a practical point of view, it can easily be formed into conductive wires or tracks, which explains its abundance in many applications ranging from microelectronics, overhead power transmission lines, active heat exchangers to heat sinks. Ever since carbon nanomaterials such as CNTs or graphene came into existence, researchers wondered how to utilize their unbeaten electrical and thermal properties to further improve the established technology of copper. Enhancements are necessary to meet the requirements of our modern world wherein energy demand is growing and its management has to be of the highest possible efficiency. Research on copper nanocomposites is now in the exponential phase (Fig. 1) and scientific groups from all around the world work on the development of copper–nanocarbon composites with significantly improved properties. In fact, first attempts to integrate copper with carbon (e.g. graphite, carbon fiber) took place as early as the 1970s20,21 or before.
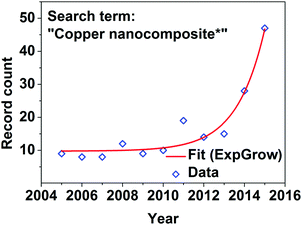 | ||
| Fig. 1 Trends in research on copper nanocomposites represented as number of journal publications in the last 10 years as reported by the Web of Science database. | ||
There has been a range of techniques employed to manufacture Cu–nanocarbon composites, but the three most common routes are based on powder metallurgy,22–34 electroplating35–45 or electroless deposition.46,47 The synthetic approach has to be precisely designed to overcome the problem of the “cuprophobic” nature of nanocarbon materials. Due to the large surface free energy mismatch (72.9 mJ m−2 for nanocarbon48 as opposed to 1650 mJ m−2 for Cu49), these two materials have only a slight affinity to each other and often it is hard to combine them without special pretreatment steps for nanocarbon50 or engaging carbide forming materials at the interface.51 Although carbide forming metals such as Ti, Co, Cr, V, W or Mo have lower electrical conductivity than Cu, they create a much better Ohmic interface with unfunctionalized nanocarbon materials.52,53 When good contact is obtained between nanocarbon and Cu, the composite reveals significantly improved properties. For instance, Cu–CNT composites proved to have one hundred-fold higher ampacity (maximum amount of electric current that a conductor can carry without deterioration; often referred to as current-carrying capacity) than pure copper40 (besides improvements in terms of mechanical and thermal properties). The effect is a result of the suppressed electromigration of Cu atoms at high current density and a skin effect at high frequency.54 Encouraging results from other metal matrix composites loaded with CNTs or graphene strongly suggest that the nanocarbon additive may bring an enhancement of properties on many fronts.55–58
In this review article, we summarize up to date progress that has been made in the synthesis and evaluation of performance of copper nanocomposites with a focus on CNTs or graphene as the additive to the copper matrix. First, we present the successful strategies to combine nanocarbon and copper. Then, we show the electrical, thermal and mechanical properties of the composites. To prove the advantage of using the nanocomposites over traditional materials in these areas, we compare the measured values with a neat copper reference recorded using the same setup in each case. Since some properties (e.g. Vickers hardness) are very much dependent on the testing parameters, we compared the performance of the Cu–nanocarbon composites versus that of neat copper measured under the same conditions (where appropriate data were reported). Finally, we highlight the possible applications and suggest future directions of research.
2. Preparation methods
The methods used to combine nanocarbon and copper are mostly based on established techniques such as powder metallurgy, electroplating or electroless deposition. In this section, we stress their merits, scalability potential and the nature of the material they produce.2.1. Cu–CNT composites
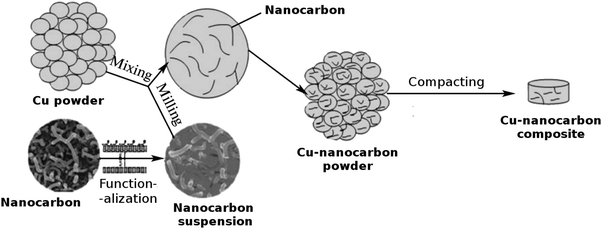 | ||
| Fig. 2 Powder processing route to the Cu–nanocarbon composite. Modified and reproduced with permission. Copyright 2015, Pleiades Publishing Ltd.59 | ||
Many materials have been considered to enhance the properties of copper, but addition of another phase was often found to increase the scattering rate of the conducting electrons or deteriorate stress transfer capabilities. As a consequence, there is a consensus that the amount of nanocarbon should not be excessive. Another important aspect is homogeneity of CNT distribution and good interfacial bonding to the Cu matrix. It was shown that the addition of 5 vol% of double-wall CNTs can increase the Vickers microhardness by more than 50% (up to 82 – as compared with 50 for pure Cu) with a notable decrease in the average friction coefficient.23 It was observed that an increase in the number of CNT walls lowers microhardness. The authors explained this effect by a decrease in packing density with the increase in the number of constituting walls.
In another approach reported by Rajkumar et al., CNTs were first precoated with Cu by electroless deposition and then mixed/compacted/sintered according to the regular powder metallurgy route24 to improve the intermatrix bonding. The results showed that addition of CNTs lowers the wear rate as compared with unreinforced copper. The reason was the formation of a carbonaceous film at the contact surface, which introduced lubricating properties into the material. The nanocomposites also indicated high Vickers microhardness (up to 126), which was 26% harder than regular copper.
Contact between CNTs and the copper matrix can also be improved by shearing the composite powder with a high-speed rotary blade.25 This causes interparticle impacting, shearing and friction, which results in coating of the Cu particles with nanocarbon. During the course of compositing, CNT assemblies disintegrate into individual CNTs and used dendritic Cu particles turn into spheres. Despite the good contact between the Cu matrix and CNTs, the length of CNT is reduced, which results in imperfect phonon coupling. As a consequence, thermal conductivity of the nanocomposites is slightly inferior to that of pure copper (328 vs. 331 W m−1 K−1).
Nevertheless, there are reports utilizing the powder metallurgy route, which show the thermal conductivity of the Cu–CNT composite to be higher than that of copper (359 vs. 345 W m−1 K−1). However, the thermal conductivity of Cu is commonly given as 400 W m−1 K−1,37 so further research is needed to confirm whether the measured conductivity of the composite is in fact higher or if Cu of inferior quality was used as the reference.
Furthermore, because of the notable anisotropy of CNT electrical/thermal conductivity, which is much higher along the axis than in the radial direction, it is important to align the individual CNTs in the matrix. Yoo et al. employed high-ratio differential speed rolling (HRDSR) of Cu–CNT composite sheaths to target this goal (Fig. 3 and 4).27 The Vickers microhardness of the nanocomposite was almost twice that of pure Cu (135 vs. 70) whereas the UTS reached 500 MPa (as compared with 400 MPa for Cu measured under the same conditions). The results also showed that ball-milling/rolling degrades the structure of the CNTs, therefore it should be used for the shortest possible amount of time to preserve their highly conductive character. Because of high-shear strain induced by HRDSR, the CNTs themselves were found on the grain boundaries within the bulk of the Cu matrix (Fig. 3). It is interesting to note that equal speed rolling results in poorly dispersed and scattered CNTs throughout the Cu matrix.
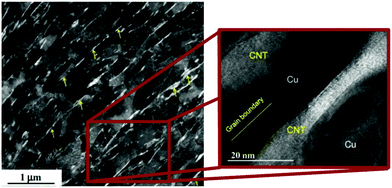 | ||
| Fig. 3 CNTs on the grain boundaries of the Cu matrix as observed by bright-field high-resolution TEM. Modified and reproduced with permission. Copyright 2013, Elsevier.27 | ||
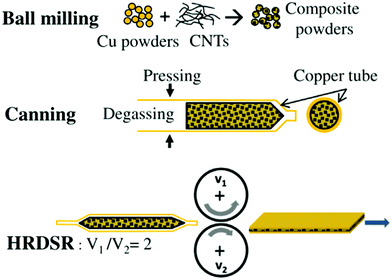 | ||
| Fig. 4 Fabrication procedure of the Cu–nanocarbon composite by high-ratio differential speed rolling (HRDSR). Modified and reproduced with permission. Copyright 2013, Elsevier.27 | ||
In all of the cases, high-ratio differential speed rolling gave better mechanical properties than the samples prepared by equal speed rolling. Shukla et al. showed that hardness of the composites increases with the content of single-wall CNTs, but the opposite was true for multi-wall CNTs. Single-wall CNTs were generally found to have better reinforcement properties.61 At the same time, an increase in the CNT content may increase the dislocation density in the composites.59 The size and shape of copper particles is also important. Dendritic Cu particles give composites with nanocarbon that have higher microhardness than composites made from spherical Cu particles.62 What is more, prolonged milling of Cu–CNT mixtures often leads to a flake-like morphology of Cu27,60,61 if the content of CNTs is relatively low or excessive milling is carried out (Fig. 5a). With an increased CNT content, the Cu particles become smaller and more spherical in shape (Fig. 5b), which has a negative effect on bonding between individual constituents. The bottom line is that the processing power and time have to be optimized. Cu–CNT composites with good intermatrix bonding should be obtained with minimum disruption to the hexagonal lattice of the CNTs. This ensures improved properties of the nanocomposite as compared with pure Cu.
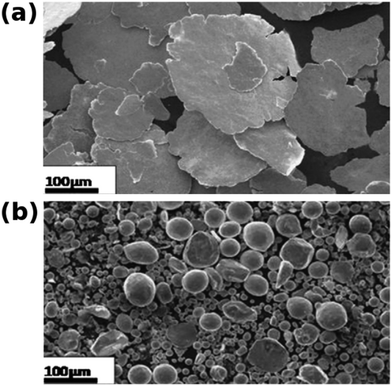 | ||
| Fig. 5 Microstructure of Cu–CNT composites. (a) Flake-like. (b) Spherical. Modified and reproduced with permission. Copyright 2013, Elsevier.60 | ||
 | ||
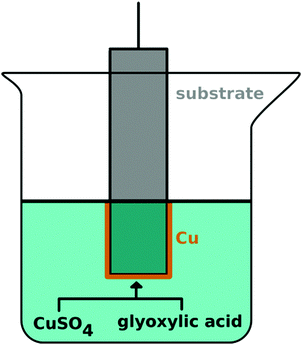
| Fig. 6 Cu–nanocarbon manufacture by electrodeposition. Modified and reproduced with permission. Copyright 2014, Royal Society of Chemistry.37 | ||
Another interesting property of the Cu–nanocarbon composite is its exceptionally low Coefficient of Thermal Expansion (CTE). When CNTs, which have negative CTE,65 are electroplated with Cu of positive CTE,66 the resulting material has 70% lower CTE than most metals.37 The net effect gives a silicon-like CTE on the order of 5 ppm K−1. Because of its high thermal conductivity (395 W m−1 K−1) and negligible CTE mismatch with silicon, the nanocomposite has been considered as a promising heat sink for CPUs and other silicon-based circuits, which generate heat inside of computers.
With regard to the process of electrodeposition, a variety of modifications have been devised to improve it. For instance, Feng et al. described the co-deposition of Cu and CNTs onto a substrate with nanodiamonds used as a dispersing agent to prevent agglomeration of CNTs.38 The authors claim that nanodiamonds help to mitigate agglomeration of CNTs in polymer matrices,67 but the merits of using them for electrodeposition were not shown. Next, electrodeposition by periodic pulse reverse had a positive effect on the speed of the deposition, but the conductivity of the nanocomposite was inferior to that prepared by DC electroplating. Moreover, Cu–CNT composites prepared by electrodeposition also have improved microhardness as compared to pure copper. An increase by up to 36% was observed.39 Probably the most notable improvement in properties, which justifies combination of Cu and CNTs on an industrial scale, comes from the results of Subramaniam et al.40,41 In a two step process, CNTs were first electroplated with Cu seeds using an organic medium (copper acetate in acetonitrile) and then electrodeposition from typical aqueous solution was employed. Organic media are much better for infiltrating hydrophobic CNTs to precoat them with Cu seeds, from which Cu clusters can grow in the subsequent step. The team has shown that the Cu–CNT nanocomposite can have two orders of magnitude higher ampacity, an order of magnitude lower TCR and similar electrical conductivity as compared with pure Cu. Electromigration of Cu, the primary cause of failure at high current, was suppressed to a large extent. At this level, the Cu–CNT composite already shows significant competitive advantage. It is probably most evident in terms of specific conductivity, which takes into account the weight of a conductor. Because of the high electrical conductivity but low density of CNTs, the Cu–CNT composite has 26% higher specific conductivity than pure Cu.
Next, as stressed by Hannula et al., to prepare Cu–CNT nanocomposites of appreciable properties by electrodeposition, two issues must be overcome. Firstly, the current distribution throughout the CNT macroassembly is often non-uniform,68 which causes excessive nucleation close to the electrodes, but insufficient nucleation beyond a certain distance from a current feed point due to a large voltage drop. Ideally, CNT macroassemblies such as fibers or films, which are the target for Cu electrodeposition, should be of low resistivity to alleviate this problem. Secondly, similar to the case of the powder metallurgy route, the CNTs should have some degree of functionalization50 to improve the interaction with Cu. Such functionalization again should not be too severe so as not to disrupt the sp2-network of carbon atoms, which allows for efficient transport of charge carriers.
A summary of the properties of the Cu–CNT composites is given in Table 1.
| Preparation method | CNT | Best properties | Ref. | |||
|---|---|---|---|---|---|---|
| Content (vol %) | Type | Electrical | Thermal | Mechanical | ||
| ρ (electrical resistivity), a (ampacity), α (temperature coefficient of resistance), κ (thermal conductivity), UTS (ultimate tensile strength), HV (Vickers hardness), δ (elongation to fracture), E (Young's modulus), σ (flexural strength), CTE (coefficient of thermal expansion). | ||||||
| Powder processing | 0.5 vol | DWCNTs | ρ: 2.03 × 10⁻⁸ Ω m (1.95 × 10⁻⁸) | N/A |
UTS: 560 MPa (450)
δ: 7.5% (6.2) |
22 |
| 0–10 vol |
DWCNTs
MWCNTs |
N/A | N/A | HV: 82 (50) | 23 | |
| 0–20 vol | MWCNTs | N/A | N/A | HV: 126 (100) | 24 | |
| 0–10 vol | MWCNTs | N/A | κ: 328 W m−1 K−1 (331) | N/A | 25 | |
| 0–10 vol | MWCNTs | N/A | κ: 359 W m−1 K−1 (345) | N/A | 26 | |
| 0–3 vol | MWCNTs | N/A | N/A |
UTS: 500 MPa (400)
HV: 135 (70) |
27 | |
| Electro-deposition | 0–1 vol | MWCNTs |
ρ: 2.33 × 10⁻⁸ Ω m
a: 1.17 × 10⁴ A cm−2 |
κ: 427 W m−1 K−1 (400) |
UTS: 282.7 MPa (168)
δ: 4% (13) |
35 |
| N/A | MWCNTs | ρ: 2.45 × 10⁻⁵ Ω m | N/A | UTS: 811 MPa | 36 | |
| 45 vol | MWCNTs | N/A | κ: 395 W m−1 K−1 (400) | CTE: 5 ppm K−1 (16) | 37 | |
| N/A | MWCNTs | ρ: 3 × 10⁻⁸ Ω m (1.7 × 10⁻⁸) | N/A | N/A | 38 | |
| 0–10 vol | SWCNTs |
ρ: 1.65 × 10⁻⁸ Ω m (1.67 × 10⁻⁸)
α: 6.20 × 10⁻³ K−1 (6.80 × 10⁻³) |
N/A | HV: 164 (120) | 39 | |
| 45 vol | SWCNTs |
ρ: 2.12 × 10⁻⁸ Ω m (1.72 × 10⁻⁸)
a: 6 × 10⁸ A cm−2 (6 × 10⁶) |
N/A | N/A | 40 and 41 | |
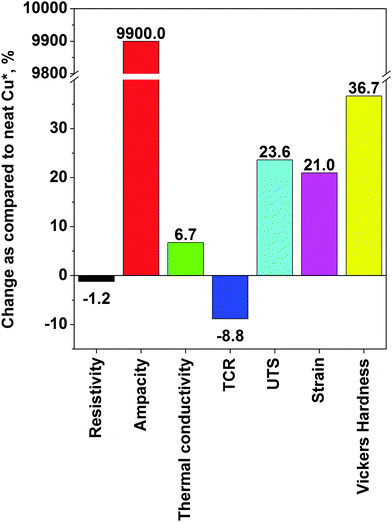
The highest recorded performance in each category is: ρ: 1.65 × 10⁻⁸ Ω m, ampacity: 6 × 10⁸ A cm−2, κ: 427 W m−1 K−1, α: 6.20 × 10⁻³ K−1, UTS: 811 MPa, δ: 7.5% and HV: 164. As compared with the Cu matrix, the biggest improvements are in the area of electrical properties. Ampacity was increased by two orders of magnitude. Moreover, the material had enhanced mechanical properties (especially Vickers hardness), which almost doubled. There was also an evident increase in UTS. Unfortunately, possibly due to imperfect phonon coupling, the increase in thermal conductivity of the Cu–CNT composites was only marginal. A summary of the improvements is presented in Fig. 8. The data show that electrodeposition gives a stronger enhancement of properties of the nanocomposite as compared with pure Cu (Table 1). Nanocomposites prepared by powder processing are mostly improved in terms of their mechanical properties.
2.2. Cu–graphene composites
It must be noted that even starting with nanocarbon of high crystalline order, one must be careful of what kind of processing is involved up to the final step of the composite manufacture. Often, ball-milling, sonication, shear mixing or another fragmentation technique introduces defects and/or breaks down the constituents (individual CNTs or graphene flakes) into much smaller pieces.32 Even if it will make the material more processable, the properties of the resulting copper matrix composite may be inferior. An alternative to improve the interaction between nanocarbon and copper is to precoat one of the constituents with a thin layer of a transition metal such as nickel or chromium, which has affinity towards both the nanocomposite constituents.71 Although it is not ideal for electrical applications because the conductivity of Ni or Cr is much lower than that of Cu or nanocarbon, the results have shown that such an addition is suitable where improved mechanical properties are wanted. A Ni–graphene–Cu composite had 64.5% higher yield strength than that of regular Cu.47 To eliminate the influence of other components than graphene and Cu, the graphene flakes may be precoated with Cu nanoparticles by electroless deposition and then subjected to powder metallurgy processing.46 A UTS as high as 485 MPa was achieved using this approach. In terms of the highest absolute values, a yield strength of 501 MPa was reported,72 which is on par with the previously described best results for Cu–CNT composites.
Other methods. An interesting approach was presented by Chen et al., who mixed Cu powder and PMMA as the graphene precursor, which was then grown in situ34 (Fig. 9). The material was then subjected to regular powder metallurgy processing and analyzed. This technique ensured very good dispersion of the nanocarbon material and good combination between graphene and the Cu matrix. Although just a small increase in Hardness was observed, the Yield strength tripled and reached 144 MPa (as compared with 52 MPa for pure Cu). This once again proves that nanocarbon addition strengthens and toughens the Cu matrix.
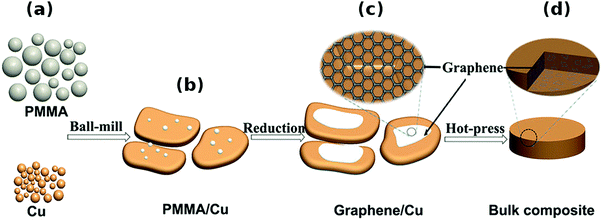 | ||
| Fig. 9 Schematic diagram of the fabrication procedures of graphene/Cu composites. (a) Original Cu powders and poly(methyl methacrylate) (PMMA). (b) Flaky Cu powders loaded with PMMA after ball-milling. (c) Graphene/Cu composite powders. (d) Bulk graphene/Cu composite after hot-press sintering. Modified and reproduced. Copyright 2016, Nature Publishing Group.34 | ||
Another technique to achieve this goal is to use a reported bioinspired strategy74 (Fig. 10). A nacre-like reduced graphene oxide reinforced Cu matrix composite was prepared using a brick-and-mortar impregnation process. In this case, not only the mechanical properties of copper were improved to a large extent, but the inherently high electrical conductivity was preserved.
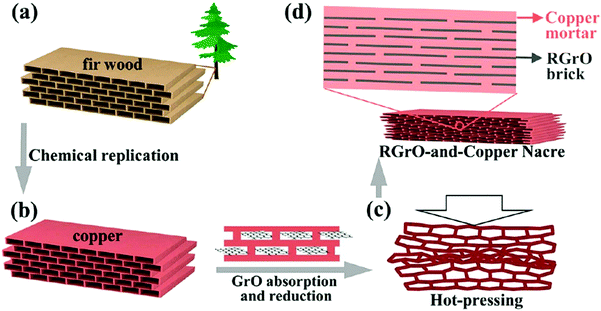 | ||
| Fig. 10 Schematic representation of fabricating RGrO-and-copper artificial nacre. (a) Ordered porous structure in natural fir wood. (b) Replicating the porous structure of fir wood with Cu. (c) Hot-pressing porous Cu preform absorbed with RGrO. (d) RGrO-and-copper nacre consisting of RGrO “brick” and copper “mortar”. RGrO stands for reduced graphene oxide. Modified and reproduced with permission. Copyright 2015, American Chemical Society.74 | ||
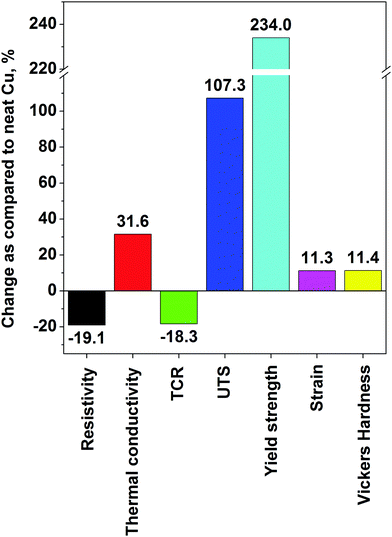
A summary of the properties of the Cu–graphene composites is given in Table 2. The highest recorded performance in each category is: ρ: 1.7 × 10⁻⁸ Ω m, α: 3.03 × 10⁻³ K−1, κ: 500 W m−1 K−1, UTS: 485 MPa, Yield strength: 501 MPa, δ: 45%, HV: 98. In the case of graphene composites, we see that similar to Cu–CNT composites, the electrical conductivity of Cu is reached but no significant improvement is observed. However, in the case of Cu–graphene, we see a notable increase in thermal conductivity, which was as high as 500 W m−1 K−1. With regard to mechanical properties, enhancement in terms of UTS and Vickers hardness is only marginal contrary to the results from the Cu–CNT composites. The exception is the Yield strength, which almost tripled upon graphene incorporation. A summary of the enhancements is given in Fig. 11. Similar to the case of the CNT-based composites, powder processing gives mostly improvements in terms of mechanical properties, whereas electrodeposition enhances electrical and thermal performance.
| Preparation method | Graphene | Best properties | Ref. | |||
|---|---|---|---|---|---|---|
| Content | Type | Electrical | Thermal | Mechanical | ||
| G (graphene), GO (graphene oxide), RGO (reduced graphene oxide), ρ (electrical resistivity), α (temperature coefficient of resistance), κ (thermal conductivity), UTS (ultimate tensile strength), HV (Vickers hardness), δ (elongation to fracture), E (Young's modulus), σ (flexural strength). | ||||||
| Powder processing | 0–0.5 wt% | GO | N/A | κ: 396 W m−1 K−1 (360) |
UTS: 210 MPa (185)
δ: 17% (22) HV: 51 (43) |
28 |
| 0–10 vol% | G | N/A | N/A |
HV: 97
σ: 441 MPa |
29 | |
| 0–2 wt% | G, RGO | ρ: 2.3 × 10⁻⁸ Ω m | N/A | HV: 62 | 30 | |
| 0–0.3 wt% | G, GO | ρ: 2.1 × 10⁻⁸ Ω m (1.74 × 10⁻⁸) | N/A | UTS: 187 MPa (209) | 31 | |
| 0–2 wt% | GO | N/A | N/A |
UTS: 230 MPa (180)
δ: 24% (22) HV: 51 (45) |
32 | |
| 0–6 wt% | RGO | 3% increase in electrical conductivity | N/A | HV: 98 (88) | 33 | |
| 0–0.5 vol% | G | N/A | N/A |
UTS: 275 MPa (220)
δ: 20% (32) |
47 | |
| 1.3 wt% | GO | N/A | N/A |
UTS: 485 MPa (234)
δ: 9% (25) E: 104 (85) GPa |
46 | |
| 0–4.8 vol% | RGO | N/A | N/A | Yield strength: 501 MPa (150) | 72 | |
| Electro-deposition | N/A | GO | N/A | κ: 460 W m−1 K−1 (390) | N/A | 43 |
| N/A | GO |
ρ: 1.91 × 10⁻⁸ Ω m
(2.2 × 10⁻⁸) α: 3.03 × 10⁻³ K−1 (4.04 × 10⁻³) |
N/A | N/A | 44 | |
| N/A | GO |
ρ: 1.7 × 10⁻⁸ Ω m
(2.0 × 10⁻⁸) α: 3.53 × 10⁻³ K−1 (3.81 × 10⁻⁸) |
κ: 500 W m−1 K−1 (380) | N/A | 45 | |
| In situ growth of graphene | 0–0.95 wt% | G | ρ: 1.7 × 10⁻⁸ Ω m (1.8 × 10⁻⁸) | N/A |
UTS: 274 MPa (215)
Yield strength: 144 MPa (52) δ: 45% (40) HV: 143 (123) |
34 |
| Template impregnation | N/A | RGO | ρ: 1.77 × 10⁻⁸ Ω m (1.81 × 10⁻⁸) | N/A |
UTS: 300 MPa (200)
δ: 20% (17) |
74 |
3. Modelling
The results of computation support the experimental findings. In a study by Park et al., the authors prove that oxygen-containing functional groups such as hydroxyl (–OH) or carboxyl (–COOH) or structural defects enhance the interaction between Cu and nanocarbon.75 The binding energy of Cu on the oxidized CNTs increases in the case of pristine CNTs (from −0.53 to −0.73 eV) as well as Stone–Wales defective CNTs (from −1.26 to −2.70 eV). In addition to structural integrity, defects and functional groups promote electron exchange between Cu and carbon atoms. According to calculations, 1.9–2.4 Å is the optimum distance between nanocarbon and Cu.A strong interaction between O and Cu was detected. In fact, the O2p orbital had extensive overlap with a Cu3d orbital, which confirms favorable interaction. On the other hand, according to Wu et al., pristine nanocarbon interacts with Cu through the C2p orbital and the strength of that interaction is very much dependent on the chirality of a particular CNT. The consequence of that is a radically different shape of the calculated I–V curves for various types of Cu–CNT interconnects (Fig. 12).
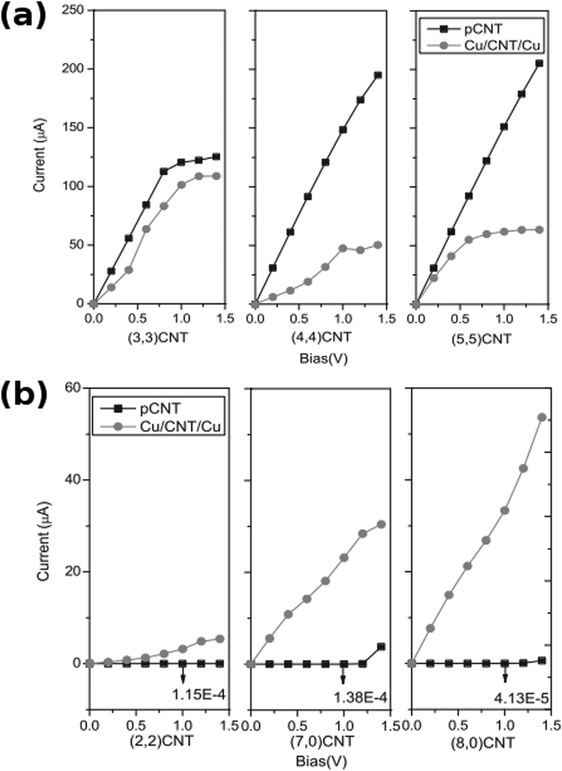 | ||
| Fig. 12 Calculated I–V curves for (a) metallic and (b) semiconducting pristine CNTs (pCNT) and Cu–CNT interconnects (Cu/CNT/Cu) of a given chirality. Modified and reproduced with permission. Copyright 2011, Elsevier.76 | ||
The more aligned CNTs in the composite, the more homogeneous the current distribution density at high frequency. On the macroscopic scale, the CNT length,78 alignment and density in fact play a key role in the electrical conductivity of the composite rather than the chirality77 (Fig. 13). Electrons are injected at the end of a nanotube rather than the side (as shown in the calculated I–V curves in Fig. 14), therefore misalignments of individual CNTs (or graphene flakes79) from the applied bias axis have a deleterious effect on the electrical conductivity.
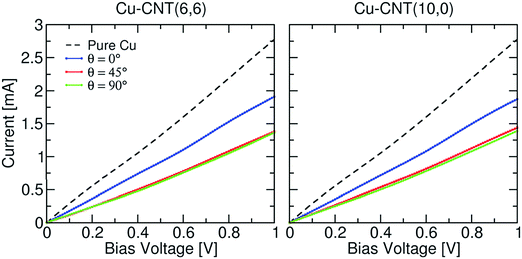 | ||
| Fig. 13 Current–voltage characteristics of Cu–CNT composites with different chirality and orientation. The characteristic of infinite pure Cu is also shown for comparison. Modified and reproduced with permission. Published by the PCCP Owner Societies.77 | ||
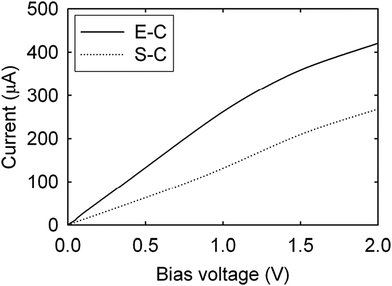 | ||
| Fig. 14 Current–voltage characteristics of Cu–CNT composites with end-contacts (E-C) and side-contacts (S-C). Modified and reproduced with permission. Copyright 2010, American Institute of Physics.80 | ||
The length of individual CNTs should ideally be above 10 μm78 and the diameter within the range of >2 nm (for SWCNTs) and 30–100 nm (for MWCNTs) for the effective resistivity to be optimal (Fig. 15).54
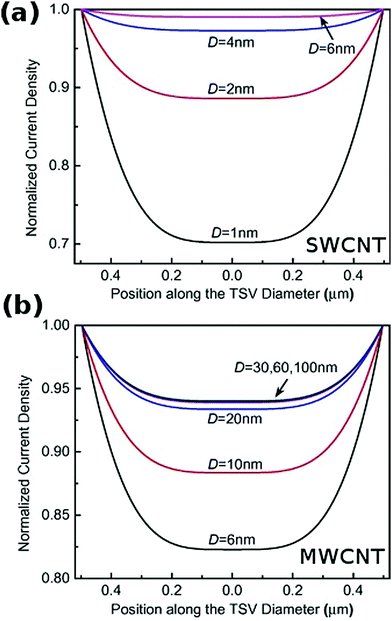 | ||
| Fig. 15 Normalized current density vs. position along the conductor diameter for (a) SWCNT and (b) MWCNT of D diameter. Modified and reproduced with permission. Copyright 2015, Elsevier.54 | ||
Another crucial factor determining the properties of the resulting composite is the structural perfection of the constituting species. A detailed study by Sadowski et al. shows that inclusions of adulterants such as graphite or defects can have a significant negative influence on the performance of the Cu–nanocarbon composite in a variety of applications,79 so the material functionalization level has to be kept at an absolute minimum. Lastly, the presence of nanocarbon greatly reduces the skin effect,54,81 which was later proven experimentally.82,83 The skin effect decreases with increasing content of nanocarbon (Fig. 16). Such a result can be fundamental for the application of Cu–nanocarbon composites for high-frequency AC transmission.
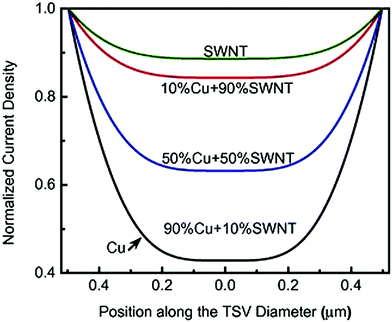 | ||
| Fig. 16 Normalized current density vs. position along the conductor diameter as a function of SWCNT content in a Cu matrix. Modified and reproduced with permission. Copyright 2015, Elsevier.54 | ||
Interestingly from the conduction mechanism point of view, the modelling shows that for small diameter CNTs, only the metallic ones contribute to current conduction according to the results of Feng et al.54
4. Applications
Cu–nanocarbon composites have a wide range of possible applications. One of the advantages of adding CNTs or graphene to Cu is the reduced weight of the resulting composite. Highly thermally and electrically conductive nanotubes or graphene flakes of low-weight can substitute a certain amount of Cu to reach the same performance. Probably the most obvious application for such a composite is in the transport industry for automotive and aerospace applications. Even a small reduction in weight would result in massive savings as these vehicles contain kilograms and tonnes of Cu wiring, respectively. Another area that could gain from using these materials is thermal management. At present, heat sinks are most commonly made from Cu, which is heavy and prone to cracking if subjected to repeated bending. Addition of carbon nanostructures, which are very flexible and produce light-weight nanocomposites with Cu of improved thermal conductivity would be beneficial. Mechanical reinforcement of Cu could be advantageous for other applications as well. Furthermore, carbon nanomaterials are much better suited for application in extreme environments wherein corrosive chemicals are present.84,85 Addition of a protective layer from CNTs or graphene onto a Cu or Cu–nanocarbon composite would enable the use of such conductors in areas where Cu is currently unsuitable.5. Conclusions and future outlook
In this paper, we reviewed the up to date progress in the synthesis and properties of Cu–nanocarbon composites. CNTs or graphene can be combined with the Cu matrix using various methods, but most commonly powder metallurgy, electroplating or electroless deposition are employed. These techniques are scalable and proven at an industrial level in many parts of engineering. This is very important for the possibility of mass-production of Cu–nanocarbon composites of significantly improved properties in the future. One could also consider exploring how to integrate nanocarbon into the existing other large-scale copper technologies such as casting.The nanocomposites have shown advantages on many fronts, but certain aspects have to be taken care of to make these efforts worthwhile. Firstly, the cost of nanocarbon (in particular, graphene and single-wall CNTs) still has to be reduced to a large extent, so that the benefits of the use of a nanocomposite (as compared to pure Cu) are justified from the economic point of view. Over the years we have seen a significant decrease in the unit cost of multi-wall CNTs and an increase in their production capacity. At the end of the day, the same has to be the case for single-wall CNTs and graphene to bring these Cu matrix nanocomposites to a wider audience. Secondly, the production of the Cu–nanocarbon composite requires a very high degree of control over the microstructure and composition of the nanocarbon feed. We need to have means of consistent large-scale manufacture of CNTs or graphene of particular length/diameter/number of walls/chirality/etc. or flake size/number of layers/etc., respectively, both having the desired surface chemistry. Only such a level of control can enable implementation of Cu–nanocarbon composites in real-life.
The nanocomposites have revealed potential to enhance several Cu parameters, the most notable being the electrical (ampacity), mechanical (hardness, tensile strength) and thermal (thermal conductivity, TCR, CTE) properties. With an adequate level of production control, we can imagine tailoring the nanocomposite to create a family of Cu–nanocarbon materials for a spectrum of possible applications such as in high-performance wiring or lighter flexible heat sinks for consumer electronics. That is why the manufacture method of the nanocomposite should be selected according to which properties of copper should be enhanced. In general, powder processing methods have produced nanocomposites of improved mechanical properties, whereas electrodeposition has enhanced the electrical and thermal performance. As we compare copper matrix composites loaded with CNTs and graphene, we see that CNT-based materials have better mechanical properties both in terms of Vickers hardness (164 vs. 98) and UTS (811 vs. 485 MPa), which are almost twice as big as the corresponding values for graphene. On the other hand, graphene-reinforced copper is more thermally conductive (500 vs. 421 W m−1 K−1) and has got a lower TCR (3.03 × 10⁻³vs. 6.20 × 10⁻³ K−1). Electrical conductivity of Cu–CNT and Cu–graphene nanocomposites is on par. It is important to note that for the comparison to be accurate, the composites should have been characterized under the same conditions (the quoted values come from different studies). Because the outermost layer contributes the most to current conduction in CNTs, it is not surprising to see that SWCNTs gave the best composites with Cu in terms of electrical conductivity. From the mechanical point of view, the very high tensile strength of MWCNTs86 translated into excellent reinforcement of the Cu matrix. With regard to graphene, it would be vital to carry out a study to investigate how the number of layers influences the properties of its composite with Cu. We currently know that fine graphene gives composites with Cu of much higher hardness and lower resistivity,30 so maybe targeting single layer graphene Cu matrix composites is the route to the best performance.
What is more, it would be interesting to see the performance of Cu–nanocarbon composites, in which instead of functionalization, carbide forming materials such as Ti or Co would be used for improved bonding between the two materials. Such experiments would enable quantification of whether the performance of the composite is better when carbon nanomaterials are oxidized or a part of them is converted to a connecting carbide layer.
Conflicts of interest
There are no conflicts of interest to declare.Acknowledgements
D. J. kindly acknowledges the National Science Center, Poland (under the Polonez program, grant agreement UMO-2015/19/P/ST5/03799), and the European Union's Horizon 2020 research and innovation programme (Marie Skłodowska-Curie grant agreement 665778). D. J. would also like to thank Foundation for Polish Science for the START scholarship (START 025.2017) and the Rector of the Silesian University of Technology in Gliwice for funding the research in the framework of habilitation grant (04/020/RGH17/0050).References
- R. P. Feynman, Eng. Sci., 1960, 23, 22–36 Search PubMed
.
- H. W. Kroto, J. R. Heath, S. C. O'Brien, R. F. Curl and R. E. Smalley, Nature, 1985, 318, 162–163 CrossRef CAS
.
- S. Iijima, Nature, 1991, 354, 56–58 CrossRef CAS
.
- K. S. Novoselov, A. K. Geim, S. V. Morozov, D. Jiang, Y. Zhang, S. V. Dubonos, I. V. Grigorieva and A. A. Firsov, Science, 2004, 306, 666–669 CrossRef CAS PubMed
.
- Y. L. Li, I. A. Kinloch and A. H. Windle, Science, 2004, 304, 276–278 CrossRef CAS PubMed
.
- X. F. Zhang, X. L. Dong, H. Huang, Y. Y. Liu, W. N. Wang, X. G. Zhu, B. Lv, J. P. Lei and C. G. Lee, Appl. Phys. Lett., 2006, 89, 053115 CrossRef
.
- N. C. Seeman, Annu. Rev. Biochem., 2010, 79, 65–87 CrossRef CAS PubMed
.
- A. El-Ansary and L. M. Faddah, Nanotechnol., Sci. Appl., 2010, 3, 65–76 CrossRef CAS PubMed
.
- D. Deng, K. S. Novoselov, Q. Fu, N. Zheng, Z. Tian and X. Bao, Nat. Nanotechnol., 2016, 11, 218–230 CrossRef CAS PubMed
.
- F. Yang, D. Deng, X. Pan, Q. Fu and X. Bao, Natl. Sci. Rev., 2015, 2, 183–201 CrossRef
.
- M.-C. Daniel and D. Astruc, Chem. Rev., 2004, 104, 293–346 CrossRef CAS PubMed
.
- I. Y. Wong, S. N. Bhatia and M. Toner, Genes Dev., 2013, 27, 2397–2408 CrossRef CAS PubMed
.
- J. R. Heath and M. E. Davis, Annu. Rev. Med., 2008, 59, 251–265 CrossRef CAS PubMed
.
- D. Janas and K. K. Koziol, Carbon, 2013, 59, 457–463 CrossRef CAS
.
- T. Dvir, B. P. Timko, D. S. Kohane and R. Langer, Nat. Nanotechnol., 2011, 6, 13–22 CrossRef CAS PubMed
.
- S. Banta, Z. Megeed, M. Casali, K. Rege and M. L. Yarmush, J. Nanosci. Nanotechnol., 2007, 7, 387–401 CrossRef CAS PubMed
.
- L. Lu, Y. Shen, X. Chen, L. Qian and K. Lu, Science, 2004, 304, 422 CrossRef CAS PubMed
.
- S. Hong and S. Myung, Nat. Nanotechnol., 2007, 2, 207–208 CrossRef CAS PubMed
.
-
D. D. L. Chung, in Composite Materials: Functional Materials for Modern Technologies, ed. D. D. L. Chung, Springer London, London, 2003, pp. 55–71, DOI:10.1007/978-1-4471-3732-0_3
.
- N. S. Dyadenko, A. I. Lun'ko and T. V. Kholoptseva, Sov. Powder Metall. Met. Ceram., 1973, 12, 994–996 CrossRef
.
- J. M. Casstevens, H. G. Rylander and Z. Eliezer, Wear, 1978, 49, 169–178 CrossRef CAS
.
- C. Arnaud, F. Lecouturier, D. Mesguich, N. Ferreira, G. Chevallier, C. Estournès, A. Weibel and C. Laurent, Carbon, 2016, 96, 212–215 CrossRef CAS
.
- C. Guiderdoni, E. Pavlenko, V. Turq, A. Weibel, P. Puech, C. Estournès, A. Peigney, W. Bacsa and C. Laurent, Carbon, 2013, 58, 185–197 CrossRef CAS
.
- K. Rajkumar and S. Aravindan, Wear, 2011, 270, 613–621 CrossRef CAS
.
- K. Chu, H. Guo, C. Jia, F. Yin, X. Zhang, X. Liang and H. Chen, Nanoscale Res. Lett., 2010, 5, 868–874 CrossRef CAS PubMed
.
- S. Cho, K. Kikuchi, T. Miyazaki, K. Takagi, A. Kawasaki and T. Tsukada, Scr. Mater., 2010, 63, 375–378 CrossRef CAS
.
- S. J. Yoo, S. H. Han and W. J. Kim, Carbon, 2013, 61, 487–500 CrossRef CAS
.
- X. Gao, H. Yue, E. Guo, H. Zhang, X. Lin, L. Yao and B. Wang, Powder Technol., 2016, 301, 601–607 CrossRef CAS
.
- J.-f. Li, L. Zhang, J.-k. Xiao and K.-c. Zhou, Trans. Nonferrous Met. Soc. China, 2015, 25, 3354–3362 CrossRef CAS
.
- J. Dutkiewicz, P. Ozga, W. Maziarz, J. Pstruś, B. Kania, P. Bobrowski and J. Stolarska, Mater. Sci. Eng., A, 2015, 628, 124–134 CrossRef CAS
.
- R. Jiang, X. Zhou, Q. Fang and Z. Liu, Mater. Sci. Eng., A, 2016, 654, 124–130 CrossRef CAS
.
- H. Yue, L. Yao, X. Gao, S. Zhang, E. Guo, H. Zhang, X. Lin and B. Wang, J. Alloys Compd., 2017, 691, 755–762 CrossRef CAS
.
- W. Li, D. Li, Q. Fu and C. Pan, RSC Adv., 2015, 5, 80428–80433 RSC
.
- Y. Chen, X. Zhang, E. Liu, C. He, C. Shi, J. Li, P. Nash and N. Zhao, Sci. Rep., 2016, 6, 19363 CrossRef CAS PubMed
.
- J. Shuai, L. Xiong, L. Zhu and W. Li, Composites, Part A, 2016, 88, 148–155 CrossRef CAS
.
- G. Xu, J. Zhao, S. Li, X. Zhang, Z. Yong and Q. Li, Nanoscale, 2011, 3, 4215–4219 RSC
.
- C. Subramaniam, Y. Yasuda, S. Takeya, S. Ata, A. Nishizawa, D. Futaba, T. Yamada and K. Hata, Nanoscale, 2014, 6, 2669–2674 RSC
.
- Y. Feng, G. E. McGuire, O. A. Shenderova, H. Ke and S. L. Burkett, Thin Solid Films, 2016, 615, 116–121 CrossRef CAS
.
- Y. L. Yang, Y. D. Wang, Y. Ren, C. S. He, J. N. Deng, J. Nan, J. G. Chen and L. Zuo, Mater. Lett., 2008, 62, 47–50 CrossRef CAS
.
- C. Subramaniam, T. Yamada, K. Kobashi, A. Sekiguchi, D. N. Futaba, M. Yumura and K. Hata, Nat. Commun., 2013, 4, 2202 Search PubMed
.
- C. Subramaniam, A. Sekiguchi, T. Yamada, D. N. Futaba and K. Hata, Nanoscale, 2016, 8, 3888–3894 RSC
.
- G. Xie, M. Forslund and J. Pan, ACS Appl. Mater. Interfaces, 2014, 6, 7444–7455 CAS
.
- K. Jagannadham, Metall. Mater. Trans. B, 2012, 43, 316–324 CrossRef CAS
.
- K. Jagannadham, J. Vac. Sci. Technol., B: Nanotechnol. Microelectron.: Mater., Process., Meas., Phenom., 2012, 30, 03D109 Search PubMed
.
- K. Jagannadham, Metall. Mater. Trans. A, 2013, 44, 552–559 CrossRef CAS
.
- C. Zhao and J. Wang, Phys. Status Solidi A, 2014, 211, 2878–2885 CrossRef CAS
.
- D. Zhang and Z. Zhan, J. Alloys Compd., 2016, 658, 663–671 CrossRef CAS
.
- S.-G. Cho and K.-C. Ko, Thin Solid Films, 2010, 518, 6619–6623 CrossRef CAS
.
- H. Udin, J. Met., 1951, 3, 1206–1209 Search PubMed
.
- P.-M. Hannula, J. Aromaa, B. P. Wilson, D. Janas, K. Koziol, O. Forsén and M. Lundström, Electrochim. Acta, 2017, 232, 495–504 CrossRef CAS
.
- P. Avouris, Chem. Phys., 2002, 281, 429–445 CrossRef CAS
.
- O. Hjortstam, P. Isberg, S. Söderholm and H. Dai, Appl. Phys. A: Mater. Sci. Process., 2004, 78, 1175–1179 CrossRef CAS
.
- T. Dürkop, S. A. Getty, E. Cobas and M. S. Fuhrer, Nano Lett., 2004, 4, 35–39 CrossRef
.
- Y. Feng and S. L. Burkett, Comput. Mater. Sci., 2015, 97, 1–5 CrossRef CAS
.
- A. Dorri Moghadam, E. Omrani, P. L. Menezes and P. K. Rohatgi, Composites, Part B, 2015, 77, 402–420 CrossRef CAS
.
- A. Dorri Moghadam, B. F. Schultz, J. B. Ferguson, E. Omrani, P. K. Rohatgi and N. Gupta, JOM, 2014, 66, 872–881 CrossRef CAS
.
-
E. Omrani, A. Dorri Moghadam, P. L. Menezes and P. K. Rohatgi, in Ecotribology: Research Developments, ed. J. P. Davim, Springer International Publishing, Cham, 2016, pp. 63–103, DOI:10.1007/978-3-319-24007-7_3
.
- M. Tabandeh-Khorshid, E. Omrani, P. L. Menezes and P. K. Rohatgi, Int. J. Eng. Sci. Res. Technol., 2016, 19, 463–469 Search PubMed
.
- R. K. Khisamov, K. S. Nazarov, L. R. Zubairov, A. A. Nazarov, R. R. Mulyukov, I. M. Safarov, S. N. Sergeev, I. I. Musabirov, D. D. Phuong, P. V. Trinh, N. V. Luan, P. N. Minh and N. Q. Huan, Phys. Solid State, 2015, 57, 1206–1212 CrossRef CAS
.
- A. K. Shukla, N. Nayan, S. V. S. N. Murty, K. Mondal, S. C. Sharma, K. M. George and S. R. Bakshi, Mater. Charact., 2013, 84, 58–66 CrossRef CAS
.
- A. K. Shukla, N. Nayan, S. V. S. N. Murty, S. C. Sharma, P. Chandran, S. R. Bakshi and K. M. George, Mater. Sci. Eng., A, 2013, 560, 365–371 CrossRef CAS
.
- S. M. Uddin, T. Mahmud, C. Wolf, C. Glanz, I. Kolaric, C. Volkmer, H. Höller, U. Wienecke, S. Roth and H.-J. Fecht, Compos. Sci. Technol., 2010, 70, 2253–2257 CrossRef CAS
.
- D. Janas and K. Koziol, Nanoscale, 2016, 8, 19475–19490 RSC
.
- K. Koziol, J. Vilatela, A. Moisala, M. Motta, P. Cunniff, M. Sennett and A. Windle, Science, 2007, 318, 1892–1895 CrossRef CAS PubMed
.
- J. J. Vilatela, R. Khare and A. H. Windle, Carbon, 2012, 50, 1227–1234 CrossRef CAS
.
- F. C. Nix and D. MacNair, Phys. Rev., 1941, 60, 597–605 CrossRef CAS
.
- Y. Sui, V. J. Gokhale, O. A. Shenderova, G. E. McGuire and M. Rais-Zadeh, MRS Proc., 2012, 1452, 1–6 Search PubMed
.
- P.-M. Hannula, A. Peltonen, J. Aromaa, D. Janas, M. Lundström, B. P. Wilson, K. Koziol and O. Forsén, Carbon, 2016, 107, 281–287 CrossRef CAS
.
- S. Arai, T. Osaki, M. Hirota and M. Uejima, Mater. Today Commun., 2016, 7, 101–107 CrossRef CAS
.
- S. Arai and T. Osaki, J. Electrochem. Soc., 2015, 162, D68–D73 CrossRef CAS
.
- M. Burda, A. Lekawa-Raus, A. Gruszczyk and K. K. K. Koziol, ACS Nano, 2015, 9, 8099–8107 CrossRef CAS PubMed
.
- L. Wang, Y. Cui, B. Li, S. Yang, R. Li, Z. Liu, R. Vajtai and W. Fei, RSC Adv., 2015, 5, 51193–51200 RSC
.
- K. Jagannadham, J. Appl. Phys., 2011, 110, 074901 CrossRef
.
- D.-B. Xiong, M. Cao, Q. Guo, Z. Tan, G. Fan, Z. Li and D. Zhang, ACS Nano, 2015, 9, 6934–6943 CrossRef CAS PubMed
.
- M. Park, B.-H. Kim, S. Kim, D.-S. Han, G. Kim and K.-R. Lee, Carbon, 2011, 49, 811–818 CrossRef CAS
.
- G.-x. Wu, Q.-y. Meng and C.-y. Wang, Phys. E, 2011, 44, 146–151 CrossRef CAS
.
- M. Ghorbani-Asl, P. D. Bristowe and K. Koziol, Phys. Chem. Chem. Phys., 2015, 17, 18273–18277 RSC
.
- G. Xuan, Z. Jie, W. S. Zhao and W. Gaofeng, Electrical modeling of on-chip copper-carbon nanotube composite interconnects, 2016 Asia-Pacific International Symposium on Electromagnetic Compatibility (APEMC), 2016, DOI:10.1109/APEMC.2016.7523017.
- P. Sadowski, K. Kowalczyk-Gajewska and S. Stupkiewicz, Composites, Part B, 2015, 80, 278–290 CrossRef CAS
.
- F. Gao, J. Qu and M. Yao, Appl. Phys. Lett., 2010, 96, 102108 CrossRef
.
- M. Rao, Electrical modeling of copper/carbon nanotubes for 3D integration, 2016 IEEE 16th International Conference on Nanotechnology (IEEE-NANO), 2016, DOI:10.1109/NANO.2016.7751327.
- A. Lekawa-Raus, T. Gizewski, J. Patmore, L. Kurzepa and K. K. Koziol, Scr. Mater., 2017, 131, 112–118 CrossRef CAS
.
- A. Lekawa-Raus, J. Patmore, L. Kurzepa, J. Bulmer and K. Koziol, Adv. Funct. Mater., 2014, 24, 3661–3682 CrossRef CAS
.
- D. Janas, A. C. Vilatela and K. K. K. Koziol, Carbon, 2013, 62, 438–446 CrossRef CAS
.
- D. Janas, A. Cabrero-Vilatela, J. Bulmer, L. Kurzepa and K. K. Koziol, Carbon, 2013, 64, 305–314 CrossRef CAS
.
- N. Khandoker, S. C. Hawkins, R. Ibrahim, C. P. Huynh and F. Deng, Procedia Eng., 2011, 10, 2572–2578 CrossRef CAS
.
| This journal is © the Partner Organisations 2018 |


