A meta-diisocyanide benzene-based aryl gold isocyanide complex exhibiting multiple solid-state molecular arrangements and luminescent mechanochromism†
Tomohiro
Seki
 *,
Kentaro
Ida
and
Hajime
Ito
 *
*
Division of Applied Chemistry & Frontier Chemistry Center, Faculty of Engineering, Hokkaido University, Sapporo, Hokkaido 060-8628, Japan. E-mail: seki@eng.hokudai.ac.jp; hajito@eng.hokudai.ac.jp
First published on 24th April 2018
Abstract
Functional organic solids with switchable photoluminescence properties in response to external stimulation have attracted much interest because of their potential applications in sensors and imaging devices. Among these organic solids, luminescent mechanochromic compounds are emerging materials that can switch their photoluminescence properties when mechanically perturbed. Our group has intensively studied the solid-state emission properties and luminescent mechanochromism of a series of aryl gold isocyanide complexes. Here, we prepared bent-shaped binuclear gold isocyanide complex 2, which exhibits different pseudopolymorphs with different emission properties when prepared using different crystallization procedures. X-ray diffraction measurements and NMR spectroscopy indentified inclusion of solvent molecules in the crystalline lattices of 2 except for one polymorph. Complex 2 also shows luminescent mechanochromism based on a crystalline-to-amorphous phase transition. The ground phases of all of the pseudopolymorphs revert to the polymorph without solvent molecules upon thermal treatment.
Introduction
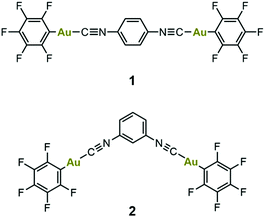
Solid-state organic materials with tunable photoluminescence properties upon applying external stimulation have received recent attention owing to their potential applications in sensing and recording devices.1 In these materials, the change of the emission properties by applying an external stimulus usually relies on a change in the assembly state of the chromophores in the bulk. This enables a change in the intermolecular interaction pattern, which often affects the electronic state of the material.2 Incorporation of small molecules or solvent molecules is also effective to realize a new solid state of chromophores that differs from its exclusive assemblies.3 In this case, release of small molecules or solvent molecules from the bulk in response to external stimulation is the key for tuning the emission properties.3c–eAmong the tunable emissive materials, luminescent mechanochromic compounds, which show an emission color change by mechanical stimulation, are an emerging class of functional materials.4 In 2008, our group reported the first example of reversible luminescent mechanochromism for the aryl binuclear gold isocyanide complex 1 (Fig. 1).5 This complex shows an emission color change from blue to yellow in response to mechanical perturbation, and the original blue-emitting phase is recovered upon addition of dichloromethane (DCM) to the yellow-emitting ground powder. Besides the blue-emitting crystalline and yellow-emitting amorphous phases of 1, no other solid states or solvent inclusion solids have been identified.6 Various organic and organometallic compounds with luminescent mechanochromic properties have subsequently been reported.7 Our group also reported related gold isocyanide complexes that show intriguing luminescent mechanochromism8 and related stimuli-responsivity.3c,9
Here, we reported complex 2 (Fig. 1), the meta-substituted analogue of 1. X-ray diffraction (XRD) measurements revealed that complex 2 forms multiple molecular arrangements containing solvent molecules depending on the crystallization procedure. Emission spectroscopy indicates that the various solid structures of 2 show distinct emission properties under ultraviolet (UV) light. All of the solid-state structures of 2 exhibit prominent luminescent mechanochromism based on crystalline-to-amorphous phase transitions. The resulting ground powder shows a reverse phase transition upon thermal treatment to give one polymorph of 2 with emission color changes.
Results and discussion
Formation of pseudopolymorphic single crystals
We prepared compound 2 by the procedure reported for preparation of the para-substituted analogue 1.5 The compound was characterized by 1H NMR and high-resolution mass spectroscopy (see the ESI†). Recrystallization of complex 2 from ethyl acetate (EA) and tetrahydrofuran (THF) gave three types of crystals with different shapes and emission spectra. When a solution of 2 in EA on an open Petri dish was evaporated for a week at 4 °C, block-shaped crystals of 2a were obtained (Fig. 2, left). A solution of 2 in THF gave two different single crystals: evaporation of the solution for 7 days at 4 °C gave needle-shaped crystals (2b, Fig. 2, left) and evaporation at 80 °C for 15 min gave rectangular crystals (2c, Fig. 2, left). Although 2a–2c show green emission under UV illumination (Fig. 2, left), their emission spectra recorded under UV light are slightly different (Fig. 2, right). All of the emission spectra are broad and the emission peaks are located at 488 (2a), 495 (2b), and 519 nm (2c). A dilute solution of 2 in DCM has an emission spectrum with a peak at 414 nm (Fig. S1, ESI†), indicating that the intermolecular interactions are important for the emission properties of the solid states. Expression of different emission properties of the solid states of a single compound indicates the formation of distinct crystalline structures.10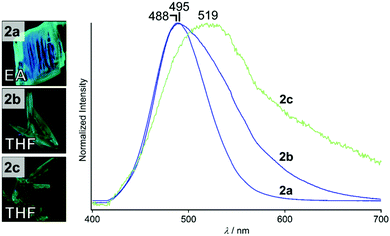 | ||
| Fig. 2 Photographs (taken under UV light) and emission spectra (excitation at 365 nm) of 2a, 2b, and 2c. | ||
To obtain structural information about 2a–2c, single-crystal XRD measurements were performed. 2a–2c were of sufficient quality for single-crystal XRD, and the crystallographic parameters are given in Table 1 and Table S1 (ESI†). As expected, the crystal structures of 2a–2c are different even though 2b and 2c were crystallized using the same solvent (THF). Remarkably, these single crystals contain solvent molecules used for recrystallization, suggesting that 2a–2c are pseudopolymorphs of 2. The single crystal of 2a contains 2.5 equiv. EA, whereas 2b and 2c contain 2 and 1 equiv. THF, respectively (Table 1 and Table S1, ESI†).
| 2a | 2b | 2c | |
|---|---|---|---|
| a For data with I > 2.00σ(I). b For all reflection data. c Goodness of fit indicator. | |||
| CCDC number | 1820938 | 1820947 | 1822803 |
| Crystal system | Triclinic | Monoclinic | Triclinic |
| Space group |
P![[1 with combining macron]](https://www.rsc.org/images/entities/char_0031_0304.gif) (#2) (#2) |
P21/n (#14) |
P![[1 with combining macron]](https://www.rsc.org/images/entities/char_0031_0304.gif) (#2) (#2) |
| Inclusion (equiv.) | EA (2.5) | THF (2.0) | THF (1.0) |
| a/Å | 10.5053(14) | 8.4401(7) | 10.5280(9) |
| b/Å | 11.0003(18) | 17.3470(13) | 11.5191(11) |
| c/Å | 14.675(2) | 19.5954(15) | 11.8538(11) |
| α/° | 79.575(5) | 90 | 70.006(2) |
| β/° | 87.376(4) | 98.181(2) | 70.754(2) |
| γ/° | 86.965(5) | 90 | 67.223(3) |
| V/Å3 | 1664.4(4) | 2839.8(4) | 1212.85(19) |
| Z value | 2 | 4 | 2 |
| D calc/g cm−3 | 2.148 | 2.340 | 2.542 |
| R 1 | 0.0757 | 0.0623 | 0.0689 |
| wR2b | 0.2389 | 0.1544 | 0.2219 |
| GOFc | 1.039 | 0.990 | 0.979 |
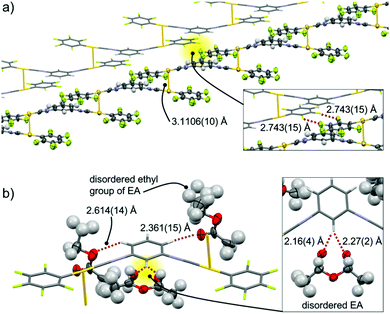
2a has the triclinic P![[1 with combining macron]](https://www.rsc.org/images/entities/char_0031_0304.gif) space group and includes EA molecules (Fig. 3 and Fig. S2, ESI†).11 The complex in 2a adopts a flat conformation, with dihedral angles θ between the C6F5– rings and –C6H4– rings of 2.0(6)° and 4.0(6)° (Fig. S2b, ESI†). The two short intermolecular distances between Au atoms of 3.1106(10) Å indicate formation of aurophilic interactions4a,12 with two neighboring molecules, which leads to formation of open-ended zigzag oligomeric chains (see the ORTEP representation in Fig. 3a). This zigzag chain interacts with a neighboring chain via double F⋯F interactions with F⋯F distances of 2.743(15) Å (inset in Fig. 3a). The resulting two-fold zigzag chain (Fig. 3a) is isolated from the neighboring two-fold zigzag chains because a lot of EA molecules ([EA]/[2] = 2.5) are located between them. All of the 2 molecules in the zigzag chains are surrounded by three EA molecules through the formation of multiple C–H⋯O interactions between the hydrogen atoms of isocyanide benzene and the oxygen atoms of EA with distances ranging from 2.1 to 2.7 Å (red dotted lines in Fig. 3b). It should be noted that careful inspection indicates that there are no π–π stacking interactions of aromatic units within the zigzag chains.
space group and includes EA molecules (Fig. 3 and Fig. S2, ESI†).11 The complex in 2a adopts a flat conformation, with dihedral angles θ between the C6F5– rings and –C6H4– rings of 2.0(6)° and 4.0(6)° (Fig. S2b, ESI†). The two short intermolecular distances between Au atoms of 3.1106(10) Å indicate formation of aurophilic interactions4a,12 with two neighboring molecules, which leads to formation of open-ended zigzag oligomeric chains (see the ORTEP representation in Fig. 3a). This zigzag chain interacts with a neighboring chain via double F⋯F interactions with F⋯F distances of 2.743(15) Å (inset in Fig. 3a). The resulting two-fold zigzag chain (Fig. 3a) is isolated from the neighboring two-fold zigzag chains because a lot of EA molecules ([EA]/[2] = 2.5) are located between them. All of the 2 molecules in the zigzag chains are surrounded by three EA molecules through the formation of multiple C–H⋯O interactions between the hydrogen atoms of isocyanide benzene and the oxygen atoms of EA with distances ranging from 2.1 to 2.7 Å (red dotted lines in Fig. 3b). It should be noted that careful inspection indicates that there are no π–π stacking interactions of aromatic units within the zigzag chains.
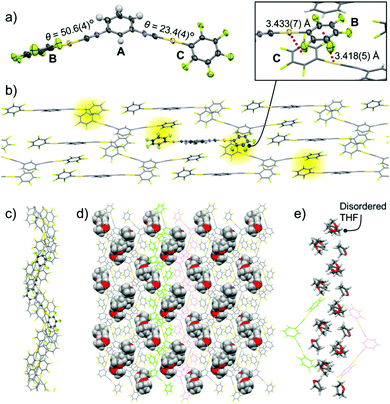
Single-crystal structure analysis of 2b indicates that it has the monoclinic P21/n space group and includes THF molecules (Fig. 4 and Fig. S3, ESI†). The 2 molecule has three aromatic rings: a meta-disubstituted C6H4 ring (ring A) and two C6F5 rings (rings B and C, Fig. 4a). The two dihedral angles are very different: 50.6(4)° (between rings A and B) and 23.4(4)° (between rings A and C), as shown in Fig. 4a. The B and C rings of the molecules form double Au–π interactions with the C and B rings of two neighboring molecules, respectively (highlighted in yellow in Fig. 4b). This gives an oligomeric zigzag chain (Fig. 4b). The zigzag chains are stacked through the formation of π–π stacking interactions between ring A of one molecule and ring B of a neighboring molecule (Fig. S3b, ESI†).13 As a result, an extended zigzag wall forms. The side and top views of the zigzag wall are shown in Fig. 4b and c, respectively. In this wall, the shortest distance between gold atoms is 3.7928(3) Å (Fig. S3c, ESI†), indicating that there are no aurophilic interactions. The included THF molecules (space-filling representation in Fig. 4d) are located between the zigzag walls (the neighboring zigzag walls are colored green and magenta in Fig. 4d). The THF molecules form a one-dimensional (1D) channel through formation of several intermolecular interactions (Fig. 4e and Fig. S3d, ESI†).
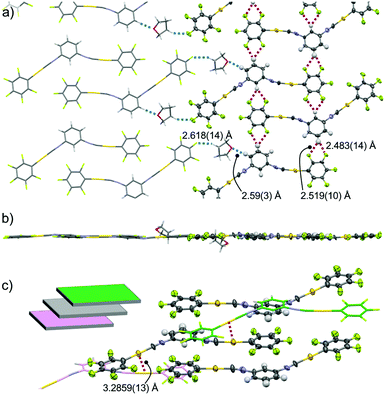
Single-crystal XRD measurements of 2c show that it has the triclinic P![[1 with combining macron]](https://www.rsc.org/images/entities/char_0031_0304.gif) space group and includes 1 equiv. THF molecules (Fig. 5 and Fig. S4, ESI†). In this crystal structure, the 2 molecules have a flat conformation with θ = 0.1(9)° and 4.4(9)° (Fig. S4b, ESI†). These flat molecules form straight ribbon-like arrays of C6F5–Au–CN–C6H4– segments (see the ORTEP representation in Fig. 5a) through extended (CF)2⋯H–C interactions with distances of 2.483(14) and 2.519(10) Å (red dotted lines in Fig. 5a). The straight ribbons have –NC–Au–C6F5 pendant segments at their periphery. THF molecules are located between these –NC–Au–C6F5 pendants and form O⋯H–C (distance 2.59(3) Å) and C–H⋯F–C interactions (distance 2.618(14) Å) with complex 2 (blue dotted lines in Fig. 5a). Thus, these THF molecules act as a glue to assist the ribbon–ribbon interactions within the flat sheets (Fig. 5a and b). Above and below each sheet, adjacent sheets (colored green and magenta, respectively, in the inset of Fig. 5c and in Fig. S4, ESI†) are stacked with longitudinal offset. The 2 molecules in the middle sheet form two-fold aurophilic interactions (Au⋯Au distance 3.2859(13) Å) with the two neighboring complex molecules in the two adjacent sheets (Fig. 5c). Careful inspection indicates that there are no typical aromatic interactions (π–π and CH–π interactions) between the walls.
space group and includes 1 equiv. THF molecules (Fig. 5 and Fig. S4, ESI†). In this crystal structure, the 2 molecules have a flat conformation with θ = 0.1(9)° and 4.4(9)° (Fig. S4b, ESI†). These flat molecules form straight ribbon-like arrays of C6F5–Au–CN–C6H4– segments (see the ORTEP representation in Fig. 5a) through extended (CF)2⋯H–C interactions with distances of 2.483(14) and 2.519(10) Å (red dotted lines in Fig. 5a). The straight ribbons have –NC–Au–C6F5 pendant segments at their periphery. THF molecules are located between these –NC–Au–C6F5 pendants and form O⋯H–C (distance 2.59(3) Å) and C–H⋯F–C interactions (distance 2.618(14) Å) with complex 2 (blue dotted lines in Fig. 5a). Thus, these THF molecules act as a glue to assist the ribbon–ribbon interactions within the flat sheets (Fig. 5a and b). Above and below each sheet, adjacent sheets (colored green and magenta, respectively, in the inset of Fig. 5c and in Fig. S4, ESI†) are stacked with longitudinal offset. The 2 molecules in the middle sheet form two-fold aurophilic interactions (Au⋯Au distance 3.2859(13) Å) with the two neighboring complex molecules in the two adjacent sheets (Fig. 5c). Careful inspection indicates that there are no typical aromatic interactions (π–π and CH–π interactions) between the walls.
The results of crystal structure analysis of pseudopolymorphs 2a–2c (solvent-included crystals) indicate the ability of 2 to form inclusion compounds and various molecular arrangements. This is in contrast to the previously reported para-substituted analogue 1,5 in which no solvent inclusion is observed. In addition, rapid evaporation procedures give other crystalline phases of 2 that differ from 2a–2c, which will be discussed in the next section.
Crystalline phases with different emission properties
The crystallization process and the solvent could affect the crystalline structures and emission properties of 2. Simple evaporation of suspensions/solutions of 2 in various solvents also gave solid samples that show different emission properties from those of 2a–2c. For example, rotary evaporation of a suspension of 2 in MeOH gave semicrystalline sample 2d, which shows blue photoluminescence (Fig. 6, left). When the same procedure was used for homogeneous solutions of 2 in Et2O, EA, and THF (see the ESI† for the details), three distinct powdered crystalline samples of 2 were obtained, which are called 2e, 2f, and 2g, respectively (Fig. 6, left).14 The emission lifetime measurements of 2d–2g indicate that their average emission lifetimes are in the range of 0.8–5.0 μs, indicating phosphorescence (Fig. S6 and Table S2, ESI†). These semicrystalline powders all show greenish emission under UV light (Fig. 6). The four crystalline samples 2d–2g exhibit similar broad photoluminescence spectra (Fig. 6, right). However, their maximum emission wavelengths range from 492 to 517 nm and the emission peaks are slightly different (inset in Fig. 6). This indicates that these crystalline samples may have distinct crystal structures.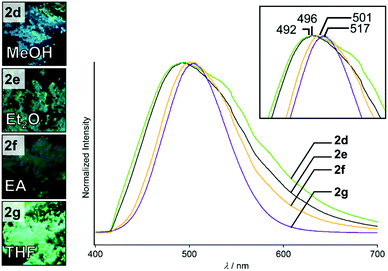 | ||
| Fig. 6 Photographs of 2d–2g taken under UV illumination. Emission spectra of 2d–2g recorded under excitation at 365 nm. | ||
Powder XRD analysis of 2d–2g indicates that 2a–2g are crystalline phases with different molecular arrangements. Repeated attempts to prepare single crystals of 2d–2g failed, and thus powder XRD analysis was performed. Fig. 7 shows the experimentally obtained powder XRD patterns of 2d–2g, which all exhibit intense diffraction peaks. Importantly, their peak positions and diffraction profiles are clearly different (Fig. 7). The diffraction patterns of 2d–2g are also completely different from the simulated powder patterns of 2a–2c derived from their single-crystal structures (Fig. 7). This indicates that the molecular arrangements of the seven crystalline samples 2a–2g are different. This is in agreement with emission spectroscopy of 2a–2g (Fig. S7, ESI†), where the emission spectra have different emission maxima. After drying under vacuum for ∼2 h, we measured the NMR spectra of 2d–2f in acetone-d6 (Fig. S8, ESI†). The NMR spectra of 2e, 2f, and 2g exhibit the proton signals of the solvent molecules used for crystallization (Et2O, EA, and THF, respectively). These results indicate that the solvent molecules used for preparation are included inside the crystalline lattices of 2e–2f, similar to 2a–2c. In contrast, the proton signals of any solvent are not present in the NMR spectrum of 2d (Fig. S8, ESI†), indicating that there is no inclusion of the solvent.15
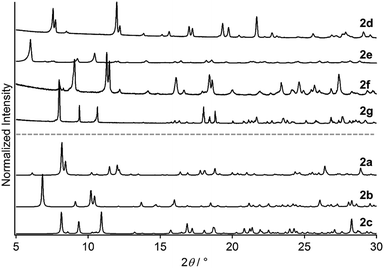 | ||
| Fig. 7 Experimentally obtained powder XRD patterns of 2d–2g. Simulated powder XRD patterns of 2a–2c derived from their single-crystal structures. | ||
Luminescent mechanochromism
Upon grinding the seven solid states 2a–2g, prominent luminescent mechanochromism with red-shifted emission is observed. For example, the blue emission of 2d transformed to bright green emission upon mechanical stimulation on a glass plate (inset in Fig. 8a). The resulting powder sample 2ground shows a broad emission spectrum with a peak at 540 nm (Fig. 8a), which red-shifted by 48 nm upon grinding. The powder XRD pattern of 2ground shows a featureless profile after mechanical stimulation (Fig. 8b). Moreover, NMR spectroscopy and thermogravimetric analysis (TGA) confirm that no solvent molecules exist in 2ground (Fig. S10 and S11, ESI†). These results indicate that the crystalline-to-amorphous phase transition8c,d is the underlying mechanism for the luminescent mechanochromism of 2. The ground powders obtained by grinding the other solid samples (i.e., 2a–2c and 2e–2g) show emission spectra similar to that of 2ground obtained from 2d (Fig. S12, ESI†). This indicates that all of the ground samples are the same irrespective of the solid phase of the unground form before mechanical stimulation.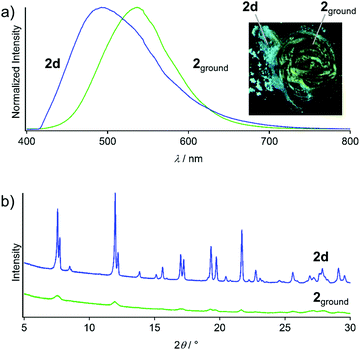 | ||
| Fig. 8 (a) Emission spectra and photographs (under UV light, inset) of 2d and 2ground. (b) Powder XRD patterns of 2d and 2ground. | ||
Upon heating the 2ground sample, a thermal phase transition occurs to give 2d (the solvent-free polymorph obtained by crystallization with MeOH). When 2ground was heated on a glass plate under air, a gradual emission color change occurred at around 120 °C, and the emission color did not change upon cooling to room temperature (Fig. S13, ESI†). The resulting powder sample has a similar emission spectrum to 2d (Fig. S13, ESI†). The powder XRD pattern of the heated sample contains intense peaks (Fig. S13, ESI†), indicating recovery of the crystallinity upon increasing the temperature. This heated sample again shows luminescent mechanochromism in response to mechanical stimulation to give 2ground with intense green emission (Fig. S13, ESI†). This result shows the reversibility of the phase transitions of 2 through mechanical stimulation and temperature control.
Conclusions
We have reported the formation of multiple molecular arrangements of bent gold complex 2 that show various emission colors. Complex 2 can form various solid structures through specific crystallization procedures. For example, recrystallization of 2 from EA and THF gives three distinct single crystals 2a–2c, which contain crystallized solvent. In addition to slow crystallization which gives 2a–2c, rapid evaporation of solutions/suspensions of 2 in MeOH, Et2O, EA, and THF gives 2d–2g. Powder XRD analysis indicates that 2a–2g all have different crystal structures and emission properties. Clear emission color changes are observed when 2a–2g are mechanically stimulated. Upon heating the ground powders of all of the structures, the structure reverts to solvent-free 2d, demonstrating the reversibility of the phase transition of 2. Formation of multiple pseudopolymorphs of 2 is in contrast to 1. This may originate from the bent molecular structure of 2, which is ideal for creating room for solvent molecule inclusion upon packing. This results in the formation of multiple molecular arrangements depending on the solvent. The insight obtained in this study can be used for preparation of solid materials that include small molecules or solvent molecules.Conflicts of interest
There are no conflicts to declare.Acknowledgements
This work was financially supported by the Japanese Ministry of Education, Culture, Sports, Science and Technology (MEXT) via the “Program for Leading Graduate Schools”, and by JSPS KAKENHI grants JP15H03804, JP16H06034, JP17H05134, JP17H05344, and JP17H06370. We thank Edanz Group (http://www.edanzediting.com/ac) for editing a draft of this manuscript.Notes and references
- (a) O. S. Wenger, Chem. Rev., 2013, 113, 3686–3733 CrossRef CAS PubMed; (b) C. Jobbágy and A. Deák, Eur. J. Inorg. Chem., 2014, 4434–4449 CrossRef; (c) D. Yan and D. G. Evans, Mater. Horiz., 2014, 1, 46–57 RSC.
- (a) M. Shimizu and T. Hiyama, Chem. – Asian J., 2010, 5, 1516–1531 CrossRef CAS PubMed; (b) J. Gierschner and S. Y. Park, J. Mater. Chem. C, 2013, 1, 5818–5832 RSC; (c) S. Varughese, J. Mater. Chem. C, 2014, 2, 3499–3516 RSC.
- (a) D. Rios, D. M. Pham, J. C. Fettinger, M. M. Olmstead and A. L. Balch, Inorg. Chem., 2008, 47, 3442–3451 CrossRef CAS PubMed; (b) Y. Sagara and T. Kato, Angew. Chem., Int. Ed., 2011, 50, 9128–9132 CrossRef CAS PubMed; (c) T. Seki, T. Ozaki, T. Okura, K. Asakura, A. Sakon, H. Uekusa and H. Ito, Chem. Sci., 2015, 6, 2187–2195 RSC; (d) T. Seki, M. Jin and H. Ito, Inorg. Chem., 2016, 55, 12309–12320 CrossRef CAS PubMed; (e) S. Hatanaka, T. Ono and Y. Hisaeda, Chem. Eur. J., 2016, 22, 10346–10350 CrossRef CAS PubMed.
- (a) A. L. Balch, Angew. Chem., Int. Ed., 2009, 48, 2641–2644 CrossRef CAS PubMed; (b) Y. Sagara, S. Yamane, M. Mitani, C. Weder and T. Kato, Adv. Mater., 2016, 28, 1073–1095 CrossRef CAS PubMed; (c) T. Seki and H. Ito, Chem. Eur. J., 2016, 22, 4322–4329 CrossRef CAS PubMed.
- H. Ito, T. Saito, N. Oshima, N. Kitamura, S. Ishizaka, Y. Hinatsu, M. Wakeshima, M. Kato, K. Tsuge and M. Sawamura, J. Am. Chem. Soc., 2008, 130, 10044–10045 CrossRef CAS PubMed.
- We first reported the pentafluorophenyl-based gold isocyanide complex showing luminescent mechanochromism as shown in ref. 5. Recently, many other complexes with related structures showing solid state emissive properties are actively reported: (a) Z. Chen, J. Zhang, M. Song, J. Yin, G. A. Yu and S. H. Liu, Chem. Commun., 2015, 51, 326–329 RSC; (b) J. Liang, Z. Chen, L. Xu, J. Wang, J. Yin, G.-A. Yu, Z.-N. Chen and S. H. Liu, J. Mater. Chem. C, 2014, 2, 2243–2250 RSC.
- (a) T. Tsukuda, M. Kawase, A. Dairiki, K. Matsumoto and T. Tsubomura, Chem. Commun., 2010, 46, 1905–1907 RSC; (b) H. Tsuji, G. M. O. Favier, C. Mitsui, S. Lee, D. Hashizume and E. Nakamura, Chem. Lett., 2011, 40, 576–578 CrossRef CAS; (c) K. Nagura, S. Saito, H. Yusa, H. Yamawaki, H. Fujihisa, H. Sato, Y. Shimoikeda and S. Yamaguchi, J. Am. Chem. Soc., 2013, 135, 10322–10325 CrossRef CAS PubMed; (d) Y. Sagara, T. Komatsu, T. Ueno, K. Hanaoka, T. Kato and T. Nagano, J. Am. Chem. Soc., 2014, 136, 4273–4280 CrossRef CAS PubMed; (e) S. Yagai, S. Okamura, Y. Nakano, M. Yamauchi, K. Kishikawa, T. Karatsu, A. Kitamura, A. Ueno, D. Kuzuhara, H. Yamada, T. Seki and H. Ito, Nat. Commun., 2014, 5, 4013 CAS; (f) E. Nagata, S. Takeuchi, T. Nakanishi, Y. Hasegawa, Y. Mawatari and H. Nakano, ChemPhysChem, 2015, 16, 3038–3043 CrossRef CAS PubMed; (g) R. Yoshii, K. Suenaga, K. Tanaka and Y. Chujo, Chem. – Eur. J., 2015, 21, 7231–7237 CrossRef CAS PubMed; (h) S. Ito, T. Taguchi, T. Yamada, T. Ubukata, Y. Yamaguchi and M. Asami, RSC Adv., 2017, 7, 16953–16962 RSC; (i) T. Tsukamoto, R. Aoki, R. Sakamoto, R. Toyoda, M. Shimada, Y. Hattori, Y. Kitagawa, E. Nishibori, M. Nakano and H. Nishihara, Chem. Commun., 2017, 53, 9805–9808 RSC.
- (a) H. Ito, M. Muromoto, S. Kurenuma, S. Ishizaka, N. Kitamura, H. Sato and T. Seki, Nat. Commun., 2013, 4, 2009 Search PubMed; (b) T. Seki, K. Sakurada and H. Ito, Angew. Chem., Int. Ed., 2013, 52, 12828–12832 CrossRef CAS PubMed; (c) T. Seki, Y. Takamatsu and H. Ito, J. Am. Chem. Soc., 2016, 138, 6252–6260 CrossRef CAS PubMed; (d) T. Seki, N. Tokodai, S. Omagari, T. Nakanishi, Y. Hasegawa, T. Iwasa, T. Taketsugu and H. Ito, J. Am. Chem. Soc., 2017, 139, 6514–6517 CrossRef CAS PubMed; (e) M. Jin, T. Seki and H. Ito, J. Am. Chem. Soc., 2017, 139, 7452–7455 CrossRef CAS PubMed; (f) T. Seki, K. Kobayashi and H. Ito, Chem. Commun., 2017, 53, 6700–6703 RSC.
- T. Seki, K. Sakurada, M. Muromoto and H. Ito, Chem. Sci., 2015, 6, 1491–1497 RSC.
- (a) Z. Lin, X. Mei, E. Yang, X. Li, H. Yao, G. Wen, C.-T. Chien, T. J. Chow and Q. Ling, CrystEngComm, 2014, 16, 11018–11026 RSC; (b) R. H. Li, S. Z. Xiao, Y. Li, Q. F. Lin, R. H. Zhang, J. Zhao, C. Y. Yang, K. Zou, D. S. Li and T. Yi, Chem. Sci., 2014, 5, 3922–3928 RSC; (c) Z. He, L. Zhang, J. Mei, T. Zhang, J. W. Y. Lam, Z. Shuai, Y. Q. Dong and B. Z. Tang, Chem. Mater., 2015, 27, 6601–6607 CrossRef CAS.
- 2a shows an emission color change when it is left under ambient conditions (Fig. S8a, ESI†). Therefore, the 2a crystals are derived from the solution of 2 in EA just before the various measurements (i.e., XRD and spectroscopic measurements).
- (a) A. L. Balch, Gold Bull., 2004, 37, 45–50 CrossRef CAS; (b) P. Pyykkö, Angew. Chem., Int. Ed., 2004, 43, 4412–4456 CrossRef PubMed; (c) V. W. Yam and E. C. Cheng, Chem. Soc. Rev., 2008, 37, 1806–1813 RSC; (d) M. J. Katz, K. Sakai and D. B. Leznoff, Chem. Soc. Rev., 2008, 37, 1884–1895 RSC; (e) H. Schmidbaur and A. Schier, Chem. Soc. Rev., 2008, 37, 1931–1951 RSC; (f) X. He and V. W.-W. Yam, Coord. Chem. Rev., 2011, 255, 2111–2123 CrossRef CAS; (g) H. Schmidbaur and A. Schier, Chem. Soc. Rev., 2012, 41, 370–412 RSC.
- The distance between the centroids of the two planes is 3.665(7) Å.
- Evaporation of a solution of 2 in DCM gave a yellow-emitting crystalline powder (Fig. S5, ESI†). From the powder XRD pattern with a rather broad profile (data not shown), this yellow-emitting phase may be a mixture of various molecular arrangements. We confirmed luminescent mechanochromism of this yellow-emitting powder (Fig. S5, ESI†).
- TGA of 2d also supports that there is no solvent inclusion (Fig. S9, ESI†).
Footnote |
| † Electronic supplementary information (ESI) available: Data from additional spectroscopic, crystallographic, and thermal analyses. CCDC 1820938, 1820947 and 1822803. For ESI and crystallographic data in CIF or other electronic format see DOI: 10.1039/c8qm00074c |
| This journal is © the Partner Organisations 2018 |

