 Open Access Article
Creative Commons Attribution 3.0 Unported Licence
Magnetic CoFe2O4 nanoparticles supported on graphene oxide (CoFe2O4/GO) with high catalytic activity for peroxymonosulfate activation and degradation of rhodamine B
Rida
Tabit
a,
Othmane
Amadine
b,
Younes
Essamlali
b,
Karim
Dânoun
b,
Abdallah
Rhihil
a and
Mohamed
Zahouily
 *ab
*ab
aLaboratoire de Matériaux, Catalyse & Valorisation des Ressources Naturelles, URAC 24, Faculté des Sciences et Techniques, Université Hassan II, Casablanca B.P. 146, 20650, Morocco. E-mail: m.zahouily@mascir.com; Tel: +212 661416359
bMAScIR Foundation, VARENA Center, Rabat Design, Rue Mohamed El Jazouli, Madinat Al Irfane 10100 Rabat, Morocco
First published on 3rd January 2018
Abstract
Herein, we report the preparation of magnetic CoFe2O4 nanoparticles and CoFe2O4/graphene oxide (GO) hybrids and evaluate their catalytic activity as heterogeneous peroxymonosulfate (PMS) activators for the decomposition of rhodamine B. The surface morphologies and structures of both CoFe2O4 nanoparticles and CoFe2O4/GO hybrids were investigated by powder X-ray diffraction (XRD), scanning electron microscopy (SEM), energy-dispersive X-ray spectroscopy (EDS), Fourier transform infrared spectroscopy (FTIR) and nitrogen adsorption–desorption isotherms. The magnetic properties of the samples were assessed using a SQUID magnetometer at 298 K. Catalytic oxidation experiments demonstrated that CoFe2O4/GO hybrids exhibited much better catalytic activity than CoFe2O4 nanoparticles or CoFe2O4/reduced graphene oxide (rGO) hybrids, suggesting that GO plays an important role in CoFe2O4/GO hybrids in the decomposition of rhodamine B. The influence of various reaction conditions such as temperature, concentration of PMS, pH and decomposition time of rhodamine B over the CoFe2O4/GO catalyst were investigated and optimized. The rhodamine B degradation process was found to fit a pseudo-first order kinetics model. The catalyst could be easily separated from the reaction mixture by applying an external magnet. In particular, the as-prepared CoFe2O4/GO hybrid exhibited good reusability and stability in successive degradation experiments in PMS solution.
1. Introduction
The dye industry discharges large amounts of industrial wastewater and hence, it is one of the major sources of organic pollutants. Nowadays, there are more than 100![[thin space (1/6-em)]](https://www.rsc.org/images/entities/char_2009.gif) 000 dyes belonging to various chemical classes with an annual production of 7.105 tons.1 It is estimated that 10–15% of initial quantities are lost during dyeing procedures, which are discharged without prior treatment to the effluent; this contaminates groundwater and is toxic to humans and animals. Most of these compounds are chemically stable and have a complicated constitution, which makes them resistant to photo- and biological degradation. The Rhodamine (RhB) dye is one of fresh peach of synthetic dyes that is widely used as a colorant in the manufacturing of textiles and foodstuffs. It has been medically proven that rhodamine dye is harmful and toxic to humans and animals, and causes irritation of the skin, eyes and respiratory tract.2 Due to its high toxicity and negative effects on public health, various physical, chemical and biological approaches have been extensively explored and investigated for the removal of organic dyes from wastewater including adsorption, coagulation, biological degradation and filtration processes as well as chemical oxidation by hydro chlorite and Fenton methods.3 However, these methods suffer from different drawbacks that are primarily associated with the cost-intensive production of oxidants, instability during long reaction times, short lifetime and pH adjustments.
000 dyes belonging to various chemical classes with an annual production of 7.105 tons.1 It is estimated that 10–15% of initial quantities are lost during dyeing procedures, which are discharged without prior treatment to the effluent; this contaminates groundwater and is toxic to humans and animals. Most of these compounds are chemically stable and have a complicated constitution, which makes them resistant to photo- and biological degradation. The Rhodamine (RhB) dye is one of fresh peach of synthetic dyes that is widely used as a colorant in the manufacturing of textiles and foodstuffs. It has been medically proven that rhodamine dye is harmful and toxic to humans and animals, and causes irritation of the skin, eyes and respiratory tract.2 Due to its high toxicity and negative effects on public health, various physical, chemical and biological approaches have been extensively explored and investigated for the removal of organic dyes from wastewater including adsorption, coagulation, biological degradation and filtration processes as well as chemical oxidation by hydro chlorite and Fenton methods.3 However, these methods suffer from different drawbacks that are primarily associated with the cost-intensive production of oxidants, instability during long reaction times, short lifetime and pH adjustments.
In recent years, sulfate radical-based oxidation processes have received much attention4 for its efficient degradation of organic contaminants. The sulfate radical (SO˙4−) generated from peroxymonosulfate, as an alternative to the hydroxyl radical (OH˙), is a strong oxidant with a high redox potential. It can react with many organic contaminants to yield a degradation performance similar to that expected for the hydroxyl radical (OH˙). The activation processes of PMS can be achieved using heat, ultraviolet irradiation, transition metals, or metal oxides,5–7 which are similar to the cases involving hydrogen peroxide. Recently, the Co2+ ion coupled with a PMS system for the degradation of organic contaminants has attracted tremendous interest since it exhibits better efficiencies than the Fenton reaction.8,9 Despite the advantages of this homogeneous activation process, the application of this method in water treatment is limited due to pollution caused by the high solubility and significant toxicity of transition metal ions and the complex recovery of metal ions from the reaction medium. One of the most favorable ways to overcome these drawbacks is through activation of PMS via heterogeneous systems,8–10 such as Co/activated carbon,11 Co/carbon aerogel,12 Co/carbon xerogels,13 Co3O4,14–16 Co-exchanged zeolites,17,18 Co/SBA-15,19–21Co/mesoporous MnO2,22 and Co/MCM-41.23 Among the various heterogeneous catalysts, magnetic cobalt ferrites (CoFe2O4), belonging to the family of spinel-type ferrites, have attracted extensive attention due to their large surface area, high catalytic activity, stable crystalline structure and particularly their easy separation from the reaction system by utilizing magnetic fields derived from their ferromagnetic properties.24–26 The cobalt ferrites prepared through conventional methods generally consist of highly agglomerated particles with low specific area, which reduces their catalytic performance.27 To solve this agglomeration problem, several synthetic routes have been developed. Among the developed approaches, dispersing agglomerated particles onto the various supports was found to be an effective method to enhance the catalytic activity of CoFe2O4.28,29 The enhancement of the catalytic activity of the CoFe2O4-supported catalyst was due to the synergic effect between CoFe2O4 and the support. The role of the support was not negligible in this case. Recently, immobilization of CoFe2O4 nanoparticles onto exfoliated graphite oxide has been the subject of intense research due to the excellent properties and functionalities of the resultant hybrid material as well as its wide spectrum of applications, which include catalysis, biomedicine and decontamination of waste water.30–33
In the present study, we report a facile approach for preparing magnetic CoFe2O4 nanoparticles, CoFe2O4/reduced graphene oxide (rGO) and CoFe2O4/graphene oxide (GO) and their catalytic performance toward activating PMS for the removal of rhodamine B. The physicochemical properties of all samples were characterized by various techniques, such as nitrogen adsorption–desorption, SEM, XRD and FTIR. The catalytic activities of all prepared samples were investigated in terms of the reaction kinetics, reaction temperature, concentration of RhB and catalytic stability.
2. Experimental
2.1. Materials
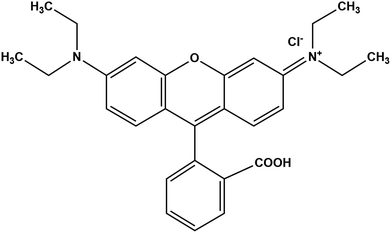
High purity rhodamine B (C28H31CIN2O), oxone (KHSO4·K2SO4·KHSO5), iron chloride hexahydrate (FeCl3·6H2O), cobalt chloride hexahydrate (CoCl2·6H2O), sodium hydroxide (NaOH), graphite, sodium nitrate (NaNO3), sulfuric acid H2SO4 (98% w/w), potassium permanganate KMnO4, hydrogen peroxide H2O2 (30% w/w) and C2H6O were purchased from Aldrich chemical company. All the reagents were used without further purification. Water used in all experiments was deionized. The molecular structure of rhodamine B is shown in Scheme 1.2.2. Preparation of GO and CoFe2O4/GO
Graphene oxide (GO) was prepared from natural graphite via the modified Hummers method.34 In the preparation of CoFe2O4–GO, 0.16 g of GO was first dispersed in water and sonicated for 30 min to produce a homogeneous brown dispersion of graphene oxide nanosheets. Separately, 2.7 g of FeCl3·6H2O and 1.19 g of CoCl2·6H2O were dissolved in 10 mL of distilled water under vigorous stirring. The bimetallic Fe–Co solution was then added to the GO dispersion and the resultant mixture was further stirred for 1 h. Then, 25 mL of an aqueous solution of NaOH (3 mol L−1) was added dropwise to the above dispersion under vigorously stirring. Later, the dispersion was heated in a sand bath for 1 h at 100 °C. Finally, the resultant precipitate was magnetically separated, washed with water and ethanol until the pH was neutral (pH = 7) and dried at 60 °C for 24 h. For comparison, CoFe2O4 NPs were also prepared according to the above procedure.2.3. Characterization
XRD measurements were recorded on a Bruker AXS D-8 diffractometer using Cu-Kα radiation in Bragg–Brentano geometry (θ–2θ). All samples were also characterized by Fourier-transform infrared spectroscopy in the range of 4000–400 cm−1 using an ABB Bomem FTLA 2000 spectrometer with 16 cm−1 resolution. SEM and STEM micrographs were obtained on a Tecnai G2 microscope at 120 kV. The elemental composition of the CoFe2O4/GO nanocomposite was confirmed from energy dispersive X-ray analysis (EDAX). The surface areas of the prepared materials were measured using the Brunauer–Emmett–Teller (BET) method on a 3Flex automatic analyzer. Prior to N2 sorption, all samples were degassed at 250 °C for 8 h. The magnetic properties of CoFe2O4 nanoparticles and CoFe2O4/GO nanocomposite were investigated in a MPMS-XL-7AC superconducting quantum interference device (SQUID) magnetometer. The magnetic measurements were performed from −15![[thin space (1/6-em)]](https://www.rsc.org/images/entities/char_2009.gif) 000 to 15
000 to 15![[thin space (1/6-em)]](https://www.rsc.org/images/entities/char_2009.gif) 000 Oe at room temperature. Total organic carbon (TOC) was determined by the Shimadzu TOC-L Series. Cobalt and iron within CoFe2O4/GO were determined by inductively coupled plasma atomic emission spectroscopy (ICP-AES) from Jab in Yvan and the carbon content was determined by a carbon/sulfur analyser (C.A) using HORIBA EMIA-320V2.
000 Oe at room temperature. Total organic carbon (TOC) was determined by the Shimadzu TOC-L Series. Cobalt and iron within CoFe2O4/GO were determined by inductively coupled plasma atomic emission spectroscopy (ICP-AES) from Jab in Yvan and the carbon content was determined by a carbon/sulfur analyser (C.A) using HORIBA EMIA-320V2.
2.4. Catalytic test procedure
The catalytic degradation of RhB by CoFe2O4 and CoFe2O4/GO catalysts with oxone was performed in a 50 mL beaker containing 50 mL of RhB solution at room temperature (25 °C). In a typical procedure, 0.005 g of oxone was first added to RhB solution under constant stirring. Then, 0.010 g of catalyst was added to start the reaction. At a given time interval, a predetermined amount (2.0 mL) of solution was withdrawn into a vial fitted with a micro-filter (45 μm) for solid catalyst removal. The concentrations of RhB were determined by monitoring the decrease in absorbance at the maximum wavelength (554 nm) with UV-vis spectroscopy.The degradation efficiency was calculated according to the following equation:
3. Results and discussion
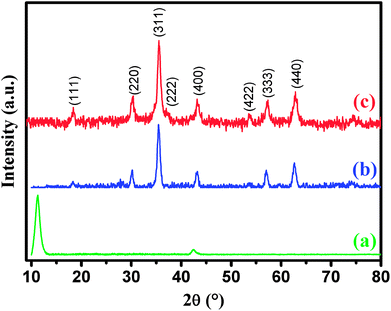
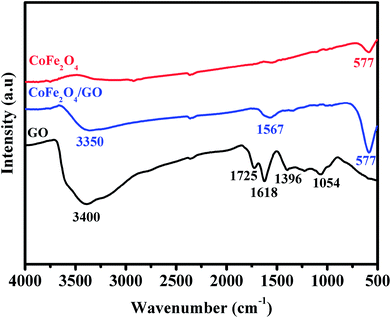
XRD was employed to analyze the crystalline phases of as-prepared GO, CoFe2O4 and CoFe2O4/GO samples (Fig. 1). The XRD patterns (Fig. 1a) confirmed the successful oxidation of natural graphite to graphite oxide, which exhibits a strong diffraction peak at 2θ = 10.28, corresponding to the (001) inter-planar spacing of 0.87 nm, which is much larger than the d-spacing of graphite (0.34 nm). It is evident that CoFe2O4 and CoFe2O4/GO exhibit similar XRD patterns. The diffraction peaks for the two samples at 2θ = 30.3, 35.6, 43.3, 53.6, 57.1 and 62.8 are consistent with the (220), (311), (400), (422), (333) and (440) reflections, respectively, of the cubic spinel-type structure of CoFe2O4 (JCPDS 75-0033). It should be noted that typical diffraction peaks of GO could not be detected in the XRD pattern of CoFe2O4/GO, suggesting the destruction of the regular layered structure of GO due to the crystal growth of CoFe2O4 between its inter-layers. The average crystallite size of CoFe2O4 and CoFe2O4/GO, estimated from the Debye–Scherrer formula, are 10.37 and 11.06 nm, respectively.The FT-IR spectra of GO, CoFe2O4 and CoFe2O4/GO are shown in Fig. 2. As illustrated in Fig. 2, several characteristic bands of the functional groups of GO can be observed. The two peaks located at 1725 and 1618 cm−1 are assigned to the anti-symmetric and symmetric stretching vibrations of carboxylic groups (COO−). The absorption peaks at 1035 cm−1 is attributed to the stretching vibrations of alkoxy C–O from the oxygen-containing functional groups such as carbonyl, carboxylic and epoxy groups.35 Indeed, the FTIR spectrum of CoFe2O4 shows a peak at 577 cm−1, which is ascribed to the Co–O and Fe–O vibrations. It is worth noting that in the spectrum of CoFe2O4/GO, the peaks at 1618 cm−1, corresponding to the functional groups of COO in GO, shifts to 1567 cm−1.
The calculated textural parameters of CoFe2O4 and CoFe2O4/GO are summarized in Table 1. From the data in Table 1, it can be seen that the BET surface area of CoFe2O4 is 124 m2 g−1 and its pore volume is 0.1662 cm3 g−1, while the surface area of the CoFe2O4/GO is 142 m2 g−1 and its pore volume is 0.1868 cm3 g−1. The addition of GO nanosheets should be the responsible for this increase in the surface area of CoFe2O4/GO compared to that of CoFe2O4. The nitrogen sorption isotherm of CoFe2O4, as shown in Fig. 3, is of type III with a distinct hysteresis loop of type H2 in the relative pressure range of 0.5 and extending almost to 1, which is characteristic of mesoporous textural porosity. The corresponding pore size distribution curve indicates that CoFe2O4 exhibited a pore size distribution in the range of 2 to 10 nm with a central value of 6.5 nm, corresponding to mesoporous materials. As for CoFe2O4/GO, there is a slight difference as the nitrogen sorption isotherms of CoFe2O4/GO are of the type III (Fig. 3) and the hysteresis loop is of type H3 according to the IUPAC classification. The corresponding pore size distribution curve indicates that CoFe2O4/GO has a centralized pore size distribution within two areas toward 4 and 6 nm, which confirm the existence of textural mesopores.
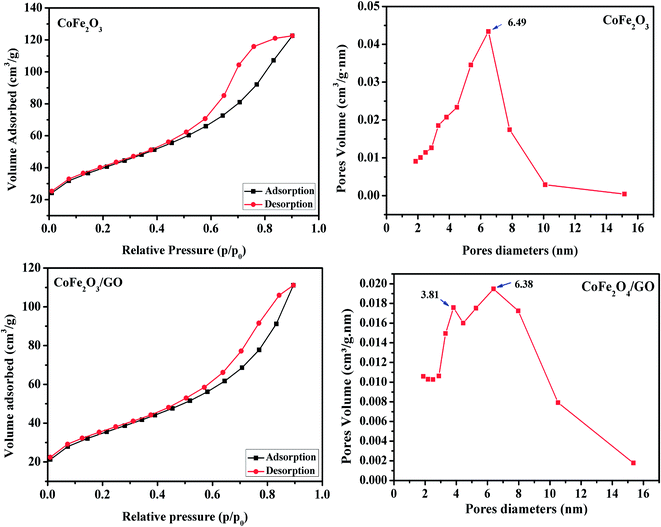 | ||
| Fig. 3 Nitrogen adsorption/desorption isotherms and BJH pore size distribution of CoFe2O4 and CoFe2O4/GO. | ||
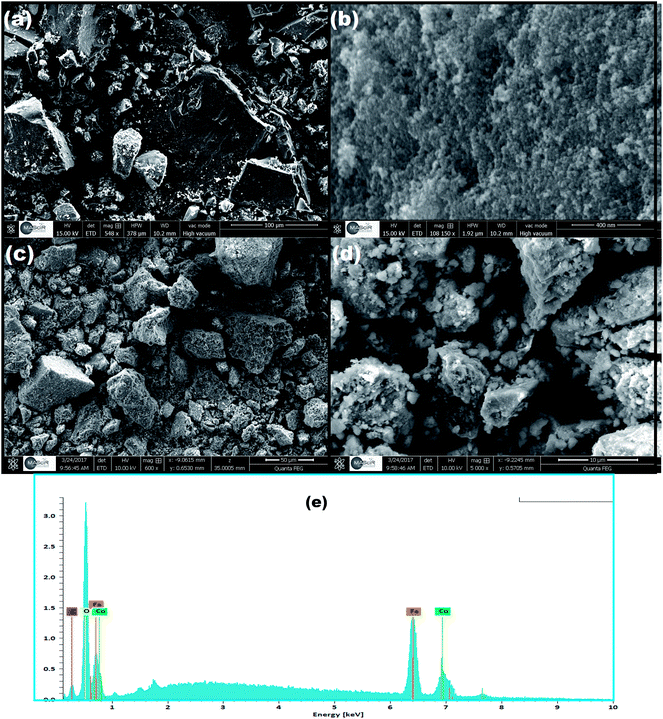
The surface morphology and elemental composition of the as-prepared CoFe2O4 and CoFe2O4/GO were investigated by SEM and EDX. From the SEM images, as shown in Fig. 4, it could be observed that CoFe2O4 exhibits a heterogeneous microstructure that consisted of crystallites of various sizes. It should be noted that particles of CoFe2O4 are strongly agglomerated as shown in the FE-SEM images in (Fig. 4b), which can be attributed to the powerful inherent magnetic interaction of CoFe2O4 magnetic particles. Furthermore, as shown in Fig. 4c and d, when CoFe2O4 was supported on the surface of GO nanosheets, the agglomeration phenomenon reduced, suggesting that GO can prevent the aggregation of the CoFe2O4 nanoparticles. Moreover, energy dispersive X-ray (EDX) analyses were recorded and are shown Fig. 4e. The EDX analysis confirmed the elemental composition of the CoFe2O4–GO material, which primarily consists of C, Co, Fe, and O. The chemical composition of the as-synthesized products was further analyzed by inductively coupled plasma atomic emission spectroscopy (ICP-AES). Table 2 shows the elemental composition of CoFe2O4/GO measured by EDX, ICP-AES and C.A. The stoichiometric elemental composition for Co, Fe, and O is 22.79, 44.44, and 4.32%, respectively. In all samples, Co and Fe are in the ratio of 1![[thin space (1/6-em)]](https://www.rsc.org/images/entities/char_2009.gif) :
:![[thin space (1/6-em)]](https://www.rsc.org/images/entities/char_2009.gif) 2, which further confirm the structure of CoFe2O4/GO.
2, which further confirm the structure of CoFe2O4/GO.
| Element | Weight (%) | ||
|---|---|---|---|
| EDX | ICP-AES | C.A | |
| Co | 22.15 | 22.79 | — |
| Fe | 45.94 | 44.44 | — |
| C | 4.24 | — | 4.32 |
| O | 37.65 | — | — |
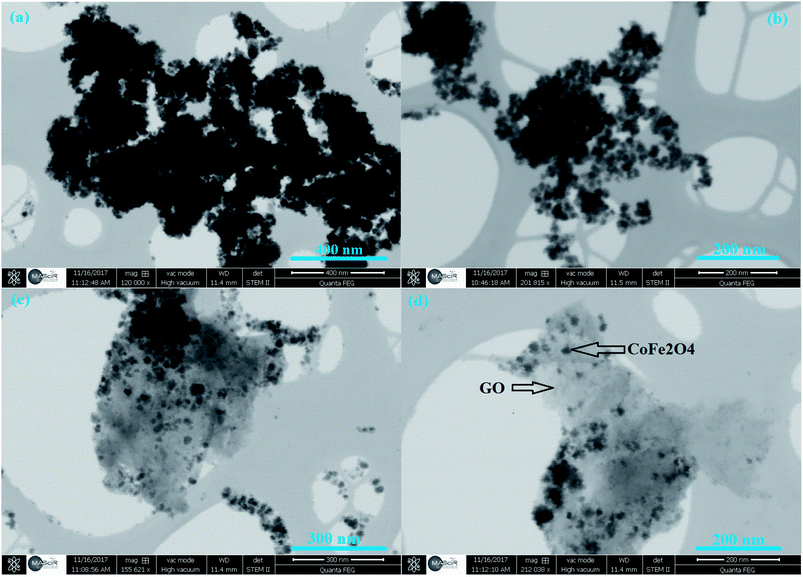
The morphology of GO and CoFe2O4/GO was characterized by STEM. From Fig. 5(a and b), it can be observed that CoFe2O4 NPs prepared in the absence of GO show spherical particles with severe aggregation due to the magnetic dipolar interaction among the magnetite NPs. In comparison, uniform CoFe2O4 NPs are deposited and well-dispersed on the basal planes of graphene (Fig. 5(c and d)). In addition, we noticed that CoFe2O4 NPs were still tightly anchored on the surface of GO even after sample preparation (mechanical stirring and sonication) for STEM analysis, suggesting a strong interaction between CoFe2O4 NPs and GO. Moreover, the graphene sheets distributed between the CoFe2O4 NP can prevent the aggregation of CoFe2O4 NP to a certain extent, which can be of great benefit to reactions.
The magnetic properties of CoFe2O4 and CoFe2O4/GO were investigated by SQUID from −15![[thin space (1/6-em)]](https://www.rsc.org/images/entities/char_2009.gif) 000 to 15
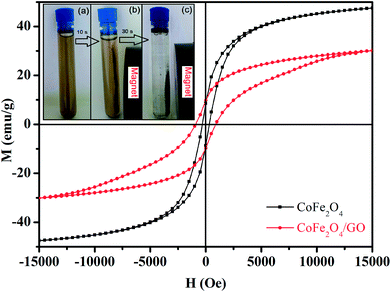
000 to 15![[thin space (1/6-em)]](https://www.rsc.org/images/entities/char_2009.gif) 000 Oe at room temperature as shown in Fig. 6. The saturation magnetization (Ms) of CoFe2O4 is close to 47.33 emu g−1, which is higher than that corresponding to the CoFe2O4/GO material (30.15 emu g−1). This increase in Ms value could be due to (i) the existence of the GO nanosheets, (ii) the surface defect of CoFe2O4 crystallites and (iii) the strong interfacial interaction between CoFe2O4 nanoparticles and GO surfaces. Moreover, the field-dependent magnetization curves of CoFe2O4 and CoFe2O4/GO show non-negligible remanence (Mr) and coercivity (Hc), indicating paramagnetic behavior of the two samples at room temperature (Table 3). Furthermore, CoFe2O4/GO hybrids can be easily separated from the reaction by applying an external magnetic field. The CoFe2O4/GO catalyst can be dispersed in deionized water to form a stable brown homogenous suspension before magnetic separation (inset of Fig. 6a). However, when a magnet was placed close to the reaction vessel, it could be observed that the synthesized samples were rapidly attracted, and a nearly colorless solution was obtained (inset of Fig. 6(b and c)).
000 Oe at room temperature as shown in Fig. 6. The saturation magnetization (Ms) of CoFe2O4 is close to 47.33 emu g−1, which is higher than that corresponding to the CoFe2O4/GO material (30.15 emu g−1). This increase in Ms value could be due to (i) the existence of the GO nanosheets, (ii) the surface defect of CoFe2O4 crystallites and (iii) the strong interfacial interaction between CoFe2O4 nanoparticles and GO surfaces. Moreover, the field-dependent magnetization curves of CoFe2O4 and CoFe2O4/GO show non-negligible remanence (Mr) and coercivity (Hc), indicating paramagnetic behavior of the two samples at room temperature (Table 3). Furthermore, CoFe2O4/GO hybrids can be easily separated from the reaction by applying an external magnetic field. The CoFe2O4/GO catalyst can be dispersed in deionized water to form a stable brown homogenous suspension before magnetic separation (inset of Fig. 6a). However, when a magnet was placed close to the reaction vessel, it could be observed that the synthesized samples were rapidly attracted, and a nearly colorless solution was obtained (inset of Fig. 6(b and c)).
| Sample | Ms (emu g−1) | Mr (emu g−1) | Hc (Oe) |
|---|---|---|---|
| CoFe2O4 | 47.33 | 8.55 | 348.53 |
| CoFe2O4/GO | 30.15 | 9.78 | 897.16 |
To evaluate the catalytic performance of our materials, the degradation of RhB in the presence of the PMS was selected as a model catalytic reaction. The degradation kinetics of RhB in aqueous solution was studied by monitoring the decrease of its absorption peak at 554 nm in the UV-vis spectra with time as exemplified in Fig. 7a. No significant shift in the absorption peak (λmax = 554 nm) was observed before 12 min except for a quick reduction in the absorbance at 554 nm. Since the absorbance at 554 nm was primarily attributed to RhB remaining in the solution under our experimental conditions, the linear relationship between the concentration of the residual RhB and its absorbance at 554 nm was further verified by the standard calibration curve (R2 = 0.9970), and the corresponding absorbance was then converted to the RhB concentration in the solution used for kinetic analysis. To further investigate the degradation of RhB, total organic carbon (TOC), which has been widely used to evaluate the degree of mineralization of organic species, was measured in the RhB degradation process by the CoFe2O4/GO/PMS system as shown in Fig. 7b. The TOC removal efficiency of RhB reached 89.34% after 12 min in the presence of the CoFe2O4/GO/PMS system, which confirms that RhB could be mineralized to residual organic molecules by the as-prepared samples.
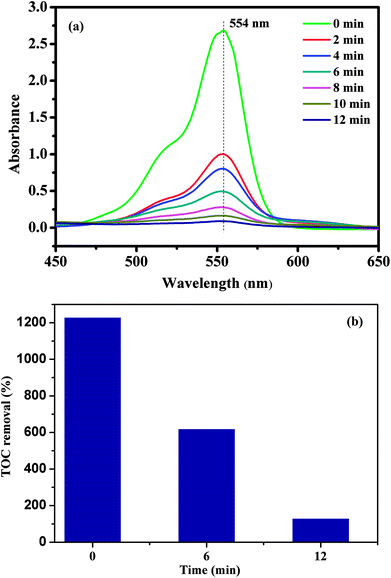 | ||
| Fig. 7 UV-vis spectra of RhB solution at different times using CoFe2O4/GO as a catalyst (a); the TOC removal efficiency of RhB using CoFe2O4/GO as a catalyst. | ||
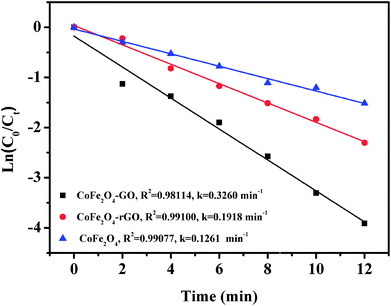
As shown in Fig. 8, no RhB degradation was observed via PMS oxidation alone. Similarly, CoFe2O4, CoFe2O4/rGO and CoFe2O4/GO cannot catalyze RhB degradation in the absence of PMS, which reveals that the contribution from simple physical adsorption is negligible in this case. Moreover, in the absence of a catalyst, the concentration of RhB remained unchanged over time, suggesting that it is difficult for the degradation of RhB to proceed without a catalyst. Therefore, the degradation of RhB is very sensitive to the presence of both PMS and catalyst in the reaction system. The catalytic performances of CoFe2O4, CoFe2O4/rGO and CoFe2O4/GO for the degradation of RhB with PMS were clearly different in the three samples and the degradation efficiencies were 78, 90 and 98%, respectively. Moreover, it can be clearly observed that the degradation rate of RhB over CoFe2O4/GO was much faster than that corresponding to CoFe2O4/rGO and CoFe2O4 and it took around 12 min for complete removal of RhB. This superior catalytic activity of CoFe2O4/GO could be related to the electronic structure and the presence of functional hydroxyl groups in GO, which could be involved in the degradation mechanism, thus enhancing the catalytic activity of the CoFe2O4/GO catalyst for the degradation of RhB. As compared with CoFe2O4, GO can offer an environment to prevent aggregation of CoFe2O4 nanoparticles and also a higher surface area (142 m2 g−1) (124 m2 g−1), which can provide more active sites for catalytic degradation of RhB.
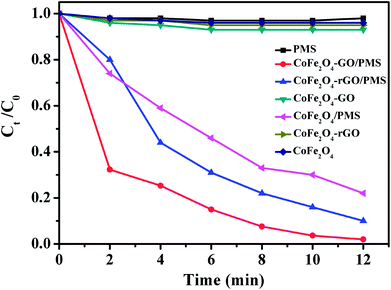 | ||
| Fig. 8 RhB degradation by various catalytic PMS systems. Conditions: [RhB]0 = 0.03 mmol L−1, [PMS] = 0.10 mg L−1, amount of catalyst = 10 mg, temperature = 25 °C. | ||
Fig. 9 shows the linear kinetic fitting plots of ln(C0/Ct) = f(t) for RhB photodegradation, in which C0 and Ct are the initial concentration of RhB and its concentration at time t, respectively. In general, the degradation of organic dyes obeys a pseudo-first order kinetics model. As shown in Fig. 9, RhB degradation by CoFe2O4, CoFe2O4/GO and CoFe2O4/rGO can follow a pseudo-first order kinetics model. Furthermore, the constant rate values indicate that CoFe2O4/GO possesses a better rate constant (0.3260 min−1) than CoFe2O4/rGO (0.1918 min−1) and CoFe2O4 (0.1261 min−1), suggesting that graphene oxide plays a significant role in the enhancement of PMS catalytic degradation of RhB. The strong interfacial interaction between graphene oxide and CoFe2O4 generates a synergistic function of large surface area and improves the electron transport ability and chemical reaction sites.
The effect of oxone concentration on RhB degradation was studied and the results are presented in Fig. 10. It is worth mentioning that increasing oxone concentration from 0.02 to 0.20 g L−1 led to a faster and more efficient degradation of RhB from 54.4 to 99%. Meanwhile, the kinetic rate constant also increased from 0.0654 to 0.1918 min−1. These results could be explained by the high concentration of free sulfate radicals formed at higher oxone concentration, which result in an increase in the rate of RhB degradation. Therefore, the optimal oxone concentration was about 0.1 g L−1 for the degradation of RhB on the CoFe2O4/GO catalyst.
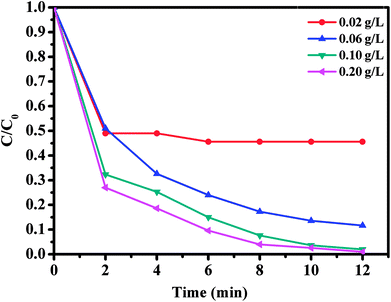 | ||
| Fig. 10 Effect of oxone concentration on RhB degradation over CoFe2O4/GO. Reaction conditions: [RhB] = 0.03 mmol L−1, amount of catalyst = 10 mg, T = 25 °C. | ||
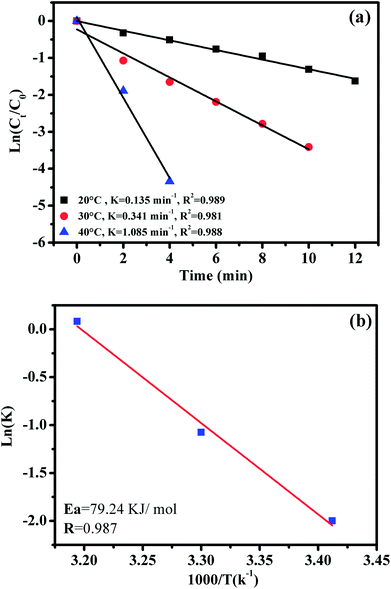
The effect of reaction temperature on RhB degradation was also investigated by varying the reaction temperatures from 20 to 30 to 40 °C; the experimental findings are presented in Fig. 11. It can be observed that the degradation rate of RhB increases from 0.135 to 1.085 min−1 with increasing temperature from 20 to 40 °C. These results could be explained by the high concentrations of free sulfate radicals generated at high temperature.
To further evaluate the effect of the CoFe2O4/GO nanocatalyst on the process kinetics, important parameters associated with the energetic aspects of the reaction, such as activation energy, (Ea) play a crucial role. The activation energy (Ea) of the degradation of RhB over the CoFe2O4/GO catalyst was evaluated by plotting ln(k) versus 1000/T according to the Arrhenius equation of ln(k) = ln(A) −Ea/RT, where k is the rate constant, R is the universal gas constant (8.314 J mol−1 K) and A is the pre-exponential. The Ea value of 79.24 kJ mol−1 was obtained from the slope of the fitted equation by linear regression (R2 = 0.987). This Ea value is comparable to those of the highest active heterogeneous catalysts ever reported, e.g., Co/active carbon (59.7 kJ mol−1),11 Co3O4/SiO2 (61.7–75.5 kJ mol−1)36 and Co/ZSM-5, (69.7 kJ mol−1),17 which indicates that CoFe2O4–GO can be considered a promising heterogeneous catalyst for the PMS oxidation process.
The effect of RhB concentration was studied by varying the concentration of RhB and the experimental findings are presented in Fig. 12. Upon decreasing RhB concentration from 0.01 to 0.03 mmol L−1, the degradation rate of RhB over CoFe2O4/GO increased significantly. Indeed, RhB was almost completely removed within 6 min at the RhB concentration of 0.01 mmol L−1, while it was removed within 12 min at the concentration of 0.03 mmol L−1.
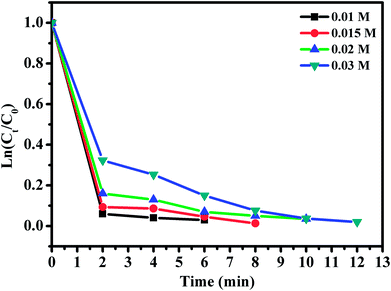 | ||
| Fig. 12 Effect of RhB concentration. Reaction conditions: [PMS] = 0.1 mmol L−1; amount of catalyst = 10 mg, T = 25 °C. | ||
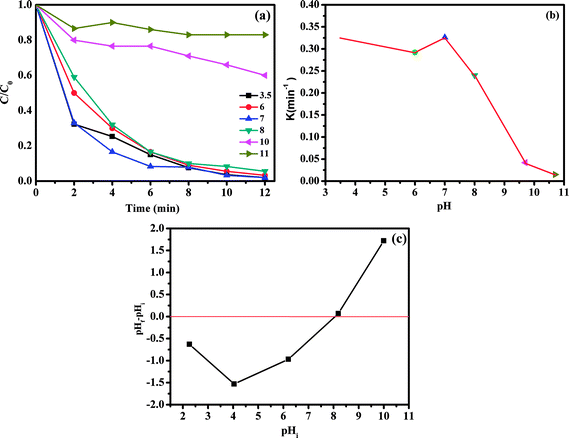
The influence of initial pH values on RhB degradation over the CoFe2O4/GO catalyst was explored by adjusting the solution pH to 3.5, 6, 7, 8, 10 and 11. As shown in Fig. 13, the initial pH has a significant influence on the degradation efficiency of RhB. Based on the results obtained, we observed that the RhB degradation conducted at an initial pH of 3.5 and 7.0 was faster (decolorization efficiency of 98% at about 12 min) due to the electrostatic attraction between the negative charge of the CoFe2O4/GO catalyst at low pH (Fig. 13c) and the positive charge of RhB. It is also noteworthy that there was no obvious impact on the RhB degradation when the initial pH value changed in the range of 3.5–7. Moreover, at high initial pH values of 10.0 and 11.0, the decolorization rates were 40% and 17%, respectively, which can be explained by the deprotonation of the carboxyl group of RhB and the transformation of the cationic form of RhB into zwitterionic form.
The recyclability of a catalyst is advantageous for its commercialization and industrialization. To explore the reusability of our catalytic system, CoFe2O4/GO nanocomposite was employed as a recyclable catalyst in the degradation of RhB by PMS over four cycles. After each cycle, the catalyst was easily separated by an external magnet and washed successively by water and dichloromethane. As shown in Fig. 14, it was found that the catalytic performance of the recovered catalyst remained nearly the same for the second successive run. Although the catalytic activity slightly diminished, 67% of decolorization rate was still achieved in the fourth run, indicating that CoFe2O4/GO nanocatalysts exhibited good recyclability. Metal leaching was studied by ICP-AES analysis of the CoFe2O4/GO catalyst after the reaction. The Co and Fe concentrations in the catalyst was 20.96% and 39.51%, respectively, after one catalytic cycle of RhB degradation, which confirms negligible metal leaching.
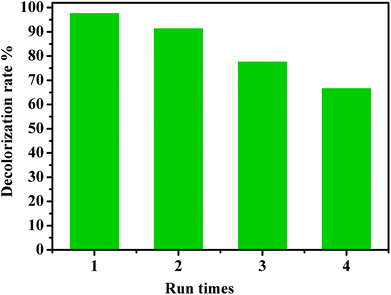 | ||
| Fig. 14 Reuse performance of the CoFe2O4/GO catalyst in RhB degradation. Reaction conditions: [RhB] = 0.03 mmol L−1, [PMS] = 0.10 mmol L−1, amount of catalyst = 10 mg, T = 25 °C. | ||
4. Conclusion
In summary, magnetic CoFe2O4 and CoFe2O4/GO catalysts were successfully prepared via a facile approach. The physico-chemical properties of these materials were evaluated by FT-IR, XRD, SEM, and BET. These catalysts showed potential capability for catalytic degradation of rhodamine B using PMS as an oxidant. Catalyst screening revealed that CoFe2O4/GO exhibited superior catalytic activity for the removal of RhB when compared with CoFe2O4 and CoFe2O4/rGO. Then, we studied the effect of several parameters on RhB degradation. It was found that the degradation rate was dependent on pH, temperature, the concentration of oxone and the initial concentration of RhB. Furthermore, this catalyst can be easily separated by an external magnet and reused.Conflicts of interest
There are no conflicts to declare.Acknowledgements
The financial assistance of the MAScIR Foundation towards this research is hereby acknowledged. We acknowledge also the financial assistance of the CNRST.Notes and references
- H. Ghodbane and O. Hamdaoui, Ultrason. Sonochem., 2009, 16, 455–461 CrossRef CAS.
- C. A. Martínez-Huitle and E. Brillas, Appl. Catal., B, 2009, 87, 105–145 CrossRef.
- S. G. Schrank, J. N. R. dos Santos, D. S. Souza and E. E. S. Souza, J. Photochem. Photobiol., A, 2007, 186, 125–129 CrossRef CAS.
- G. P. Anipsitakis and D. D. Dionysiou, Appl. Catal., B, 2004, 54, 155–163 CrossRef CAS.
- P. Hu and M. Long, Appl. Catal., B, 2016, 181, 103–117 CrossRef CAS.
- T. Zhang, Y. Chen, Y. Wang, J. Le Roux, Y. Yang and J. P. Croué, Environ. Sci. Technol., 2014, 48, 5868–5875 CrossRef CAS.
- E. Saputra, S. Muhammad, H. Sun, H. M. Ang, M. O. Tadé and S. Wang, Appl. Catal., B, 2013, 142, 729–735 CrossRef.
- X. Chen, J. Chen, X. Qiao, D. Wang and X. Cai, Appl. Catal., B, 2008, 80, 116–121 CrossRef CAS.
- K. H. Chan and W. Chu, Water Res., 2009, 43, 2513–2521 CrossRef CAS.
- G. P. Anipsitakis, E. Stathatos and D. D. Dionysiou, J. Phys. Chem. B, 2005, 109, 13052–13055 CrossRef CAS.
- P. R. Shukla, S. Wang, H. Sun, H. M. Ang and M. Tadé, Appl. Catal., B, 2010, 100, 529–534 CrossRef CAS.
- Y. Hardjono, H. Sun, H. Tian, C. E. Buckley and S. Wang, Chem. Eng. J., 2011, 174, 376–382 CrossRef CAS.
- H. Sun, H. Tian, Y. Hardjono, C. E. Buckley and S. Wang, Catal. Today, 2012, 186, 63–68 CrossRef CAS.
- Y. Yao, Z. Yang, D. Zhang, W. Peng, H. Sun and S. Wang, Ind. Eng. Chem. Res., 2012, 51, 6044–6051 CrossRef CAS.
- P. Shi, R. Su, F. Wan, M. Zhu, D. Li and S. Xu, Appl. Catal., B, 2012, 123, 265–272 CrossRef.
- P. Shi, R. Su, S. Zhu, M. Zhu, D. Li and S. Xu, J. Hazard. Mater., 2012, 229, 331–339 CrossRef.
- P. Shukla, S. Wang, K. Singh, H. M. Ang and M. O. Tadé, Appl. Catal., B, 2010, 99, 163–169 CrossRef CAS.
- W. Chu, W. K. Choy and C. Y. Kwan, J. Agric. Food Chem., 2007, 55, 5708–5713 CrossRef CAS.
- L. Hu, X. Yang and S. Dang, Appl. Catal., B, 2011, 102, 19–26 CrossRef CAS.
- P. Shukla, H. Sun, S. Wang, H. M. Ang and M. O. Tadé, Catal. Today, 2011, 175, 380–385 CrossRef CAS.
- L. Hu, F. Yang, W. Lu, Y. Hao and H. Yuan, Appl. Catal., B, 2013, 134, 7–18 CrossRef.
- H. Liang, H. Sun, A. Patel, P. Shukla, Z. H. Zhu and S. Wang, Appl. Catal., B, 2012, 127, 330–335 CrossRef CAS.
- F. Qi, W. Chu and B. Xu, Appl. Catal., B, 2013, 134, 324–332 CrossRef.
- Y. Ren, L. Lin, J. Ma, J. Yang, J. Feng and Z. Fan, Appl. Catal., B, 2015, 165, 572–578 CrossRef CAS.
- S. Su, W. Guo, Y. Leng, C. Yi and Z. Ma, J. Hazard. Mater., 2013, 244, 736–742 CrossRef.
- J. Deng, Y. Shao, N. Gao, C. Tan, S. Zhou and X. Hu, J. Hazard. Mater., 2013, 262, 836–844 CrossRef CAS.
- S. Sagadevan, J. Podder and I. Das, Recent Trends in Materials Science and Applications, 2017, vol. 5, pp. 145–152 Search PubMed.
- C. Cannas, A. Musinu, D. Peddis and G. Piccaluga, Chem. Mater., 2006, 18, 3835–3842 CrossRef CAS.
- C. Wan and J. Li, Carbohydr. Polym., 2015, 134, 144–150 CrossRef CAS.
- Y. Zhang, B. Chen, L. Zhang, J. Huang, F. Chen, Z. Yang, J. Yao and Z. Zhang, Nanoscale, 2011, 3, 1446–1450 RSC.
- S. Bai, X. Shen, X. Zhong, Y. Liu, G. Zhu, X. Xu and K. Chen, Carbon, 2012, 50, 2337–2346 CrossRef CAS.
- C. Eid, E. Assaf, R. Habchi, P. Miele and M. Bechelany, RSC Adv., 2015, 5, 97849–97854 RSC.
- Y. Cao, S. R. Cai, S. C. Fan, W. Q. Hu, M. Sen Zheng and Q. F. Dong, Faraday Discuss., 2014, 172, 215–221 RSC.
- W. S. Hummers and R. E. Offeman, J. Am. Chem. Soc., 1958, 80, 1339 CrossRef CAS.
- A. V. Murugan, T. Muraliganth and A. Manthiram, Chem. Mater., 2009, 21, 5004–5006 CrossRef CAS.
- P. Shukla, H. Sun, S. Wang, H. M. Ang and M. O. Tadé, Sep. Purif. Technol., 2011, 77, 230–236 CrossRef CAS.
| This journal is © The Royal Society of Chemistry 2018 |

