 Open Access Article
Dynamically imaging collision electrochemistry of single electrochemiluminescence nano-emitters†
Cheng
Ma
,
Wanwan
Wu
,
Lingling
Li
,
Shaojun
Wu
,
Jianrong
Zhang
 ,
Zixuan
Chen
 * and
Jun-Jie
Zhu
 *
*
State Key Laboratory of Analytical Chemistry for Life Science, School of Chemistry and Chemical Engineering, Nanjing University, Nanjing 210023, P. R. China. E-mail: chenzixuan@nju.edu.cn; jjzhu@nju.edu.cn
First published on 30th June 2018
Abstract
The quest for new techniques to measure single nanomaterials is a great impetus to research efforts to understand individual behaviours. Here, we develop an electrochemiluminescence (ECL) microscopy for visualization of stochastic collision electrochemistry of single nano-emitters without the interference of current and optical background. This design uses a water-immersion objective to capture the ECL emission of nanoparticles near the specular electrode surface for enhancing light collection efficiency. The approach enables us to trace the collision trajectory of multiple nanoparticles and spatially distinguish simultaneous collisions. Results reveal that collision types, frequencies and ECL intensities significantly depend on surface natures, particle concentrations, and diffusion fluxes. By recording successive collisions, we develop a “relay probe” sensing platform for long-term research. This imaging technique displays great potential for applications in single-particle electrochemical and analytical research.
The development of techniques on single nanoparticle measurements greatly promotes the fundamental research of single entities in nanoscale electrochemistry and applications in analysis, electrocatalysis, and biosensing.1–3 Among these techniques, ultramicroelectrodes (UMEs) provide a rapid and convenient stochastic collision strategy to characterize the nature of single nanoparticles, including electroactivity and size distribution.4–9 However, the detailed collision dynamics information obtained by traditional UMEs techniques is limited or can only be evaluated indirectly.10 As a result, the nanoparticles moving and simultaneously colliding on the surface of the electrode cannot be distinguished by potentiostats in a digital manner. Optical imaging techniques, such as fluorescence, surface plasmon resonance, and holographic microscopy, provide visualized approaches to describe the motion of single entities colliding with an electrode, enabling the dynamic study of individual electrochemical activity.11–15 But these optical techniques often require one or more extrinsic light sources, even high-power lasers, which disturb the electrochemical measurements by either inevitable optical background or local heat generation from the photothermal effect.
Electrochemiluminescence (ECL) is an electrochemically triggered luminescence signal involving electron transfer reactions occurring at an electrode vicinity.16,17 Bard et al. demonstrate that ECL can provide an optical readout to study collision events of single entities without the interference of current background.18–20 However, the non-imaging methods hardly attribute transient light signals to specific nanoparticles and it is difficult to attain the cyclic voltammogram of every nanoparticles. Recently, with benefits of the electron-multiplying charge-coupled device (EMCCD), ECL microscopy enables direct observation of individual immobilized entities with spatiotemporal resolution.21–23 Current ECL microscopy-based nanomaterials research focuses on the electrocatalytic amplification of bulk phase ECL luminophores on the surface of immobilized noble metal nanostructures, such as gold nanoparticles, gold nanowires, and gold–platinum Janus nanoparticles.24–26 Nevertheless, the background ECL emission from electrode substrates is still a significant issue that may disturb the electrochemical measurements. Moreover, the electrocatalytic reactions of metal materials are triggered only in the case of collision moment, so nanoparticles moving at an electrode vicinity and collision dynamics cannot be studied. Thus, developing a background-free ECL microscopy to image single nano-emitters at an electrode vicinity is critical for studying stochastic collision nanoelectrochemistry. However, techniques for mapping single ECL nano-emitters are still deficient up to now.
Here, we develop a single-nanoparticle ECL microscopy with co-localization of photoluminescence (PL) and scan electron microscopy (SEM) for directly observing the diversely collisional electrochemistry of nanoparticles. The well-known Ru(bpy)32+-doping silica nanoparticles (RuDSNs) are used here owing to its high ECL emission efficiency,27–29 though the ECL emission at single-nanoparticle level has not still been studied. We show the merits of the ECL microscopy for studying stochastic collision events and disclose how the nature of both the nanoparticle surface and electrode itself affects the dynamic collision behaviours. Moreover, based on continuous single-nanoparticle collisions, a unique “relay probe” concept is proposed to enable long-term observation and research. The developed ECL microscopy provides a zero background and visualization collision electrochemical technique at single-nanoparticle level.
Results and discussion
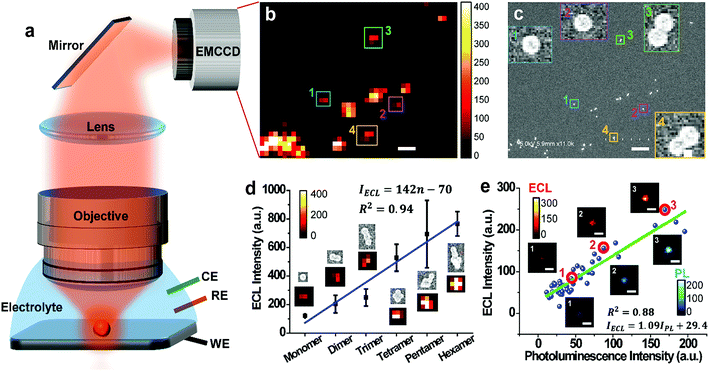
In order to observe single ECL nano-emitters, we develop a home-made upright microscope with a water-immersion objective (×60, NA = 1.1) for higher light collecting efficiency and optical resolution (Fig. 1a). The RuDSNs are synthesized by the reverse microemulsion method according to the previous report (details in ESI†).28 A three-electrode electrochemical cell with RuDSNs deposited on a specular glass carbon (GC) electrode is mounted under the objective with the electrolyte containing coreactant tri-n-propylamine (TPA). The potential is then cyclically scanned to excite ECL emission, which is collected by the objective to form ECL images (Fig. 1b). To accurately dissect the corresponding structures of these discrete ECL spots, we use SEM to characterize the detailed morphology of the same set of particles. The SEM co-localization images (Fig. 1c and S3†) provide direct evidence that the smallest ECL spots are from single nanoparticles (∼62 nm). Due to the restrict of optical diffraction limit, the nanoparticles close to each other are indistinguishable in ECL images, and thus produce bigger and brighter spots.The co-localization approach reveals that the morphology of each particle significantly affects its ECL intensity. For example, the ECL intensity shows a pseudo-linear increment with the aggregates from monomer to hexamer (Fig. 1d), but noticeable error bars suggest more specific physical and chemical states of both particles and electrode, which also determine the ECL intensity. Moreover, the co-localization between ECL images and PL images (Fig. S1 and S2†) suggests that with the increase of doping amount of Ru(bpy)32+ in a set of particles, the ECL intensity increases proportionally (Fig. 1e). Notice that some outliers suggest the doping heterogeneity in 3D siloxane nano-matrices. Avoiding ensemble averaging, the spatially resolved ECL microscopy with PL and SEM co-localization techniques not only enables us to identify the important features in the ECL emission of individual nanoparticles with high throughput, but also reveals the subtle relationship among the particle shape, doping amount, and ECL intensity.
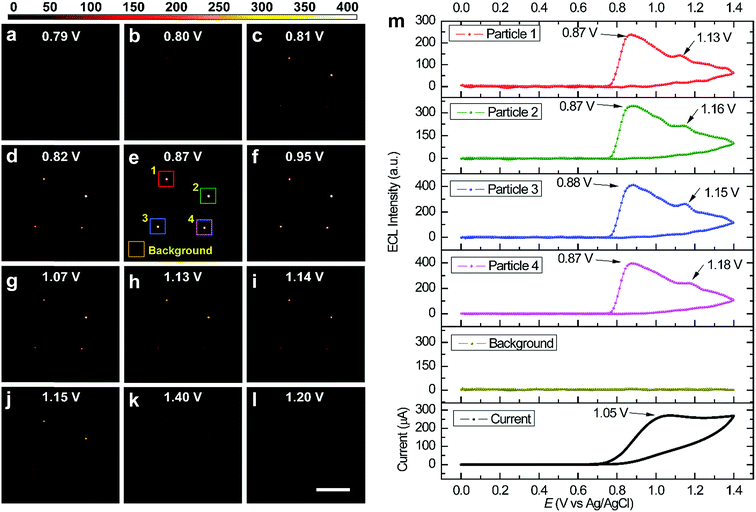
Fig. 2 shows several ECL snapshots of four immobilized RuDSNs during a cyclic voltammetry scan (Movie S1†). The ECL spots appear following the oxidation of TPA (Fig. S4†) and reach the maximum brightness at 0.87 V, corresponding to the “revisited” route involving both TPA cation radicals (TPA˙+) and TPA free radicals (TPA˙).30 As the potential continues to scan beyond 0.87 V, the ECL intensities of the four nanoparticles start to decrease, although the oxidation current increases and then reaches a peak at 1.05 V. The contravention between the ECL emission intensity and the oxidation current is attributed to direct anodic oxidation of TPA˙ at the electrode interface.31,32 It is noteworthy that we observe another weak ECL peak around 1.16 V, derived from the direct oxidation of the Ru(bpy)32+ molecules inside the RuDSNs (Fig. S5†).33 Thus, the electron tunnelling/hopping mechanism is experimentally confirmed at single-nanoparticle level. The ECL–potential curve of single nanoparticles can accurately reveal specific electrochemical reaction without the interference from the charge–discharge current, side reactions and water decomposition reaction, which are inevitable in traditional CV measurements by macroelectrodes. In addition, as illustrated in Fig. 2m, the ECL–potential curve shows a zero background signal from the blank electrode substrate during the entire ECL process, which demonstrates the high accuracy and sensitivity for imaging local electrochemical reactions by our ECL microscopy. Fig. S6† shows the ECL–potential curves of individual RuDSNs at different electrode surfaces. The obvious differences in both the ECL peak potential and the ECL intensity suggest the ECL reactions kinetics significantly depends on the electrode material and interfacial properties (details in ESI†).
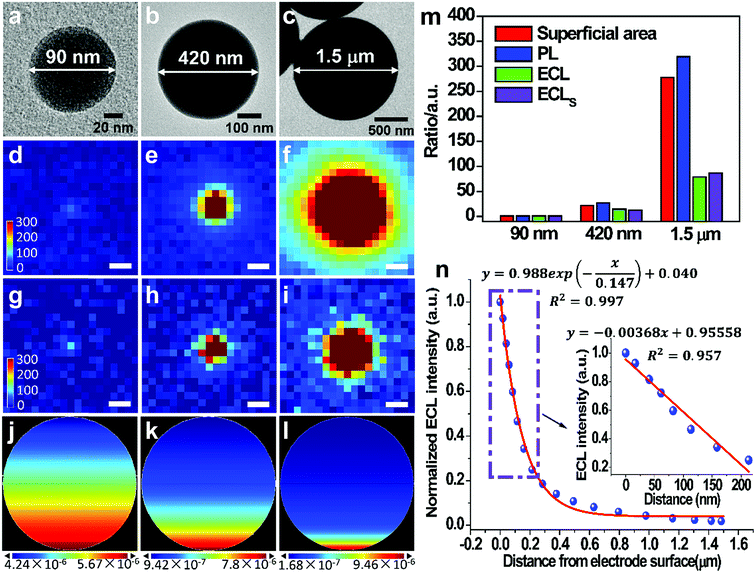
To gain more insights into the way how the particle size and the distance from electrode surface affect the ECL emission efficiency, we synthesize Ru(bpy)32+-coating silica particles (RuCSPs) with three different sizes (details in ESI†) in order to establish the theoretical model, because ECL reactions only occur on the particle surface. These three RuCSPs are imaged by the PL and ECL co-localization technique. TEM images (Fig. 3a–c) show that the three RuCSPs have well-defined spherical shapes with average diameters of 90 nm, 420 nm and 1.5 μm, respectively. The PL intensity (Fig. 3d–f) are proportional to the superficial areas of themselves, suggesting the same surface density of Ru(bpy)32+ in different sized RuCSPs. Nevertheless, the increase rates of the ECL intensity are much lower relative to that of their superficial areas and PL intensity (Fig. 3g–i and m). To understand the difference, the three-dimensional ECL patterns of each RuCSP are simulated by a previously reported method (details in ESI†).34 The ECL patterns from the side-view show exponential decreasing brightness from the bottom toward the top (Fig. 3j–l). The decreasing ECL efficiency is mainly attributed to two factors. The first is the electron tunnelling/hopping and lateral charge propagation of Ru(bpy)32+, which depend on the distance from the electrode surface. The other is decreasing concentration of chemically-unstable TPA˙+ with diffusing from the electrode surface, which produce ECL emission by the “revisited” mechanism. Thus, the ECL efficiency highly depends on the distance from the electrode surface (Fig. 3n), leading to merely a tiny proportion of Ru(bpy)32+ involved in ECL reactions. On the other hand, distance-dependence of the ECL efficiency enables us to measure the distance from the position of mobile nanoparticles to the electrode surface, given that the ECL intensity shows high sensitivity and a linear relation within ∼200 nm from the electrode (inset in Fig. 3n). Fig. S7† shows the ECL emission of RuDSNs even on the upper surface of single HeLa cell, which serves as a “barrier” between the particles and the electrode. Thus, the ECL emission far from the electrode enables us to image mobile RuDSNs in the vicinity of electrodes and further study the collision dynamics (see below).
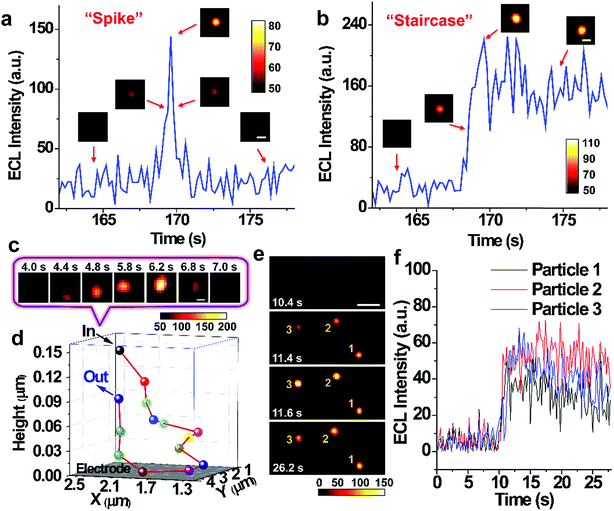
Single nanoparticle collisions are recorded on injecting RuDSNs into the electrolyte containing the coreactant TPA and the bare GC electrode (applied potential of 1.4 V). Initially, no ECL signal is observed on the electrode surface. But shortly afterwards, several discrete ECL spots appear successively in different regions, demonstrating direct visualization of collision electrochemistry. These discrete ECL signals fall into two major categories: “spike” and “staircase” (Fig. 4a and b), suggesting the elastic and sticking collision, respectively. Oftentimes nanoparticles find way back to the electrode after an elastic collision to generate continuous collision events (Fig. S8†). A bunch of collisions in a local region imply the random walk of single nanoparticles in the vicinity of electrode surface.6,35 Interestingly, during the collision process, the variation of the ECL intensity is accompanied by horizontal motions of the spot (Fig. 4c), indicating Brownian motion of single RuDSN in all direction. By fitting its diffraction-limited emission (Fig. S9†) and solving the intensity–distance equation in Fig. 3n, we disclose the three-dimensional spatial position of the RuDSN during the collision process (Fig. 4d and Movie S2†). So far, the temporal resolution of ECL microscopy is limited to the ECL intensity of single ECL nano-emitters. Therefore, the temporal resolution used in this work (0.2 s) is quite fast in the current research. Because of the rapid motion of the nanoparticle, the detailed motion trajectory and the instantaneous kinetic velocity of the RuDSN cannot be accurately calculated and described in this work. Nevertheless, every ECL spot represents the most probable position of the nanoparticle at that time, so the ECL microscopy provides the visualization of the spatial motion information during the collision electrochemistry process. In the future, the temporal resolution of ECL microscopy can be improved by either developing novel ECL nano-emitters with higher emission efficiency or optimize the microscope configurations, and the more detailed dynamic pictures of the collision process can be achieved.
The large view field (164 μm × 164 μm) enables us to observe multiple collision events simultaneously. For example, Fig. 4e and f and Movie S3† show no ECL signal on the electrode surface in the first 10.4 s. But in the following 1.2 s, three weak ECL spots appear in the blank and gradually brighten, suggesting three particles approaching the electrode surface. Finally, three spots reach the maximum brightness at the same time, indicating three simultaneous sticking collisions. Note that simultaneous collisions of multiple particles lead to an overlapped transient ECL or current signal with traditional UMEs techniques,19 which highlights the value of spatial resolution provided by the ECL microscopy in this work.
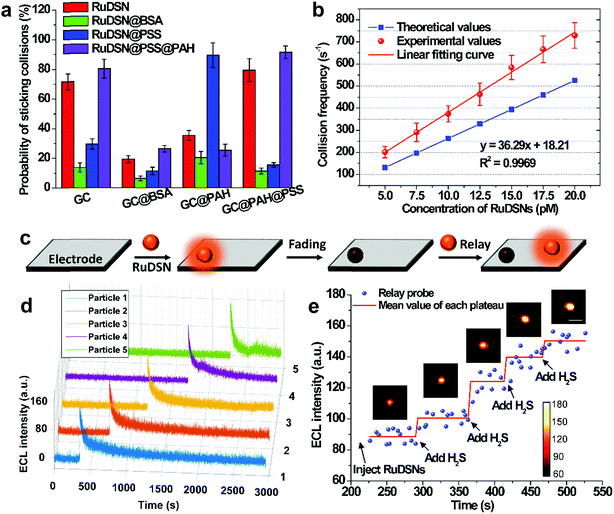
The probabilities of sticking collisions are investigated with different electrode surface modifications and nanoparticle capping agents (Fig. 5a). For instance, coating RuDSNs with bovine serum albumin (BSA) results in about a five times lower sticking probability relative to bare RuDSNs, attributed to the inhibited nonspecific adsorption by the steric hindrance of BSA (Fig. S10†). On the other hand, the sticking probability increases when blocking the bare GC electrode with poly(sodium 4-styrenesulfonate) (PSS), which offers abundant negative charges to irreversibly adsorb positively charged RuDSNs by electrostatic interaction. More detailed descriptions are in ESI.† These results elucidate that the probability of sticking collisions is a function of the interaction between the nanoparticles and electrode, and very sensitive to the steric hindrance and surface charges.
An interesting discovery is that RuDSNs tend to collide with greater intensity and frequency near the edge of the GC electrode than at the interior zone (Fig. S11†). This result demonstrates higher diffusive flux of both the RuDSNs and coreactant TPA to the edges favors the ECL intensity and collision frequency. The collision frequency (fp) of the overall electrode surface can be estimated by the steady-state diffusion-limited model (fp ≈ 4Dpcprd, where Dp is the diffusion coefficient of particles, cp is the concentration of the RuDSNs, and rd is the radius of the GC electrode).35 As shown in Fig. 5b, the calculated values are slightly less than the experimental values, which are obtained from the Fig. S11e† by the integrated method. The deviations are probably derived from the continuous collisions of some RuDSNs according to the random walk behaviour (Fig. S8†), which is ignored in the diffusion-limited theoretical model.
Statistics indicate that the collision events from different nanoparticles have similar ECL intensity (Fig. S12†). However, concerning single RuDSN, once it sticks to the electrode, its ECL intensity decays exponentially with the time elapse (half-life time = 29.5 ± 4.8 s) (Fig. 5d). The dissolution or passivation of RuDSNs seems to be impossible because of the inert electrochemical property of the silica matrix. Nevertheless, the obvious decline of the PL intensity of RuDSNs after the ECL reactions (Fig. S13†) suggests that the ECL decay is attributed to the depletion of the Ru(bpy)32+ molecules inside nanoparticles during the ECL reactions. As a result, only single nanoparticle hardly serves as the nanoprobe for long life-time research. To address this problem, we use a strategy called “relay probe”36 to record the collisional ECL emission of different nanoparticles with time trajectory. As shown in Fig. 5c, once prior RuDSNs stick to the electrode and become deactivation, immediately following RuDSNs work instead. To demonstrate this concept, we employ a H2S-responsive dye (CouMC) to quench the ECL emission of RuDSNs (Fig. S15†).37 In the presence of CouMC, the collisional ECL intensities from different particles are all very weak. But when successively adding H2S into the solution, the intensities of freshly adherent RuDSNs quickly increase and reach plateaus (Fig. 5e and Movie S4†). The average collisional ECL intensity in each plateau is nearly proportional to the concentration of H2S (Fig. S16†). Although every RuDSN sticking to electrode shows rapidly decay with the time elapse, the “relay probe” strategy successfully avoids the deficiency by statistically analyzing successive collision events. This strategy provides a collision-based sensing platform for long life-time research.
Conclusions
In summary, the ECL microscopy provides a visualization method to dynamically study the stochastic collision electrochemistry of single nano-emitters without the interference of current and optical background. Co-localization analyses among ECL, PL, and SEM images reveal that the ECL emission is closely related to morphologies, doping amounts, particle sizes, and distances from the electrode surface, which is further confirmed by the theoretical simulations. By using this technique, we successfully trace the three dimensional collision trajectory and spatially distinguish simultaneous collision events of multiple nanoparticles, which give access to kinetic study of nanoparticles with high-throughput. Furthermore, we disclose the single-nanoparticle collision behaviours, including collision types, frequencies, and collisional ECL intensities are significantly correlated with interfacial properties, particle concentrations, and diffusion fluxes. By recording large numbers of collision events with time elapse, we develop a “relay probe” method to enable long-term observation and research. As an electrochemically triggered luminescence imaging technique, the background-free and spatiotemporally resolved ECL microscopy displays great potential for applications in single-particle electrochemical and analytical research.Experimental section
ECL with co-localization of PL microscopy set-up
As illustrated in Fig. S1,† the ECL imaging was performed on a homemade upright configuration microscope, which was established based on a weak light collecting microscope integrating the bright field, PL and ECL imaging. A water immersion objective (Olympus LUMFLN ×60, NA = 1.10) was used for collecting ECL emission. According to R = 0.61λ/NA (R is the optical resolution; λ is the emission wavelength; NA is the numerical aperture of the objective), the optical resolution of the microscope is ∼300 nm. An EMCCD camera (Photometrics, Evolve 512 Delta, 512 × 512 pixels) was used for bright field, PL and ECL imaging. A potentiostat (CHI 660D electrochemical workstation) was used to control the electrode potential with an Ag/AgCl (saturated KCl) and a Pt wire as the reference electrode and the counter electrode, respectively. The EMCCD was triggered and synchronized by the potentiostat. PL imaging was also performed on this microscope by using a mercury lamp (Nikon Intensilight C-HGFI), fluorescent filters and a dichroic mirror (Fig. S1b†). Other optical elements and optomechanical components were purchased from Thorlabs, Inc.Single-nanoparticle ECL imaging with co-localization of SEM
Prior to use, a dismountable GC electrodes (3 mm in diameter) was polished sequentially with 0.3 and 0.05 μm alumina slurry on an abrasive cloth, followed by ultrasonic cleaning with ethanol and ultrapure water thoroughly. Then the electrode was allowed to dry under a N2 flow. For co-localization analysis with SEM, the GC electrode surface was scratched by a knife to form a special pattern. Then RuDSNs (62 nm) dispersed in ethanol solution was dropped (1 μL) on the pretreated GC electrode surface. After drying in air, a three-electrode electrochemical cell made by PDMS with GC electrode working electrode (an Ag/AgCl as reference electrode and a Pt wire as the counter electrode) was mounted on a high numerical aperture water immersion objective. Subsequently, 1 mL PBS (10×, pH = 7.0) buffer containing 100 mM TPA as the coreactant was added in the electrochemical cell. After covering the microscope with a light-tight box, the ECL signal was initiated and controlled by switching an electrode voltage, and then was collected by the objective and imaged on the EMCCD. Then, a N2 flow was used to blow the electrolyte solution off the electrode surface, followed by the disassembly of the GC electrode head for SEM experiment.Imaging stochastic collision nanoelectrochemistry
To perform the collision experiment, the bare GC electrode was mounted under the water immersion objective with an Ag/AgCl as reference electrode and a Pt wire as the counter electrode. In order to remove the aggregates of RuDSNs and obtain the monodisperse RuDSNs, the RuDSNs sample was filtered by 0.22 μm ultrafiltration membranes and then centrifuged at 5000 rpm for 5 min. The transparent supernatant containing monodisperse RuDSNs was collected for the following collision experiments. The electrolyte was 200 mM PBS buffer (pH = 7.0) containing 100 mM TPA. The EMCCD was triggered and synchronized by the potentiostat when a constant voltage (1.4 V) was imposed on the GC electrode. After the current reached stability, the RuDSNs was injected into the electrolyte, and then the ECL signal from transient collisions was recorded by the EMCCD (exposure time: 0.2 s). All data processing was performed with Matlab and ImageJ software. The collisional ECL intensity meant the maximum ECL intensity of transient collision with time trajectory in all collision experiments. The distributions of statistic collision intensities, frequencies, and types were recorded in the center of CCD-view (100 μm × 100 μm).COMSOL simulation for sub-particle ECL pattern analysis
To understand the sub-particle ECL patterns of RuCSPs (90 nm, 420 nm and 1.5 μm), the finite element analyses were conducted by using COMSOL Multiphysics software (version 5.2). The component with 2D axisymmetric geometry was used in this model. The kinetic and thermodynamic parameters were obtained according to the values suggested by Miao and Sojic.30,34 The proposed model involved a large amount of diffusion of the species, charge transfer reactions at the electrode surface, and chemical reactions at the particle surface and in homogeneous solution. The Butler–Volmer formalism was used to calculate the kinetics of the charge transfer reactions. The oxidation rates were very fast so that the oxidation processes were controlled by the species diffusion. Fick equations were used to describe the flux rates of species in the electrode vicinity.Conflicts of interest
The authors declare no competing financial interest.Acknowledgements
This research is supported by the National Natural Science Foundation of China (Grants No. 21335004, 21427807 and 21605081), the Natural Science Foundation of Jiangsu Province (Grants No. BK20160638), China Postdoctoral Science Foundation (Grants No. 2016M590434, and 2017T100345), and the International Cooperation Foundation from Ministry of Science and Technology (2016YFE0130100). We thank Dr Jianbin Pan for helping build the triggering and synchronization systems between the ECL microscope and the potentiostat. We thank Dr Zengqiang Wu for helping perform the numerical simulation.References
- R. W. Murray, Nanoelectrochemistry: Metal Nanoparticles, Nanoelectrodes, and Nanopores, Chem. Rev., 2008, 108, 2688–2720 CrossRef PubMed.
- J. B. Sambur, T. Y. Chen, E. Choudhary, G. Chen, E. J. Nissen, E. M. Thomas, N. Zou and P. Chen, Sub-Particle Reaction and Photocurrent Mapping to Optimize Catalyst-Modified Photoanodes, Nature, 2016, 530, 77–80 CrossRef PubMed.
- W. Cheng and R. G. Compton, Quantifying the Electrocatalytic Turnover of Vitamin B12-Mediated Dehalogenation on Single Soft Nanoparticles, Angew. Chem., Int. Ed., 2016, 55, 2545–2549 CrossRef PubMed.
- R. Dasari, K. Tai, D. A. Robinson and K. J. Stevenson, Electrochemical Monitoring of Single Nanoparticle Collisions at Mercury-Modified Platinum Ultramicroelectrodes, ACS Nano, 2014, 8, 4539–4546 CrossRef PubMed.
- Y. Y. Peng, R. C. Qian, M. E. Hafez and Y. T. Long, Stochastic Collision Nanoelectrochemistry: A Review of Recent Developments, ChemElectroChem, 2017, 4, 977–985 CrossRef.
- D. A. Robinson, Y. Liu, M. A. Edwards, N. J. Vitti, S. M. Oja, B. Zhang and H. S. White, Collision Dynamics During the Electrooxidation of Individual Silver Nanoparticles, J. Am. Chem. Soc., 2017, 139, 16923–16931 CrossRef PubMed.
- Z. Guo, S. J. Percival and B. Zhang, Chemically Resolved Transient Collision Events of Single Electrocatalytic Nanoparticles, J. Am. Chem. Soc., 2014, 136, 8879–8882 CrossRef PubMed.
- D. A. Robinson, J. J. Yoo, A. D. Castañeda, B. Gu, R. Dasari, R. M. Crooks and K. J. Stevenson, Increasing the Collision Rate of Particle Impact Electroanalysis with Magnetically Guided Pt-Decorated Iron Oxide Nanoparticles, ACS Nano, 2015, 9, 7583–7595 CrossRef PubMed.
- E. J. E. Stuart, K. Tschulik, C. Batchelor-McAuley and R. G. Compton, Electrochemical Observation of Single Collision Events: Fullerene Nanoparticles, ACS Nano, 2014, 8, 7648–7654 CrossRef PubMed.
- T. J. Anderson and B. Zhang, Single-Nanoparticle Electrochemistry through Immobilization and Collision, Acc. Chem. Res., 2016, 49, 2625–2631 CrossRef PubMed.
- S. E. Fosdick, M. J. Anderson, E. G. Nettleton and R. M. Crooks, Correlated Electrochemical and Optical Tracking of Discrete Collision Events, J. Am. Chem. Soc., 2013, 135, 5994–5997 CrossRef PubMed.
- R. Hao, Y. Fan and B. Zhang, Imaging Dynamic Collision and Oxidation of Single Silver Nanoparticles at the Electrode/Solution Interface, J. Am. Chem. Soc., 2017, 139, 12274–12282 CrossRef PubMed.
- Y. Fang, W. Wang, X. Wo, Y. Luo, S. Yin, Y. Wang, X. Shan and N. Tao, Plasmonic Imaging of Electrochemical Oxidation of Single Nanoparticles, J. Am. Chem. Soc., 2014, 136, 12584–12587 CrossRef PubMed.
- A. N. Patel, A. Martinez-Marrades, V. Brasiliense, D. Koshelev, M. Besbes, R. Kuszelewicz, C. Combellas, G. Tessier and F. Kanoufi, Deciphering the Elementary Steps of Transport-Reaction Processes at Individual Ag Nanoparticles by 3d Superlocalization Microscopy, Nano Lett., 2015, 15, 6454–6463 CrossRef PubMed.
- V. Brasiliense, A. N. Patel, A. Martinez-Marrades, J. Shi, Y. Chen, C. Combellas, G. Tessier and F. Kanoufi, Correlated Electrochemical and Optical Detection Reveals the Chemical Reactivity of Individual Silver Nanoparticles, J. Am. Chem. Soc., 2016, 138, 3478–3483 CrossRef PubMed.
- D. M. Hercules, Chemiluminescence Resulting from Electrochemically Generated Species, Science, 1964, 145, 808–809 CrossRef PubMed.
- Z. F. Ding, B. M. Quinn, S. K. Haram, L. E. Pell, B. A. Korgel and A. J. Bard, Electrochemistry and Electrogenerated Chemiluminescence from Silicon Nanocrystal Quantum Dots, Science, 2002, 296, 1293–1297 CrossRef PubMed.
- F. R. Fan and A. J. Bard, Observing Single Nanoparticle Collisions by Electrogenerated Chemiluminescence Amplification, Nano Lett., 2008, 8, 1746–1749 CrossRef PubMed.
- J. E. Dick, C. Renault, B. K. Kim and A. J. Bard, Simultaneous Detection of Single Attoliter Droplet Collisions by Electrochemical and Electrogenerated Chemiluminescent Responses, Angew. Chem., Int. Ed., 2014, 53, 11859–11862 CrossRef PubMed.
- F. R. F. Fan, S. Park, Y. Zhu, R. S. Ruoff and A. J. Bard, Electrogenerated Chemiluminescence of Partially Oxidized Highly Oriented Pyrolytic Graphite Surfaces and of Graphene Oxide Nanoparticles, J. Am. Chem. Soc., 2009, 131, 937–939 CrossRef PubMed.
- Y. Chang, R. E. Palacios, F. R. Fan, A. J. Bard and P. F. Barbara, Electrogenerated Chemiluminescence of Single Conjugated Polymer Nanoparticles, J. Am. Chem. Soc., 2008, 130, 8906–8907 CrossRef PubMed.
- F. Deiss, C. N. LaFratta, M. Symer, T. M. Blicharz, N. Sojic and D. R. Walt, Multiplexed Sandwich Immunoassays Using Electrochemiluminescence Imaging Resolved at the Single Bead Level, J. Am. Chem. Soc., 2009, 131, 6088–6089 CrossRef PubMed.
- G. Valenti, S. Scarabino, B. Goudeau, A. Lesch, M. Jović, E. Villani, M. Sentic, S. Rapino, S. Arbault, F. Paolucci and N. Sojic, Single Cell Electrochemiluminescence Imaging: From the Proof-of-Concept to Disposable Device-Based Analysis, J. Am. Chem. Soc., 2017, 139, 16830–16837 CrossRef PubMed.
- S. Pan, J. Liu and C. M. Hill, Observation of Local Redox Events at Individual Au Nanoparticles Using Electrogenerated Chemiluminescence Microscopy, J. Phys. Chem. C, 2015, 119, 27095–27103 CrossRef.
- A. J. Wilson, K. Marchuk and K. A. Willets, Imaging Electrogenerated Chemiluminescence at Single Gold Nanowire Electrodes, Nano Lett., 2015, 15, 6110–6115 CrossRef PubMed.
- M. J. Zhu, J. B. Pan, Z. Q. Wu, X. Y. Gao, W. Zhao, X. H. Xia, J. J. Xu and H. Y. Chen, Electrogenerated Chemiluminescence Imaging of Electrocatalysis at a Single Au-Pt Janus Nanoparticle, Angew. Chem., Int. Ed., 2018, 57, 1–6 CrossRef.
- L. Qian and X. R. Yang, One-Step Synthesis of Ru(2,2′-Bipyridine)3cl2-Immobilized Silica Nanoparticles for Use in Electrogenerated Chemiluminescence Detection, Adv. Funct. Mater., 2007, 17, 1353–1358 CrossRef.
- L. H. Zhang and S. J. Dong, Electrogenerated Chemiluminescence Sensors Using Ru(Bpy)(3)(2+) Doped in Silica Nanoparticles, Anal. Chem., 2006, 78, 5119–5123 CrossRef PubMed.
- S. Zanarini, E. Rampazzo, L. D. Ciana, M. Marcaccio, E. Marzocchi, M. Montalti, F. Paolucci and L. Prodi, Ru(Bpy)3 Covalently Doped Silica Nanoparticles as Multicenter Tunable Structures for Electrochemiluminescence Amplification, J. Am. Chem. Soc., 2009, 131, 2260–2267 CrossRef PubMed.
- W. Miao, J. P. Choi and A. J. Bard, Electrogenerated Chemiluminescence 69: The Tris(2,2'-Bipyridine)Ruthenium(II), (Ru(Bpy)3(2+))/Tri-N-Propylamine (Tpra) System Revisited-a New Route Involving Tpra*+ Cation Radicals, J. Am. Chem. Soc., 2002, 124, 14478–14485 CrossRef PubMed.
- Y. Zu and A. J. Bard, Electrogenerated Chemiluminescence. 66. The Role of Direct Coreactant Oxidation in the Ruthenium Tris(2,2')Bipyridyl/Tripropylamine System and the Effect of Halide Ions on the Emission Intensity, Anal. Chem., 2000, 72, 3223–3232 CrossRef PubMed.
- Z. F. Chen and Y. B. Zu, Electrogenerated Chemiluminescence of the Tris(2,2'-Bipyridine)Ruthenium(II)/Tri-N-Propylamine (Tpra) System: Crucial Role of the Long Lifetime of Tpra(Center Dot+) Cation Radicals Suggested by Electrode Surface Effects, J. Phys. Chem. C, 2008, 112, 16663–16667 CrossRef.
- K. Imai, G. Valenti, E. Villani, S. Rapino, E. Rampazzo, M. Marcaccio, L. Prodi and F. Paolucci, Numerical Simulation of Doped Silica Nanoparticle Electrochemiluminescence, J. Phys. Chem. C, 2015, 119, 26111–26118 CrossRef.
- M. Sentic, M. Milutinovic, F. Kanoufi, D. Manojlovic, S. Arbault and N. Sojic, Mapping Electrogenerated Chemiluminescence Reactivity in Space: Mechanistic Insight into Model Systems Used in Immunoassays, Chem. Sci., 2014, 5, 2568–2572 RSC.
- S. J. Kwon, H. Zhou, F. R. F. Fan, V. Vorobyev, B. Zhang and A. J. Bard, Stochastic Electrochemistry with Electrocatalytic Nanoparticles at Inert Ultramicroelectrodes-Theory and Experiments, Phys. Chem. Chem. Phys., 2011, 13, 5394–5402 RSC.
- Z. Chen, J. Li, X. Chen, J. Cao, J. Zhang, Q. Min and J. J. Zhu, Single Gold@Silver Nanoprobes for Real-Time Tracing the Entire Autophagy Process at Single-Cell Level, J. Am. Chem. Soc., 2015, 137, 1903–1908 CrossRef PubMed.
- C. Ma, W. Wu, Y. Peng, M. X. Wang, G. Chen, Z. Chen and J. J. Zhu, A Spectral Shift-Based Electrochemiluminescence Sensor for Hydrogen Sulphide, Anal. Chem., 2018, 90, 1334–1339 CrossRef PubMed.
Footnote |
| † Electronic supplementary information (ESI) available: Additional experimental sections and more discussions (PDF). ECL imaging of four immobilized RuDSNs during a CV scanning (AVI). 3D motion trajectory during an elastic collision (AVI). Imaging simultaneous sticking collisions of three nanoparticles (AVI). Relay probes based on successive collision events (AVI). See DOI: 10.1039/c8sc02251h |
| This journal is © The Royal Society of Chemistry 2018 |

