 Open Access Article
Facile room temperature synthesis of large graphene sheets from simple molecules†
Laís C.
Lopes
a,
Lidya C.
da Silva
b,
Boniek G.
Vaz
b,
Alfredo R. M.
Oliveira
a,
Marcela M.
Oliveira
c,
Maria L. M.
Rocco
d,
Elisa S.
Orth
 a and
Aldo J. G.
Zarbin
 *a
*a
aDepartment of Chemistry, Universidade Federal do Paraná (UFPR), CEP 81531-980, CP 19032, Curitiba, PR, Brazil. E-mail: aldozarbin@ufpr.br
bUniversidade Federal de Goiás, Campus Samambaia, Instituto de Química, Avenida Esperança, s/n Campus Universitário, 74690-900, Goiânia, GO, Brazil
cDepartment of Chemistry and Biology, Universidade Tecnológica Federal do Paraná (UTFPR), CEP 81280-340, Curitiba, PR, Brazil
dInstitute of Chemistry, Federal University of Rio de Janeiro (UFRJ), 21.941-909, Rio de Janeiro, RJ, Brazil
First published on 14th August 2018
Abstract
The largest graphene sample obtained through a chemical reaction under ambient conditions (temperature and pressure), using simple molecules such as benzene or n-hexane as precursors, is reported. Starting from a heterogeneous reaction between solid iron chloride and the molecular precursor (benzene and n-hexane) at a water/oil interface, graphene sheets with micrometric lateral size are obtained as a film deposited at the liquid/liquid (L/L) interface. The pathway involving the cyclization and aromatization of n-hexane to benzene at the L/L interface, and the sequence of conversion of benzene to biphenyl and biphenyl to condensed rings (which originates the graphene structures) was followed by different characterization techniques and a mechanistic proposal is presented. Finally, we demonstrate that this route can be extended for the synthesis of N-doped graphene, using pyridine as the molecular precursor.
Introduction
Graphene, a two-dimensional monolayer of sp2-hybridized carbon atoms, has been one of the most celebrated materials in recent years, due to its exceptional and intriguing properties, which makes it a promising material for application in different fields.1–6 One of the most important issues in graphene research is related to the fabrication method, because it has strong influence on the resulting structure (and consequently properties) of the obtained material. Characteristics such as the presence (or not) of defects and heteroatoms, the number of stacked sheets (mono-, bi-, tri- or multi-layers), edge chirality control and lateral extension of graphene are strongly dependent on the preparation route.7,8 Nowadays, graphene can be obtained through either top down (chemical, sonochemical, electrochemical, mechanical or mechanochemical exfoliation of graphite9–14) or bottom up (chemical vapour deposition-CVD,15,16 electrical arc,17,18 epitaxial growth on SiC,19,20 carbon nanotube unzipping21,22 and chemical synthesis from molecular precursors23–26) approaches.The most used bottom up route to graphene is based on CVD, which yields large-area graphene obtained through the thermal decomposition at high temperatures of different molecular precursors over metallic substrates.27–30 Although enormous progress has been made towards graphene's production by the CVD route,31–34 it involves a high temperature, non-ambient atmosphere, and it doesn't allow the direct growth over non-metallic substrates (which requires the development of techniques to remove graphene from the metallic substrate followed by transference to another substrate, causing contamination and damage to the graphene film).27,35,36
Chemical synthesis, in which graphene is obtained under room conditions (temperature, pressure and atmosphere) starting from organic molecules as the precursor, could be an important bottom-up alternative to overcome that and other problems.37 The current protocol is normally based on the oxidative cyclodehydrogenation of oligo- and polyphenylenes.38 However, in spite of the numerous efforts towards this direction, the chemical synthesis of large (micrometric) graphene sheets has never been reported. The main difficulty in producing a large graphene sample by this methodology is that the product becomes insoluble as it starts to grow, stopping the in-solution chemical reaction.39 Several improvements have been reported on the chemical synthesis of nanographene, mainly to prepare the so-called graphene nanoribbons (GNRs), which are high aspect-ratio graphene units with widths up to 10 nm and lengths up to 600 nm.40–42 The main breakthrough was the development of the surface-assisted covalent synthesis, which involves a multi-step conversion of complex molecules on controlled metallic surfaces.43,44 This strategy often requires the use of high temperatures and special metallic substrates, as well as the design of complex organic molecules used as precursors (which requires sophisticated previous organic synthesis efforts).
Recently some of us demonstrated that the chemical reaction carried out at immiscible liquid/liquid (L/L) interfaces can overcome several of these issues, and demonstrated that benzene could be first polymerized and further converted to graphene in L/L environments.26 Here, we report a rapid, unique, easy and efficient route to obtain the largest graphene sheet chemically synthesized ever reported (micrometric lateral size), starting from simple hydrocarbon molecules (benzene and n-hexane) at room temperature, atmosphere and pressure. The strategy is based on a heterogeneous reaction between the organic precursor and solid iron chloride, at an aqueous/organic solvent L/L interface. A complete characterization of the side-products is also presented. Finally, we demonstrate that this route can be extended for the synthesis of N-doped graphene, using pyridine as the molecular precursor.
Results and discussion
The synthetic procedure is carried out in a 50 mL round-flask in which a water/oil L/L interface is created, adding 10 mL of milli-Q deionized water and 10 mL of organic solvent. The detailed experimental procedure is presented in the ESI.† Three different samples will be initially discussed here, based on three aqueous/oil L/L interfaces: neat benzene (originating the sample GR-BZ), a benzene solution in n-hexane (1 μL of benzene in 10 mL of n-hexane, originating the sample GR-BZ/HX) and neat n-hexane (sample GR-HX). The system was maintained under magnetic stirring (1000 rpm) and a total of 2.0 g of solid anhydrous FeCl3 (previously dried under vacuum at 120 °C for 3 h) was slowly added to the system in 20 portions of 100 mg, every 2 min. The system was kept under magnetic stirring at room temperature for 3 h, after which the stirring was interrupted and a grey film was self-assembled at the L/L interface. After several procedures of washing and cleaning, the film was transferred to a flat substrate (glass or Si), Fig. S1.†45–47
Fig. 1 shows representative Raman spectra of the samples. More than 30 different spectra have been collected at different regions of each sample (the spatial resolution of the Raman spectrophotometer is 1 μm2). The results indicate the predominance of two different spectral profiles, where the representative spectra of each one are illustrated in Fig. 1. For all samples, the spectral profile represented by the curves in the left side of Fig. 1 has the signature of graphene and sp2-based carbonaceous material: a sharp band at approximately 1580 cm−1 (G band, the C![[double bond, length as m-dash]](https://www.rsc.org/images/entities/char_e001.gif) C stretching mode); a band at approximately 1338 cm−1 (D band, an inactive in-plane mode that becomes active due the presence of defects in a disordered structure); and a band at approximately 2660 cm−1 (the second-order Raman signal known as the 2D band).48,49 More detailed data extracted from the Raman spectra (ID/IG ratio, LD and LA) are presented and discussed in Table S1.† Also, the analysis of the 2D band of the spectra indicates the presence of mono-, bi- and multi-layer graphene, but the majority is bilayers in our sample (details in the ESI and Fig. S2†).
C stretching mode); a band at approximately 1338 cm−1 (D band, an inactive in-plane mode that becomes active due the presence of defects in a disordered structure); and a band at approximately 2660 cm−1 (the second-order Raman signal known as the 2D band).48,49 More detailed data extracted from the Raman spectra (ID/IG ratio, LD and LA) are presented and discussed in Table S1.† Also, the analysis of the 2D band of the spectra indicates the presence of mono-, bi- and multi-layer graphene, but the majority is bilayers in our sample (details in the ESI and Fig. S2†).
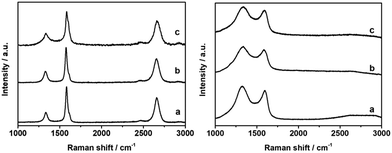 | ||
| Fig. 1 Representative Raman spectra collected at different regions of the samples GR-BZ (a), GR-BZ/HX (b) and GR-HX (c). | ||
The other Raman profile found in all samples illustrated by the spectra presented on the right side in Fig. 1 is characterized by a broadening of both the G and D bands, a high intensity of the D band (more intense than the G one) and the absence of the 2D band, typical profile of amorphous carbon, which means that the samples are constituted by both graphene and amorphous carbon. Hematite (Fe2O3) and magnetite (Fe3O4) Raman signals were also detected in some regions of the samples (Fig. S3†).
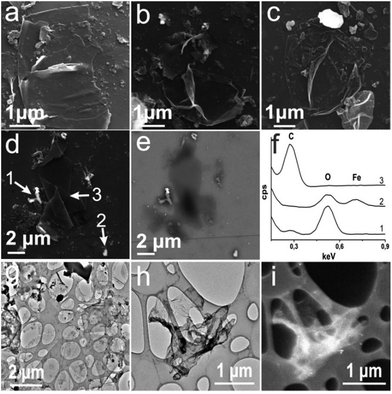
Fig. 2(a–c) show the Scanning Electron Microscopy (SEM) images of the films. The morphology of the samples is very similar, and the large graphene sheets can clearly be seen, with a lateral size in the order of micrometers. In several SEM images (Fig. 2, S4 and S5†), both flat and crumpled graphene sheets have been observed, always mixed with other morphologies like aggregated species, some of them with high brightness. The joint analysis of the SEM images collected from both secondary and backscattered (BS) electrons, combined with the EDS spectra, has proved to be an effective tool to elucidate these morphologies. Fig. 2d shows a SEM image collected using secondary electrons of the sample GR-BZ/HX, and Fig. 2e shows the same field obtained using a BS electron detector. Bright regions in the BS image will correspond to regions containing the heaviest elements, because they are more efficient to scatter the primary electron beam. Comparing the images presented in Fig. 2d and e, we can suppose that the brightest morphologies in Fig. 2d correspond to species containing residual iron species, and the opaque non-graphene morphologies in the BS image correspond to amorphous carbon. This attribution is corroborated by the punctual EDS spectra (Fig. 2f) indicating the distribution of Fe, C and O in each point of Fig. 2d: only carbon at point 3 (graphene sheet); Fe and O at point 2 (bright region in the BS image due to the presence of the heaviest Fe); and C and O at point 1 (non-graphene and no bright-region in the BS image, associated with amorphous carbon). The BS/SEM images and the EDS punctual spectra of the other samples are presented in the ESI (Fig. S4 and S5†). It is noticeable that the oxygen is apparently associated with the regions containing iron and with amorphous carbon, and absent on the graphene sheets.
Fig. 2g–i show representative Transmission Electron Microscopy (TEM) images of the sample GR-BZ, in which a large and flat graphene sheet can clearly be seen in the centre of Fig. 2g, together with other morphologies associated with the side-products described before. Fig. 2h shows a large and isolated crumpled graphene sheet, in which the high brightness in the dark field image (Fig. 2i) demonstrates the crystalline nature of graphene, which was also confirmed by electron diffraction data (Fig. S6†).50
The AFM images of the samples over Si/SiO2 substrates are shown in Fig. 3. The presence of large graphene sheets, as well as fragments with nanometric lateral size, is evident. The height profiles associated with each image demonstrates thickness ranging from 0.9 to 3.9 nm, characteristic of mono- bi- and few-layer graphene. Combining several SEM and AFM images of each sample, it was possible to elaborate the size histograms of the graphene produced, Fig. S7.† Impressive average areas have been obtained: 3.5 μm2 by a simple arithmetic mean; 1.5 μm2 by a lognormal Gaussian fitting of the histograms; approximately 43% of the sheets have an area higher than 2 μm2 and 31% higher than 3 μm2, with some sheets growing until 10 μm2.
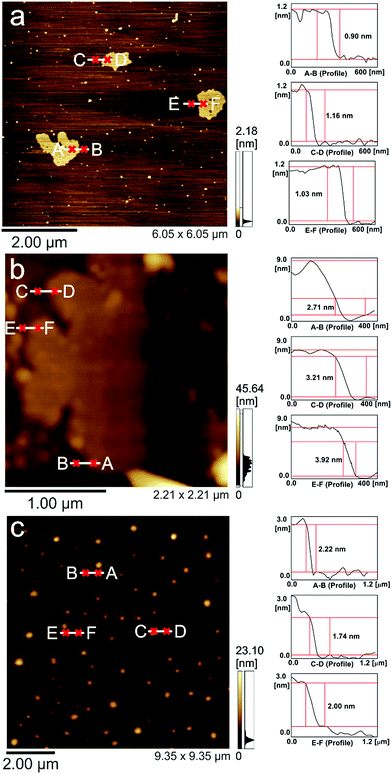 | ||
| Fig. 3 AFM topographical images (left) and the respective height curves (right) of the samples GR-BZ (a), GR-BZ/HX (b) and GR-HX (c). | ||
The nature of the iron species in the samples was elucidated by Raman (Fig. S3†) and X-ray diffractometry (Fig. S8†). All samples presented characteristic peaks associated with both hematite (α-Fe2O3) and magnetite (Fe3O4). The occurrence of Fe2+ (magnetite) in a sample produced under an oxidative atmosphere and starting from FeCl3 gives important information regarding the reaction mechanism, as will be discussed later. The atomic percentages of Fe2+ and Fe3+ calculated by X-ray photoelectron spectroscopy (XPS) for the sample GR-BZ was 56/44. In order to guarantee the accuracy of the Fe2+/Fe3+ ratio in the sample GR-BZ, it was analysed by XPS as-prepared, after only the cleaning process, and without any treatment to remove the iron oxide.
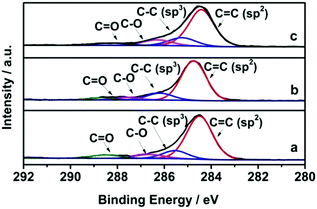
The high-resolution XPS spectra in the C1s region are presented in Fig. 4. The spectra are composed of peaks at 284.5 eV, characteristic of C![[double bond, length as m-dash]](https://www.rsc.org/images/entities/char_e001.gif) C (sp2) of both the graphene structure and sp2-hybridized C atoms present in the amorphous carbon, and peaks at 285.5, 286.6 and 288.6 eV, characteristic of C–C (sp3), C–O (sp3) and C
C (sp2) of both the graphene structure and sp2-hybridized C atoms present in the amorphous carbon, and peaks at 285.5, 286.6 and 288.6 eV, characteristic of C–C (sp3), C–O (sp3) and C![[double bond, length as m-dash]](https://www.rsc.org/images/entities/char_e001.gif) O (sp2), respectively.51,52 These last ones are associated with the amorphous carbon in the sample. The atomic percentage of the samples is presented in Table S2.† It is noticeable that the fraction of carbon with sp2 hybridization in the samples is around 75%, including the sample obtained from n-hexane as the precursor.
O (sp2), respectively.51,52 These last ones are associated with the amorphous carbon in the sample. The atomic percentage of the samples is presented in Table S2.† It is noticeable that the fraction of carbon with sp2 hybridization in the samples is around 75%, including the sample obtained from n-hexane as the precursor.
So far the results presented here leave no doubt regarding the effectiveness of the proposed method and show the astonishing conversion of a simple aliphatic molecule such as n-hexane to graphene under mild conditions. There are no similar reports in the literature, related to such large graphene sheets obtained in a simple experiment, at room temperature and atmosphere, starting from simple molecules such as benzene or n-hexane. The product of the reaction is, in fact, a nanocomposite between graphene, amorphous carbon and iron oxide (the fraction of each component was estimated by thermogravimetric analysis, Fig. S9 and discussion in the ESI.† Considering only the carbon-based portion, the sample GR-BZ is composed of 58% graphene and 42% amorphous carbon). We performed several experiments to understand the mechanism of the reaction, as will be discussed in the following.
Our previous report on the synthesis of graphene starting from benzene was based on the systematic work of Kovacic et al.,53,54 in which benzene was first polymerized to poly-paraphenylene (PPP), which was stabilized at an L/L interface, and under excess of benzene and water, it was converted to graphene.26 This approach yielded graphene mixed with excess of PPP and other species that were not fully characterized. The route described here produces graphene directly from benzene without the previous benzene-to-PPP polymerization. A key point to be considered is the role of water. We performed the experiments under exactly the same experimental conditions with benzene and without water, and only PPP (no graphene) has been obtained, Fig. S10.† Also, the same experiment carried out at an ethileneglycol/benzene L/L interface, without water, produced only PPP (no graphene), meaning that water is essential for graphene production due its chemical properties (and not only to guarantee the L/L immiscible interface).
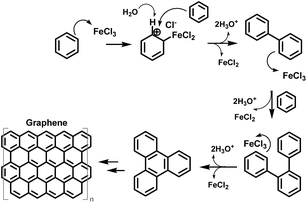
The proposed mechanism of benzene to graphene conversion is schematically represented in Fig. 5, and it is based on an electrophilic aromatic substitution reaction, in which the benzene acts as a nucleophile attacking the FeCl3 and originating a carbocation. In the following the carbocation reacts with another benzene ring. Here, the water acts as a base, and it is responsible for catching the hydrogen, releasing the reduced iron. The electron pair will regenerate the chemical bond in the benzene ring, generating biphenyl species. The biphenyl is more reactive than the benzene and the chemical reaction continues with the generation of another carbocation at the biphenyl unit, incorporating another benzene ring, at the ortho-position, and finally, the same process occurs in the 3-ring molecule to regenerate aromaticity, originating condensed domains that will be the seeds for the graphene growth, through successive electrophilic aromatic substitution reaction steps. This proposed mechanism explains the large amount of Fe2+ obtained in the final product. Also, it explains the crucial role of water, acting as a base. In the case of n-hexane, cyclization to benzene occurs (as will be demonstrated in the following), and should follow an analogous mechanism.
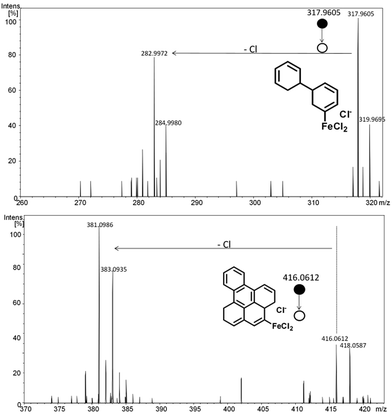
An experiment with a L/L biphasic system using triethylamine/benzene (no water) was carried and the result was the same: a grey film was formed at the interface characterized as graphene (Fig. S11†), confirming that any strong Lewis base (and not only water) can be used, corroborating the mechanism proposed in Fig. 5. Another key analysis was to evaluate the organic phase remaining after the reaction by gas chromatography coupled to mass spectrometry (GC-MS). The chromatograms obtained from the organic phase of the samples GR-BZ and GR-HX are shown in Fig. S12,† along with the solvents (benzene and n-hexane). One important peak could be identified in the chromatogram of GR-BZ and GR-HX at a retention time of 17.7 min with a molecular ion of m/z = 154. The fragmentation pattern of this peak (shown in ESI, Fig. S13†) strongly agrees with the structure of biphenyl,55 a key species in the proposed mechanism. Other aromatic polynuclear species were not observed due to their known difficult detection by GC-MS ionization. Interestingly enough, for GR-HX the same peak attributed to biphenyl was detected at 16.3 min (Fig. S14 and S15†). The difference in retention time is due to the column change but its characteristic fragmentation pattern was also observed, confirming the proposed oxidative cyclization. In order to further confirm that biphenyl is formed in the synthesis using n-hexane and not only due to some residue/impurity of benzene, the organic phase was distilled and reused in a consecutive reaction. The chromatograms for all these steps were obtained (Fig. S14†) and evidence that upon distillation of the residual n-hexane in the synthesis, the signal due to biphenyl disappears, as expected. This distilled residual n-hexane is then used in another synthesis of GR-HX and the peak of biphenyl appears again, indicating that biphenyl is indeed formed during the reaction. Another interesting analysis was carried out with the GR-HX sample by electrospray ionization quadrupole time-of-flight mass spectrometry (ESI-MS). Two signals of m/z = 318 and 416 were detected (acquired and isotopic-simulated spectra are given in ESI, Fig. S16 and S17†) that upon collision of 13 eV gave the ESI-MS/MS(−) shown in Fig. 6. The species fragmentation (loss of Cl−) agrees with the mechanism proposed for n-hexane. Hence, the simple small molecule n-hexane can cyclize consecutively under mild conditions, leading to graphene. The cyclization and aromatization of n-hexane under such mild conditions is a very important result, with significance that transcends this work. This process has been described in the literature employing heterogeneous catalysis and high temperatures.56–59 Here, the solid FeCl3 acts as both a strong oxidizing agent (potential ∼ 2.0 V) and a catalyst in successive dehydrogenation and cyclization oxidative reactions.
Finally, the broadness of the method was verified using a solution of pyridine in n-hexane as an organic phase, aiming for the direct synthesis of N-doped graphene (sample GR-PY). Graphene formation was confirmed by SEM, TEM and Raman data (Fig. 7). The Raman spectrum of sample GR-PY presented in Fig. 7c shows a higher ID/IG ratio compared to GR-BZ/HX, indicating a higher degree of defects, as expected for doped graphene samples. A small blue shift (from 1580 to 1583 cm−1) observed in the G band for this sample is also indicative of N-doping. The survey XPS spectrum (Fig. S18†) indicates 2.3% nitrogen in this sample. The high-resolution XPS spectrum in the N1s region (Fig. 7d) presents peaks at 399.1, 400.2 and 401.6 eV, due to the pyridinic-, graphitic- and oxidized-nitrogen, directly associated with substituted N in the graphene structure.60,61
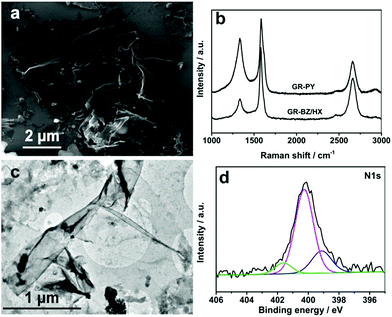 | ||
| Fig. 7 SEM image (a); Raman spectra (b); TEM image (c); and N1s XPS spectra (d) of the sample GR-PY. In (b) the Raman of the sample GR-BZ/HX is shown together for comparison. | ||
Conclusions
In conclusion, we demonstrate a systematization of a simple, cheap, innovative, efficient and reproducible way to chemically produce graphene, starting from simple molecules. Taking advantage of the unique chemical environment at different water/oil interfaces and of the high-oxidation potential of solid iron chloride, we presented the synthesis of graphene with micrometric lateral sizes and demonstrated the mechanism to convert either benzene or n-hexane to graphene, starting from an electrophilic aromatic substitution reaction. The potentiality of the route is enormous, once different combinations of liquids/liquids can be designed, aiming for graphene with particular characteristics, as also demonstrated in this work for the N-doped graphene prepared from pyridine. Besides the novelties of the preparation of graphene itself, the route also suppresses an important technological issue associated with the application of graphene, which is the transfer process. Here the product is obtained directly at an L/L interface as a thin film, which can be easily transferred to any kind of ordinary substrate (including successive depositions originating films with more than one layer and controlled thickness and transparency), which means that both the synthesis and the processing of this important material are solved together, in a one-pot and one-step reaction. Finally, although the obtained sample presents impurities (adjustments and optimization of the process aiming neat graphene are expected to be done, including post-synthesis treatments for both amorphous carbon and iron oxide removal), the sample can be considered as a nanocomposite between the three components (graphene, amorphous carbon and the iron oxides hematite and magnetite), which adds novel functionalities and possibilities of application.Conflicts of interest
There are no conflicts to declare.Acknowledgements
The authors acknowledge the financial support of CNPq, CAPES, Fundação Araucária, INCT-Nanocarbon and L'Oreal-UNESCO-ABC; CME-UFPR for the TEM images; Prof. P. H. G. Zarbin, D. Szczerbowski, K. M. Inoue and C. M. B. Gomes for the GC-MS data. L. C. L thanks CAPES for the fellowship.Notes and references
- A. K. Geim and K. S. Novoselov, Nat. Mater., 2007, 6, 183 CrossRef PubMed.
- S. S. Varghese, S. Lonkar, K. K. Singh, S. Swaminathan and A. Abdala, Sens. Actuators, B, 2015, 218, 160–183 CrossRef.
- R. Raccichini, A. Varzi, S. Passerini and B. Scrosati, Nat. Mater., 2015, 14, 271–279 CrossRef PubMed.
- G. Reina, J. M. Gonzalez-Dominguez, A. Criado, E. Vazquez, A. Bianco and M. Prato, Chem. Soc. Rev., 2017, 46, 4400–4416 RSC.
- L. Gomez De Arco, Y. Zhang, C. W. Schlenker, K. Ryu, M. E. Thompson and C. Zhou, ACS Nano, 2010, 4, 2865–2873 CrossRef PubMed.
- L. Hostert, S. F. Blaskievicz, J. E. S. Fonsaca, S. H. Domingues, A. J. G. Zarbin and E. S. Orth, J. Catal., 2017, 356, 75–84 CrossRef.
- K. S. Novoselov, V. I. Fal′ko, L. Colombo, P. R. Gellert, M. G. Schwab and K. Kim, Nature, 2012, 490, 192 CrossRef PubMed.
- S. Eigler and A. Hirsch, Angew. Chem., Int. Ed. Engl., 2014, 53, 7720–7738 CrossRef PubMed.
- K. S. Novoselov, A. K. Geim, S. V. Morozov, D. Jiang, Y. Zhang, S. V. Dubonos, I. V. Grigorieva and A. A. Firsov, Science, 2004, 306, 666–669 CrossRef PubMed.
- R. V. Salvatierra, S. H. Domingues, M. M. Oliveira and A. J. G. Zarbin, Carbon, 2013, 57, 410–415 CrossRef.
- G. Bepete, F. Hof, K. Huang, K. Kampioti, E. Anglaret, C. Drummond and A. Pénicaud, Phys. Status Solidi RRL, 2016, 10, 895–899 CrossRef.
- S. Park and R. S. Ruoff, Nat. Nanotechnol., 2009, 4, 217 CrossRef PubMed.
- K. Parvez, S. Yang, X. Feng and K. Müllen, Synth. Met., 2015, 210, 123–132 CrossRef.
- P. Yu, S. E. Lowe, G. P. Simon and Y. L. Zhong, Curr. Opin. Colloid Interface Sci., 2015, 20, 329–338 CrossRef.
- X. Li, W. Cai, J. An, S. Kim, J. Nah, D. Yang, R. Piner, A. Velamakanni, I. Jung and E. Tutuc, Science, 2009, 324, 1312–1314 CrossRef PubMed.
- C.-M. Seah, S.-P. Chai and A. R. Mohamed, Carbon, 2014, 70, 1–21 CrossRef.
- K. S. Subrahmanyam, L. S. Panchakarla, A. Govindaraj and C. N. R. Rao, J. Phys. Chem. C, 2009, 113, 4257–4259 CrossRef.
- Z.-S. Wu, W. Ren, L. Gao, J. Zhao, Z. Chen, B. Liu, D.-M. Tang, B. Yu, C. Jiang and H.-M. Cheng, ACS Nano, 2009, 3, 411–417 CrossRef PubMed.
- P. Sutter, Nat. Mater., 2009, 8, 171–172 CrossRef PubMed.
- A. Mojtaba, M. Jennifer, L.-D. Josh, I. Francesca and M. Nunzio, Nanotechnology, 2017, 28, 345602 CrossRef PubMed.
- D. V. Kosynkin, A. L. Higginbotham, A. Sinitskii, J. R. Lomeda, A. Dimiev, B. K. Price and J. M. Tour, Nature, 2009, 458, 872–876 CrossRef PubMed.
- D. Torres, J. L. Pinilla and I. Suelves, Appl. Surf. Sci., 2017, 424, 101–110 CrossRef.
- L. Chen, Y. Hernandez, X. Feng and K. Mullen, Angew. Chem., Int. Ed. Engl., 2012, 51, 7640–7654 CrossRef PubMed.
- A. Narita, X.-Y. Wang, X. Feng and K. Mullen, Chem. Soc. Rev., 2015, 44, 6616–6643 RSC.
- C. D. Simpson, J. D. Brand, A. J. Berresheim, L. Przybilla, H. J. Räder and K. Müllen, Chem.–Eur. J., 2002, 8, 1424–1429 CrossRef.
- R. V. Salvatierra, V. H. R. Souza, C. F. Matos, M. M. Oliveira and A. J. G. Zarbin, Carbon, 2015, 93, 924–932 CrossRef.
- X. Li, L. Colombo and R. S. Ruoff, Adv. Mater., 2016, 28, 6247–6252 CrossRef PubMed.
- Y. Liu and Y. Chen, J. Appl. Phys, 2016, 119, 103301 CrossRef.
- W. Fang, A. L. Hsu, Y. Song and J. Kong, Nanoscale, 2015, 7, 20335–20351 RSC.
- X. Zang, Q. Zhou, J. Chang, K. S. Teh, M. Wei, A. Zettl and L. Lin, Adv. Mater. Interfaces, 2017, 4, 1600783 CrossRef.
- Z.-Y. Juang, C.-Y. Wu, A.-Y. Lu, C.-Y. Su, K.-C. Leou, F.-R. Chen and C.-H. Tsai, Carbon, 2010, 48, 3169–3174 CrossRef.
- A. Guermoune, T. Chari, F. Popescu, S. S. Sabri, J. Guillemette, H. S. Skulason, T. Szkopek and M. Siaj, Carbon, 2011, 49, 4204–4210 CrossRef.
- M. Son and M.-H. Ham, FlatChem, 2017, 5, 40–49 CrossRef.
- N. Lisi, T. Dikonimos, F. Buonocore, M. Pittori, R. Mazzaro, R. Rizzoli, S. Marras and A. Capasso, Sci. Rep., 2017, 7, 9927 CrossRef PubMed.
- C. Shen, Y. Jia, X. Yan, W. Zhang, Y. Li, F. Qing and X. Li, Carbon, 2018, 127, 676–680 CrossRef.
- I. H. Abidi, Y. Liu, J. Pan, A. Tyagi, M. Zhuang, Q. Zhang, A. A. Cagang, L. T. Weng, P. Sheng, W. A. Goddard and Z. Luo, Adv. Funct. Mater., 2017, 27, 1700121 CrossRef.
- L. Zhi and K. Müllen, J. Mater. Chem., 2008, 18, 1472 RSC.
- Y. Segawa, H. Ito and K. Itami, Nat. Rev. Mater., 2016, 1, 15002 CrossRef.
- C. D. Simpson, G. Mattersteig, K. Martin, L. Gherghel, R. E. Bauer, H. J. Räder and K. Müllen, J. Am. Chem. Soc., 2004, 126, 3139–3147 CrossRef PubMed.
- Y. Z. Tan, B. Yang, K. Parvez, A. Narita, S. Osella, D. Beljonne, X. Feng and K. Mullen, Nat. Commun., 2013, 4, 2646 CrossRef PubMed.
- M. G. Schwab, A. Narita, Y. Hernandez, T. Balandina, K. S. Mali, S. De Feyter, X. Feng and K. Mullen, J. Am. Chem. Soc., 2012, 134, 18169–18172 CrossRef PubMed.
- A. Narita, X. Feng, Y. Hernandez, S. A. Jensen, M. Bonn, H. Yang, I. A. Verzhbitskiy, C. Casiraghi, M. R. Hansen, A. H. Koch, G. Fytas, O. Ivasenko, B. Li, K. S. Mali, T. Balandina, S. Mahesh, S. De Feyter and K. Mullen, Nat. Chem., 2014, 6, 126–132 CrossRef PubMed.
- X. Yang, X. Dou, A. Rouhanipour, L. Zhi, H. J. Räder and K. Müllen, J. Am. Chem. Soc., 2008, 130, 4216–4217 CrossRef PubMed.
- L. Talirz, P. Ruffieux and R. Fasel, Adv. Mater., 2016, 28, 6222–6231 CrossRef PubMed.
- V. H. R. Souza, S. Husmann, E. G. C. Neiva, F. S. Lisboa, L. C. Lopes, R. V. Salvatierra and A. J. G. Zarbin, Electrochim. Acta, 2016, 197, 200–209 CrossRef.
- R. V. Salvatierra, M. M. Oliveira and A. J. G. Zarbin, Chem. Mater., 2010, 22, 5222–5234 CrossRef.
- S. H. Domingues, R. V. Salvatierra, M. M. Oliveira and A. J. Zarbin, Chem. Commun., 2011, 47, 2592–2594 RSC.
- D. Graf, F. Molitor, K. Ensslin, C. Stampfer, A. Jungen, C. Hierold and L. Wirtz, Nano Lett., 2007, 7, 238–242 CrossRef PubMed.
- L. M. Malard, M. A. Pimenta, G. Dresselhaus and M. S. Dresselhaus, Phys. Rep., 2009, 473, 51–87 CrossRef.
- G. Bepete, E. Anglaret, L. Ortolani, V. Morandi, K. Huang, A. Pénicaud and C. Drummond, Nat. Chem., 2016, 9, 347 CrossRef PubMed.
- J. Campos-Delgado, J. M. Romo-Herrera, X. Jia, D. A. Cullen, H. Muramatsu, Y. A. Kim, T. Hayashi, Z. Ren, D. J. Smith, Y. Okuno, T. Ohba, H. Kanoh, K. Kaneko, M. Endo, H. Terrones, M. S. Dresselhaus and M. Terrones, Nano Lett., 2008, 8, 2773–2778 CrossRef PubMed.
- E. G. C. Neiva, V. H. R. Souza, K. Huang, A. Pénicaud and A. J. G. Zarbin, J. Colloid Interface Sci., 2015, 453, 28–35 CrossRef PubMed.
- P. Kovacic and C. Wu, J. Polym. Sci., 1960, 47, 45–54 CrossRef.
- P. Kovacic and F. W. Koch, J. Org. Chem., 1963, 282, 1864–1867 CrossRef.
- R. M. Smith, Understanding mass spectra: a basic approach, John Wiley & Sons, 2004 Search PubMed.
- T. Bécue, F. J. Maldonado-Hodar, A. P. Antunes, J. M. Silva, M. F. Ribeiro, P. Massiani and M. Kermarec, J. Catal., 1999, 181, 244–255 CrossRef.
- K. G. Azzam, G. Jacobs, W. D. Shafer and B. H. Davis, J. Catal., 2010, 270, 242–248 CrossRef.
- F. Solymosi and R. Barthos, Catal. Lett., 2005, 101, 235–239 CrossRef.
- B. A. Kazanskii, V. S. Fadeev and I. V. Gostunskaya, Bull. Acad. Sci. USSR, 1971, 20, 607–611 CrossRef.
- H. Wang, T. Maiyalagan and X. Wang, ACS Catal., 2012, 2, 781–794 CrossRef.
- R. Yadav and C. K. Dixit, J. Sci. Adv. Mater. Dev., 2017, 2, 141–149 Search PubMed.
Footnote |
| † Electronic supplementary information (ESI) available: Further experimental and characterization details; complementary Raman, SEM, TEM, XRD, XPS, GC-MS and ESI-MS data. See DOI: 10.1039/c8sc02818d |
| This journal is © The Royal Society of Chemistry 2018 |

