α-Ni(OH)2/NiS1.97 heterojunction composites with excellent ion and electron transport properties for advanced supercapacitors†
Wutao
Wei‡
 a,
Jiarui
Wu‡
a,
Shizhong
Cui
a,
Yaomin
Zhao
a,
Weihua
Chen
a,
Jiarui
Wu‡
a,
Shizhong
Cui
a,
Yaomin
Zhao
a,
Weihua
Chen
 *b and
Liwei
Mi
 *a
*a
aCenter for Advanced Materials Research, Zhongyuan University of Technology, Zhengzhou 450007, China. E-mail: mlwzzu@163.com
bCollege of Chemistry and Molecular Engineering, Zhengzhou University, Zhengzhou 450001, China. E-mail: chenweih@zzu.edu.cn
First published on 5th March 2019
Abstract
It is recognized that an effective strategy to promote the industrialization of supercapacitors is to enhance the ion and electronic conductivities of electrode materials. In this work, it is demonstrated that the NO/NS-8 heterojunction material obtained via an epitaxial growth method based on ion exchange can be used as an outstanding electrode material for supercapacitors. The construction of heterojunctions between α-Ni(OH)2 and NiS1.97 allows the components to provide each other with ion or electron transport paths and endows NO/NS-8 with excellent ion and electron transport properties; this leads to a high utilization rate of active materials and an unprecedented high specific capacitance (up to 2375.8 F g−1 at 1 mV s−1 in a three-electrode system). Using the as-prepared NO/NS-8 heterojunction material as an electroactive material, an asymmetric supercapacitor with long cycle life (62.8% capacitance retention after 10![[thin space (1/6-em)]](https://www.rsc.org/images/entities/char_2009.gif) 000 cycles at a current density of 5 A g−1) and high energy and power densities (128.4 W h kg−1 at a power density of 402.9 W kg−1 and 63.8 W h kg−1 at 7662.7 W kg−1) is finally demonstrated. This work provides a novel strategy for developing unique heterojunction materials for energy storage.
000 cycles at a current density of 5 A g−1) and high energy and power densities (128.4 W h kg−1 at a power density of 402.9 W kg−1 and 63.8 W h kg−1 at 7662.7 W kg−1) is finally demonstrated. This work provides a novel strategy for developing unique heterojunction materials for energy storage.
Introduction
The rapid development of intelligent electronics has accelerated the insatiable demand for safe and high energy storage systems.1,2 Electrochemical capacitors, especially aqueous-based supercapacitors, are highly anticipated and have been an active field of research due to their high security, fast charge/discharge performance and long cycle life when compared to lithium-ion batteries, sodium-ion batteries and conventional capacitors.3–5 However, the overall performance of supercapacitors is always limited by the low utilization of electrode materials as a result of reversible electrochemical reactions only occurring on the surfaces of electrode materials.6,7 In recent years, researchers have devoted themselves to improving the specific surface areas of electrode materials through micro-/nano-preparations,8–13 reducing electrochemical polarization via combinations with highly conductive materials, and improving ion conductivity by widening the spacing between the crystal planes of electrode materials.14–16 Unfortunately, electrode materials with both high ion and electronic conductivities have rarely been reported.Among the various electrode materials, Ni-based compounds have been widely recognized as promising electrode materials because of the reversible redox reaction between Ni2+ and Ni3+, the variety of possible hierarchical nano-/micro-architectures, their low cost, and their environment friendliness.17,18 For example, Ni(OH)2, especially α-Ni(OH)2, has wide crystal plane spacing to act as transport paths for OH−, which gives it high ion conductivity.19–23 However, its poor electrical conductivity leads to high electrochemical polarization during reversible electrochemical reactions and, further, unsatisfactory rate performance. In contrast, nickel sulfide exhibits excellent electronic conductivity because of the more metallic nature of sulfur and its densely packed crystalline structure. However, the latter property also determines the poor ionic conductivity of nickel sulfide.24–26 Based on these phenomena, a mild strategy of micro-/nano-preparation to construct abundant heterojunctions between Ni(OH)2 and nickel sulfide and achieve the combination of Ni(OH)2 and nickel sulfide on the nanometer scale is highly desirable.27–29 Each component provides the other with ion or electron transport paths, which can result in the preparation of composite electrode materials with excellent electronic and ionic conductivities, and complementary advantages.
In our previous reports, it has been proved that the ion exchange method is a universal synthesis strategy to construct heterojunction materials, which takes an existing lattice as a template, and it can achieve the continuous control of the composition of electrode materials, for example, going from Ni3S2 to Ni3S2@Co9S8, from NiS@Ni3S2 to Co9S8@Ni3S2 and NiSe2@NiS, from Ni3S2 to Ni3S2/Co9S8/NiSe, etc.30–32 Obviously, the similar ionic radii of nickel ions and cobalt ions and the similar chalcogen attributes of sulfur ions and selenium ions ensure the occurrence of ion exchange and the realization of the inheritance of morphology. Whether the ion exchange method can be used to build heterojunctions between Ni(OH)2 and nickel sulfide is uncertain, because hydroxide ions and sulfur ions differ widely in terms of ionic radius, valence state and atomic number. However, the large difference between the solubility product constants (Ksp) of Ni(OH)2 (Ksp = 2 × 10⁻¹⁵) and nickel sulfide (Ksp between 3.2 × 10⁻¹⁹ and 2.0 × 10⁻²⁶ depending on different phases) rekindles the hope of constructing heterojunctions between Ni(OH)2 and nickel sulfide. The construction of a composite material with abundant heterojunctions using nano-scale Ni(OH)2 and nickel sulfide as building blocks, via an epitaxial growth method based on ion exchange using Ni(OH)2 with a micro-/nano-structure as the precursor, is both expected and significant.
Herein, a low-cost and high performance NO/NS-8 heterojunction material for supercapacitors was synthesized via an epitaxial growth method based on ion exchange, using as-obtained peony-like α-Ni(OH)2 microspheres as a precursor and nickel source. The continuous adjustment of the peony-like α-Ni(OH)2 microspheres to NiS1.97 hollow nanocuboids was realized via controlling the added amount of sulfur powder. The influence of the relative proportions of the heterogeneous structures of α-Ni(OH)2 and NiS1.97 on the electrochemical properties was studied in detail. Compared with peony-like NO microspheres, NO/NS-4 heterojunction materials and NO/NS-10 nanocuboids, the as-prepared NO/NS-8 heterojunction material possesses a high specific capacitance of up to 2375.8 F g−1 at 1 mV s−1 in a three-electrode system due to synergistic effects between α-Ni(OH)2 and NiS1.97. As a result, asymmetric supercapacitors based on the NO/NS-8 heterojunction material can deliver a remarkable energy density of 128.4 W h kg−1 at a power density of 402.9 W kg−1, while manifesting a super-high power density of 7662.7 W kg−1 at 63.8 W h kg−1. In addition, the NO/NS-8//AC device also exhibits significantly improved capacitance together with excellent rate performance and long cycling stability.
Experimental section
Synthesis of 3D hierarchical peony-like α-Ni(OH)2 microspheres
Peony-like α-Ni(OH)2 microspheres were obtained via a green solvothermal method. Typically, 1.5 mmol of Ni(NO3)2·6H2O and 16.65 mmol of CO(NH2)2 were added to a 30 ml Teflon-lined autoclave filled with 2 ml of deionized water (H2O) and 14 mL of ethyl alcohol (CH3CH2OH); the mixed solution underwent magnetic stirring for 30 min until the metal salts dissolved completely. Then, the Teflon-lined autoclave was put into its corresponding stainless-steel outer liner and heated to 100 °C for 12 h. After the autoclave had cooled down to room temperature naturally, the product was removed from the autoclave, repeatedly washed with deionized water and 95% ethanol, and dried in a vacuum oven at 60 °C overnight; it was denoted as NO.Construction of α-Ni(OH)2/NiS1.97 heterojunction materials
The synthesis of the α-Ni(OH)2@NiS1.97 heterojunction materials was carried out via an epitaxial growth method based on ion exchange, using the as-obtained peony-like α-Ni(OH)2 microspheres as a precursor and nickel source. 0.0464 g of peony-like α-Ni(OH)2 microspheres and the appropriate amount of sublimated sulfur were added into a 30 ml Teflon-lined autoclave filled with the same solvent system. After magnetic stirring for 30 minutes, the Teflon-lined autoclave was placed in its stainless-steel outer liner at 140 °C for 12 h, and then cooled to room temperature. The precipitate was washed repeatedly in the same way as mentioned above and collected. The products were named NO/NS-2, NO/NS-4, NO/NS-6, NO/NS-8 and NO/NS-10 depending on the amount of sublimated sulfur (0.2, 0.4, 0.6, 0.8 and 1.0 mmol, respectively) used.Structural characterization
X-ray diffraction (XRD) patterns were obtained with a Bruker D8 Advance X-ray powder diffractometer using Cu-Kα irradiation at a scan rate of 0.1° s−1. All XRD measurements were performed within the range of 10° ≤ 2θ ≤ 80°. The morphologies and sizes of the as-prepared materials were characterized using a Zeiss Merlin Compact field emission scanning electron microscope (FESEM) equipped with an energy-dispersive X-ray spectroscopy (EDX) system. The nanostructures of the resulting samples were studied with an FEI Tecnai G2 F20 transmission electron microscope (TEM).Electrochemical measurements
All electrochemical measurements were recorded using a galvanostatic charge/discharge tester (CT2001A) and an electrochemical workstation (CHI 660E) in both a standard three-electrode system and a two-electrode system. For the three-electrode system, the reference electrode was a Hg/HgO electrode. The working electrode, counter electrode, and electrolyte are similar in the two-electrode system. Detailed electrode preparation, device assembly, and electrochemical calculation data are shown in the ESI.†Results and discussion
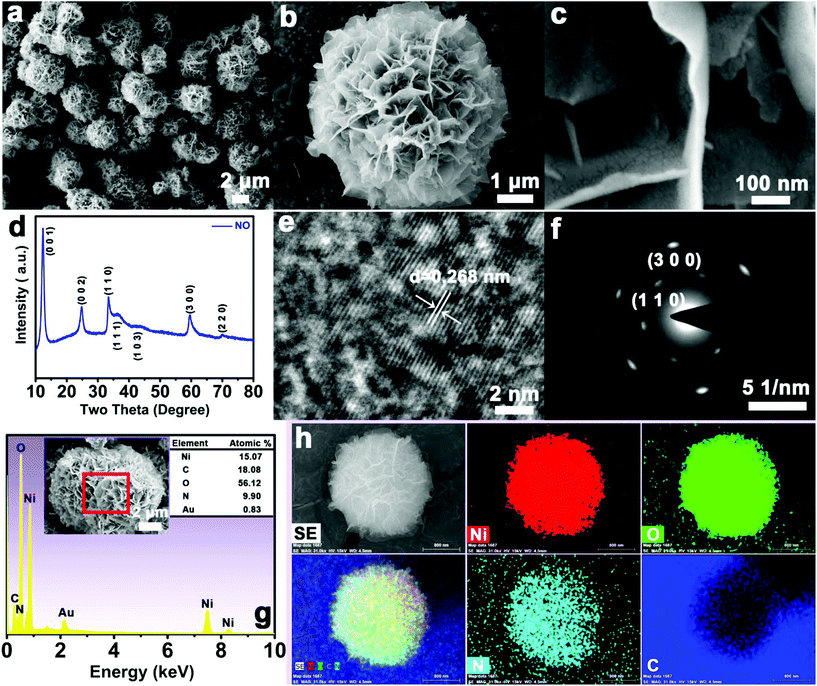
3D hierarchical peony-like α-Ni(OH)2 microspheres were synthesized via a simple and green solvothermal method using urea as the precipitant at low temperature (100 °C) (Fig. 1a). The peony-like NO material with a diameter of ∼5 μm (Fig. 1b) is made up of many intersecting nanosheets with thicknesses of ∼15 nm (Fig. 1c), which provide abundant active sites for subsequent reactions. From Fig. 1d, the diffraction peaks at 2θ values of 12.3, 24.7, 33.3, 36.5, 43.5, 59.6 and 70.2° are attributed to the (001), (002), (110), (111), (103), (300) and (220) lattice planes with interplanar crystal spacings of 0.721, 0.360, 0.268, 0.246, 0.208, 0.155, and 0.134 nm, respectively, which belong to α-Ni(OH)2 (JCPDS no. 22-0444).33–35 The positions of the diffraction peaks slightly deviate from the standard card, which is caused by the different types and quantities of intercalated ions. The peony-like NO material was further investigated via HRTEM (Fig. 1e), indicating its suitably crystalline nature with an interplanar spacing of ∼0.268 nm, which corresponds to the (110) crystal plane of the NO material. The legible diffraction spots further demonstrate the formation of NO material with high crystallization (Fig. 1f), and the spots can be indexed to the (110) and (300) lattice planes. The EDS spectrum reveals that the NO material consists of Ni, O, C and N elements (Fig. 1g). The homogeneous distribution of these elements is clearly proved by EDS mapping analysis (Fig. 1h). The presence of intercalated ions (H2O, OH−, NO3−, CO32−, etc.) causes the molar ratio of Ni to O to be less than 2![[thin space (1/6-em)]](https://www.rsc.org/images/entities/char_2009.gif) :
:![[thin space (1/6-em)]](https://www.rsc.org/images/entities/char_2009.gif) 1. The layered crystal structure of Ni(OH)2 promotes the formation of nanosheets. The coordination between NH4+ from the hydrolysis of urea and Ni2+ prevents the agglomeration of nanosheets and effectively limits the rate of nickel hydroxide formation, which allows the intercalation of H2O and anions (OH−, NO3−, CO32−) and leads to peony-like α-Ni(OH)2 microspheres as the final product.6
1. The layered crystal structure of Ni(OH)2 promotes the formation of nanosheets. The coordination between NH4+ from the hydrolysis of urea and Ni2+ prevents the agglomeration of nanosheets and effectively limits the rate of nickel hydroxide formation, which allows the intercalation of H2O and anions (OH−, NO3−, CO32−) and leads to peony-like α-Ni(OH)2 microspheres as the final product.6
Then, to construct heterojunctions between Ni(OH)2 and nickel sulfide, the peony-like NO microspheres were used as the precursor in the same solvent environment for an epitaxial growth method based on ion exchange, which takes advantage of the instability of α-Ni(OH)2 and the great difference between the solubility product constants of Ni(OH)2 and nickel sulfide. In this process, Ni2+ gradually migrates outward from the peony-like NO material and reacts with sulfur in solution. The newly generated nickel sulfide grows outward along the surface of the NO material, and NO/NS heterojunctions were gradually constructed.
When the added amount of S was 0.2 mmol, the as-obtained NO/NS-2 also exhibits a peony-like microsphere morphology, similar to the NO material (Fig. S1a†). The difference is that some small nanoparticles grow on the surfaces of the nanosheets as building blocks (Fig. S1b†). XRD spectra show that NO/NS-2 is composed of α-Ni(OH)2 from the parent material and newly formed NiS1.97 (JCPDS no. 83-0575) with a cubic phase (Fig. S1c†). The cubic phase nature of NiS1.97 determines that the new-generated nanoparticles gradually grow into cuboids. In addition, there is another diffraction peak at 17.05°, which may be presented by the unstable product in its transient state. Fig. S1d† displays the uniform distribution of Ni, O, S, N and C elements, proving that the sulfur ion exchange reaction actually takes place on the surfaces of the NO nanosheets. The signal strength from O is much stronger than that from S, which indicates that the ion exchange reaction only occurs in the shallow NO nanosheet layers.
As the addition of S is increased to 0.4 mmol, NO/NS-4 is also made up of some microspheres (Fig. S2a†). A small amount of NO nanosheets were broken as the ion exchange went deeper, and these attached to the surfaces of the microspheres. Also, more and more NiS1.97 nanocuboids end up growing on the surfaces of the NO nanosheets (Fig. S2b†). The diffraction peaks from α-Ni(OH)2 decrease gradually. The peaks from NiS1.97 show the opposite trend (Fig. S2c†). The Ni, O, S, N and C elements are also evenly distributed, but the signal from S gets stronger (Fig. S2d†). To explore the sulfur ion exchange in detail, EDS mapping images at high magnification are shown in Fig. S2e,† which display nanocuboid growth on some nanosheets. Clearly, all elements except S are evenly distributed in this region, which reveals that both the nanosheets and nanocuboids contain the phases of both α-Ni(OH)2 and NiS1.97. S elements are distributed over the whole region, indicating that the sulfur ion exchange reaction takes place over the entirety of the nanosheets. The stronger signal from S at the nanocuboids further proves that the content of NiS1.97 in the nanocuboids is higher than it is in the nanosheets. Therefore, a small amount of NiS1.97 grows on the surface of α-Ni(OH)2 in the preliminary stage of sulfur ion exchange. With an increase in NiS1.97, the nanosheets gradually become nanocuboids. The space occupied by the original nanosheets may be transformed into cavities in the nanocuboids. The above data also fully prove that heterojunctions between α-Ni(OH)2 and NiS1.97 have been successfully constructed. NO/NS-6 is still composed of microspheres (Fig. S3a†). More positions on the nanosheets are covered by newly generated nanocuboids (Fig. S3b†). The diffraction peaks from α-Ni(OH)2 become weaker and those from nickel sulfide become stronger (Fig. S3c†). EDS mapping images of NO/NS-6 at high magnification show an element distribution similar to that of NO/NS-4.
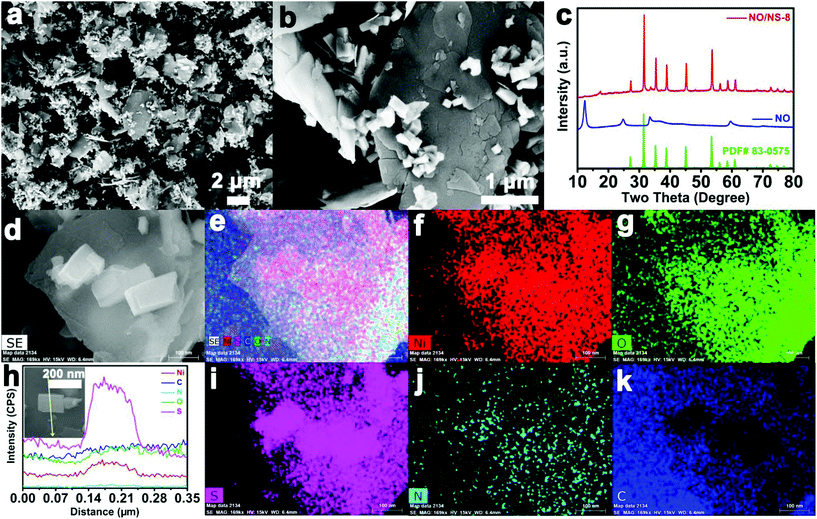
When the addition of S increased to 0.8 mmol, the nanosheets for constructing the microspheres were remarkably dispersed evenly (Fig. 2a), which gives α-Ni(OH)2 inside the microspheres the opportunity to participate in the sulfur ion exchange reaction. Some nanocuboids grew in situ on the surfaces of the nanosheets (Fig. 2b). Fig. 2c shows that the XRD spectrum of NO/NS-8 contains weak diffraction peaks from α-Ni(OH)2 and strong diffraction peaks from NiS1.97. However, the Ni, O, S, N and C elements are distributed in NO/NS-8 and the signals from both O and S are very strong (Fig. 2d–g and i–k). This may be because NiS1.97 growing in situ on the surface of α-Ni(OH)2 weakens the signal strength from α-Ni(OH)2 during XRD testing, while the influence from NiS1.97 on the signal during EDS testing focused on the local area is weak. Fig. 2h shows the elemental linear sweep EDS signals along the yellow line (shown in the inset). Obviously, the whole linear region contains Ni, O, S, N and C elements, further proving that both the nanosheets and nanocuboids contain both α-Ni(OH)2 and NiS1.97. The content values of Ni and S in the nanocuboids are higher than in the nanosheets, which is due to the molar ratio of NiS1.97 in the nanocuboids being higher than in the nanosheets, and the molar ratio of Ni in NiS1.97 is higher than in α-Ni(OH)2. These phenomena correspond to previous results.
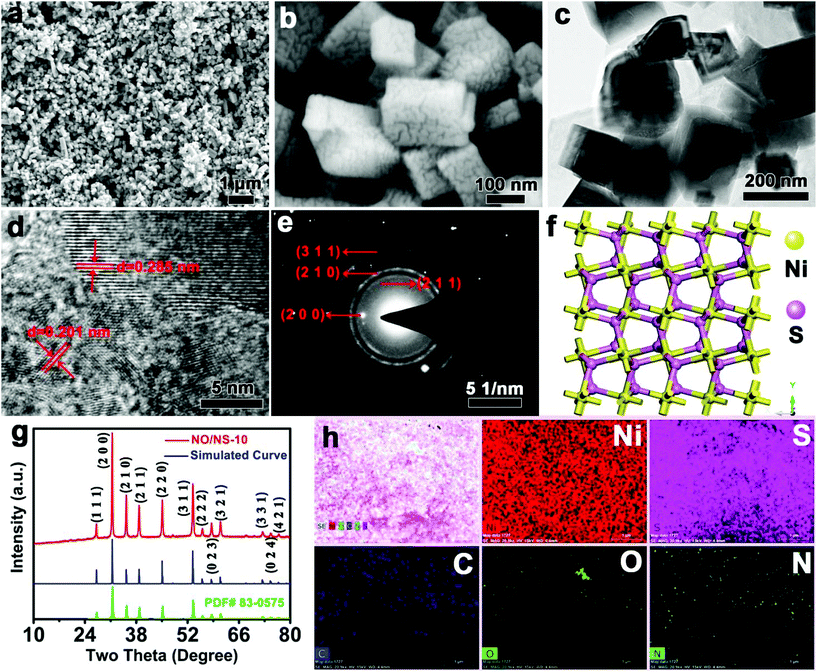
When the addition of S is increased to 1.0 mmol, the peony-like NO microspheres with nanosheets as building blocks are completely transformed into nanocuboids with widths of ∼100 to ∼300 nm and rough surfaces, as seen in NO/NS-10 (Fig. 3a and b). HRTEM images show some cavities inside the NO/NS-10 nanocuboids, which further confirms an epitaxial growth mechanism based on sulfur ion exchange (Fig. 3c). Fig. 3d indicates that the distinct fringe spacings are 0.285 and 0.201 nm, which correspond very well to the (200) and (220) crystal planes of NiS1.97 (JCPDS no. 83-0575). Moreover, the distinguishable ring-like features in the SAED pattern can be an indication of the polycrystalline structure of the NO/NS-10 nanocuboids (Fig. 3e), matching the (200), (211), (210) and (311) crystal planes of NiS1.97 (JCPDS no. 83-0575 ). Based on the above measurement results, a crystal structure of NO/NS-10 was proposed, as shown in Fig. 3f, in which Ni–S bonds with a bond distance of 0.24 nm connect Ni atoms to 6 S atoms and 1 S atom to 4 Ni atoms. It appears that NO/NS-10 has a densely packed crystal structure, which is beneficial for the electron transport but not helpful for the transport of hydroxide ions. A simulated XRD spectrum, according to the simulated crystal structure, and the measured XRD spectrum of NO/NS-10 are shown in Fig. 3g. The perfect match between the simulated and measured XRD curves again proves the correctness of the simulated crystal structure. The diffraction peaks at 27.15, 31.48, 35.34, 38.78, 45.14, 53.48, 56.07, 58.57, 61.02, 72.56, 74.72 and 76.89° were indexed to (111), (200), (210), (211), (220), (311), (222), (023), (321), (331), (024) and (421) reflections, respectively. The diffraction peak at 17.05° disappeared, which further indicates that the transition products are also all converted to NiS1.97 as the final product. EDS mapping images display that NO/NS-10 mainly contains Ni and S elements. There are also trace amounts of C, O and N elements in NO/NS-10 from a small amount of α-Ni(OH)2. Therefore, the transition from α-Ni(OH)2 to NiS1.97 was achieved via an epitaxial growth method based on sulfur ion exchange and heterojunctions with different mole ratios of α-Ni(OH)2 to NiS1.97 have also been successfully constructed.
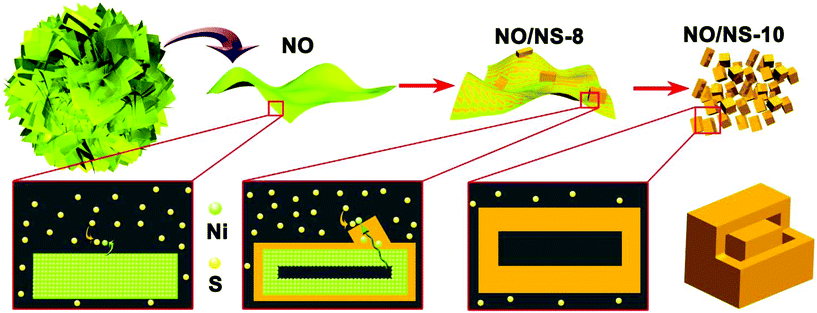
A schematic diagram of the epitaxial growth method based on sulfur ion exchange is vividly depicted in Fig. 4. During the sulfur ion exchange process, Ni2+ ions in the α-Ni(OH)2 nanosheets gradually spill out and react with sulfur ions to generate NiS1.97, which grows in an outward direction along the surfaces of the α-Ni(OH)2 nanosheets, successfully constructing the α-Ni(OH)2/NiS1.97 heterojunctions. As the reaction continues, the original positions of α-Ni(OH)2 become the cavities inside the NiS1.97 nanocuboids when all α-Ni(OH)2 is converted to NiS1.97, which provides a simple method for constructing hollow nanomaterials.
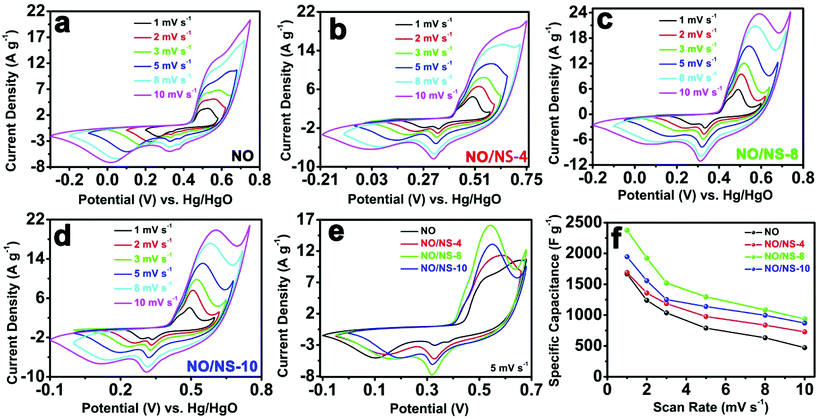
Cyclic voltammetry (CV) is usually used to characterize the capacitive behavior of electrode materials. Fig. 5 shows CV curves and the corresponding specific capacitances of peony-like NO microspheres, the NO/NS-4 heterojunction material, the NO/NS-8 heterojunction material, and NO/NS-10 nanocuboids at scan rates of 1 to 10 mV s−1 in a three-electrode system. Strong redox peaks are observed in all the CV curves, indicating that the capacitance characteristics are mainly determined by faradaic redox reactions. Obviously, the peak currents of the redox peaks increase gradually with sulfur ion exchange, especially the reduction peak at around 0.3 V and the oxidation peak at around 0.5 V. This should be attributed to the construction of heterojunctions between α-Ni(OH)2 and NiS1.97, which result in synergistic effects between α-Ni(OH)2 and NiS1.97 and provide each component with ion or electron transport pathways. When the added amount of S reached 0.8 mmol, the peak currents of the redox peaks rose to their maximum values, which is due to NO/NS-8 having the highest percentage of heterojunctions, echoing the evolution process of the material structure. The peaks shown by NO/NS-8 can probably be ascribed to redox processes involving Ni2+/Ni3+ redox couples, based on the following two reactions:29
| Ni(OH)2 + OH− ↔ NiOOH + H2O + e− | (1) |
| NiS1.97 + OH− ↔ NiS1.97OH + e− | (2) |
For the NO/NS-10 nanocuboids, the disappearance of the heterojunctions and the appearance of hollow structures lead to the peak currents of the redox peaks decreasing slightly. To see more clearly the way in which the peak currents change with the degree of ion exchange, the CV curves from NO, NO/NS-4, NO/NS-8 and NO/NS-10 at a scan rate of 5 mV s−1 are shown in Fig. 5e, which proves again that the NO/NS-8 heterojunction material has the highest peak current and peak area.
The specific capacitances of NO, NO/NS-4, NO/NS-8 and NO/NS-10 are further calculated according to the respective CV curves, and are shown in Fig. 5f. The specific capacitances of the peony-like NO microspheres are 1667.0, 1239.6, 1036.1, 788.5, 631.9 and 471.8 F g−1 at 1 to 10 mV s−1 (the capacitance retention ratio is 28.3%). The specific capacitances of the NO/NS-4 heterojunction material are 1690.6, 1357.3, 1185.7, 976.4, 837.6 and 728.1 F g−1 at 1 to 10 mV s−1 (the capacitance retention ratio is 43.1%). For the NO/NS-8 heterojunction material, the specific capacitances are 2375.8, 1924.3, 1520.4, 1297.0, 1085.0 and 939.5 F g−1 at 1 to 10 mV s−1, exhibiting a capacitance retention ratio of 39.5%. For the NO/NS-10 nanocuboids, the specific capacitances are 1945.5, 1557.5, 1251.6, 1138.8, 996.8 and 870.3 F g−1 at 1 to 10 mV s−1, and the capacitance retention ratio is 44.7%. In all cases, the specific capacitance increases first and then decreases with the degree of sulfur ion exchange and the construction of heterojunctions, and the NO/NS-8 heterojunction material displays the highest specific capacitances at the corresponding scan rates. With sulfur ion exchange, the electronic conductivities of the as-obtained materials were constantly optimized, which results in the capacitance retention ratios of NO/NS-4, NO/NS-8 and NO/NS-10 being higher than that of NO. Therefore, the specific capacitance and rate performances of the electrode materials are improved with the construction of heterojunctions, especially in the case of the NO/NS-8 heterojunction material.
The cycle life is one of the important factors for supercapacitors. The cycling performances of single electrodes were tested via cyclic voltammetry testing at a scan rate of 10 mV s−1 over 350 cycles, and galvanostatic charge/discharge testing was carried out at a current density of 5 A g−1 over 2500 cycles in a standard three-electrode system (Fig. S4†). Obviously, all the CV curves show strong redox peaks, which echo the above data. But the areas and peak voltage differences of the redox peaks decrease with an increase in the cycle number (Fig. S4a–d†). In other words, the capacitances of all the single electrodes gradually decrease and the rate performances of all the single electrodes gradually become better. Galvanostatic charge/discharge testing also displays the low capacitance retention of all the single electrodes (NO: 21.3%; NO/NS-4: 37.5%; NO/NS-8: 49.6%; and NO/NS-10: 47.1%) at 5 A g−1 over 2500 cycles (Fig. S4e†). To make clear the causes behind this, we carefully observed the testing process and found that a lot of active material was deposited at the bottom of the three-electrode system after cycle testing, which revealed that the active material gradually detached from the working electrode during testing (Fig. S4f†). The shedding of active material results in the attenuation of the specific capacitance and reduces electrochemical polarization and concentration polarization. The latter is further reflected in the improvement in rate performance.
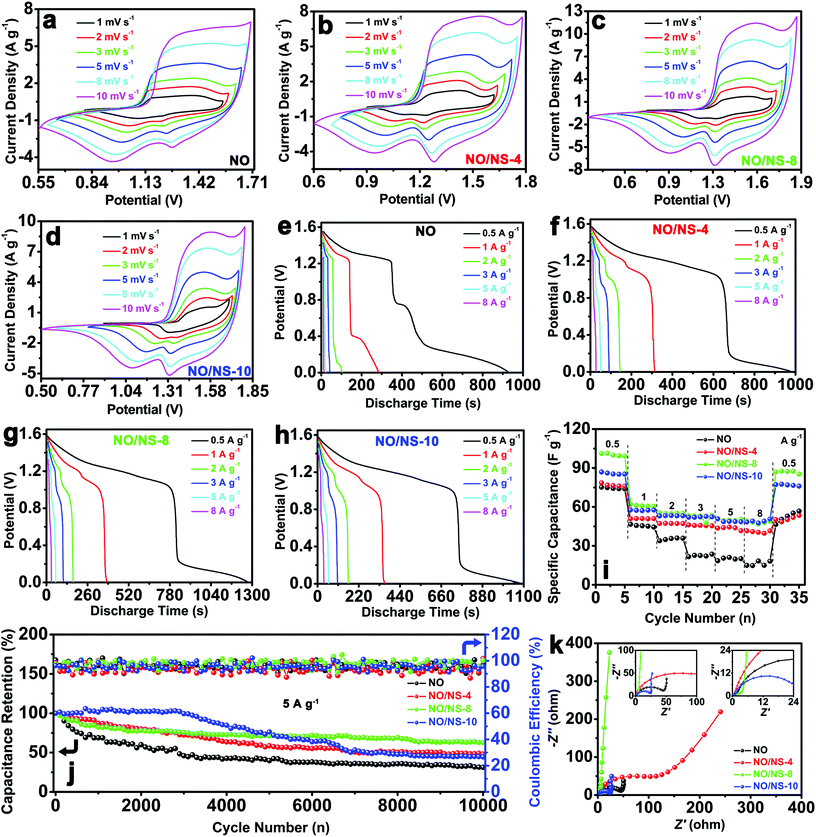
To further evaluate the practical application of the as-synthesized electrode materials, a series of normative asymmetric supercapacitor devices was fabricated using peony-like NO microspheres, the NO/NS-4 heterojunction material, the NO/NS-8 heterojunction material and NO/NS-10 nanocuboids as the working electrodes and an active carbon electrode as the counter electrode, and the devices are denoted as NO//AC, NO/NS-4//AC, NO/NS-8//AC and NO/NS-10//AC, respectively. The overlapping CV curves of the active carbon electrode and the NO, NO/NS-4, NO/NS-8 and NO/NS-10 electrodes in a three-electrode system at a scan rate of 5 mV s−1 are displayed in Fig. S5.† The different operating voltages of the active carbon electrode (−1–0 V) and the NO (−0.1–0.68 V), NO/NS-4 (−0.05–0.66 V), NO/NS-8 (−0.05–0.68 V) and NO/NS-10 (0–0.68 V) electrodes indicate a perfect match between the potential windows of active carbon and the as-prepared materials. However, when the operating voltage window is larger than 1.6 V, H2O in the electrolyte will produce side-reactions involving oxygen and hydrogen evolution. Therefore, the operating voltage window can be expected to be extended to 1.6 V using the higher cut-off voltage of the as-prepared electrode materials (0.6 V) and the lower cut-off voltage of active carbon (−1 V). Fig. 6a–d displays the CV curves in turn. The obvious redox peaks in all the CV curves prove that a reversible redox reaction is the main mode of energy storage, which also ensures that the as-obtained materials have good electrochemical properties. The peak currents (especially the oxidation peak at ∼1.5 V and the reduction peak at ∼1.3 V) and peak areas of the redox peaks increase gradually with the construction of heterojunctions between α-Ni(OH)2 and NiS1.97. The peak currents and peak areas of the CV curves from the NO/NS-8//AC device are larger than those from the other materials due to its material having the highest heterojunction ratio. With further sulfur ion exchange, the heterojunctions gradually disappear, resulting in a decrease in the peak currents and peak areas (Fig. 6d). All the discharge curves in Fig. 6e–h show an obvious discharge platform, which indicates again the dependence of the energy storage process on a reversible redox reaction. The discharge times at the same current densities increase first and then decrease with the degree of sulfur ion exchange, and the NO/NS-8//AC device has the longest discharge time, which corresponds to the CV results from the three-electrode system and the devices and confirms that the specific capacitance can be optimized via the construction of heterojunctions. Fig. 6i shows the specific capacitances of the NO//AC, NO/NS-4//AC, NO/NS-8//AC and NO/NS-10//AC devices. Obviously, all the specific capacitances of the NO/NS-4//AC, NO/NS-8//AC and NO/NS-10//AC devices are higher than those of the NO//AC device, which is consistent with the aforementioned results. The specific capacitances of the NO//AC device are 74.5, 45.7, 35.6, 23.1, 21.0 and 17.9 F g−1 at 0.5, 1, 2, 3, 5 and 8 A g−1, respectively, yielding a capacitance retention ratio of 24.0%. The specific capacitances of the NO/NS-4//AC device are 76.9, 51.2, 47.7, 46.3, 44.6 and 42.5 F g−1 at 0.5, 1, 2, 3, 5 and 8 A g−1 (a capacitance retention ratio of 55.3%), respectively. For the NO/NS-8//AC device, the specific capacitances are 100.3, 61.2, 55.4, 52.6, 51.0 and 49.9 F g−1 at 0.5 to 8 A g−1 (a capacitance retention ratio of 49.8%). The specific capacitances of the NO/NS-10//AC device are 85.9, 57.6, 53.6, 52.9, 50.1 and 50.6 F g−1 at 0.5 to 8 A g−1 (a capacitance retention ratio of 58.9%). Compared with the NO//AC device, the rate performances and specific capacitances of the other devices have significantly improved owing to the improvement in electronic conductivity as a result of sulfur ion exchange and the construction of heterojunctions. After 10![[thin space (1/6-em)]](https://www.rsc.org/images/entities/char_2009.gif) 000 galvanostatic charge/discharge measurements at 5 A g−1, the capacitance retention percentages of the NO//AC, NO/NS-4//AC, NO/NS-8//AC and NO/NS-10//AC devices are 31.3, 48.1, 62.8 and 44.5%, respectively. All the corresponding coulombic efficiencies remain higher than 93%, which proves that all the as-synthesized electrode materials have good reversible redox activity. The abundant heterojunctions endow the NO/NS-8//AC device with the highest specific capacitance, ideal rate performance and the longest cycle life, which are favorable for its more extensive application in energy storage.
000 galvanostatic charge/discharge measurements at 5 A g−1, the capacitance retention percentages of the NO//AC, NO/NS-4//AC, NO/NS-8//AC and NO/NS-10//AC devices are 31.3, 48.1, 62.8 and 44.5%, respectively. All the corresponding coulombic efficiencies remain higher than 93%, which proves that all the as-synthesized electrode materials have good reversible redox activity. The abundant heterojunctions endow the NO/NS-8//AC device with the highest specific capacitance, ideal rate performance and the longest cycle life, which are favorable for its more extensive application in energy storage.
To further reveal the mechanism behind how the construction of heterojunctions improved the electrochemical performance of the electrode materials, electrochemical impedance spectroscopy (EIS) measurements were carried out, as shown in Fig. 6k. The NO//AC device presents the semicircle with the maximum diameter and the minimum straight line slope. Therefore, the NO//AC device has the largest charge-transfer resistance and diffusive resistance. This may be due to the poor electronic conductivity of the NO material, resulting in a low utilization rate of active material and further limiting the ion diffusion depth and ion transport rate. The construction of heterojunctions improves the slope of the straight line and reduces the diameter of the semicircle. For the NO/NS-8//AC device, the smallest semicircle and the largest straight line slope indicate that the NO/NS-8//AC device has the highest ionic and electronic conductivities. Therefore, the construction of heterojunctions between α-Ni(OH)2 and NiS1.97 effectively improves the ionic and electronic conductivities of the parent material and the utilization rate of active material. The NO/NS-4//AC and NO/NS-10//AC devices also exhibit ideal ionic and electronic conductivities. The former may be attributed to the construction of heterojunctions, and the latter to the high electronic conductivity of NiS1.97 and the hollow nanostructure.
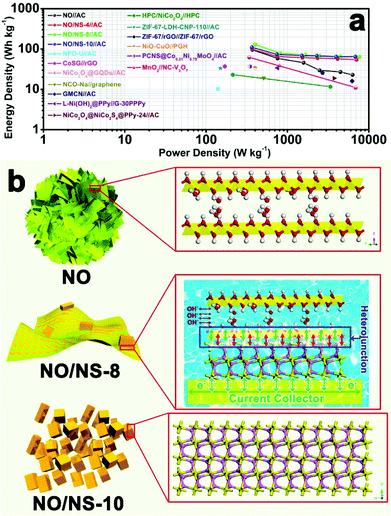
To further investigate the energy and power densities of the as-assembled NO//AC, NO/NS-4//AC, NO/NS-8//AC and NO/NS-10//AC devices, a Ragone plot was developed, as shown in Fig. 7a, which clearly shows that all the devices have high energy and power densities, especially the NO/NS-8//AC device. Remarkably, the energy density of the NO/NS-8//AC device reaches 128.4 W h kg−1 at a power density of 402.9 W kg−1 and remains at 63.8 W h kg−1 at 7662.7 W kg−1. It is worth noting that the value achieved is superior to many supercapacitors such as: NFO-U//AC (10.15 W h kg−1 at 140 W kg−1);36 CoSG//rGO (37 W h kg−1 at 170 W kg−1);37 NiCo2O4@GQDs//AC (38 W h kg−1 at 800 W kg−1);38 NCO-Na//graphene (19.12 W h kg−1 at 509.87 W kg−1);39 GMCN//AC (16 W h kg−1 at 6250 W kg−1);40 L-Ni(OH)2@PPy//G-30PPPy (34 W h kg−1 at 755 W kg−1);41 NiCo2O4@NiCo2S4@PPy-24//AC (18.8 W h kg−1 at 3753.3 W kg−1);42 HPC/NiCo2O4//HPC (23.05 W h kg−1 at 213 W kg−1 and 11.65 W h kg−1 at 3380 W kg−1);43 ZIF-67-LDH-CNP-110//AC (33.29 W h kg−1 at 150 W kg−1);44 ZIF-67/rGO//ZIF-67/rGO (25.5 W h kg−1 at 2700 W kg−1);45 NiO-CuO//PGH (33.8 W h kg−1 at 400 W kg−1);46 PCNS@Co0.21Ni0.79MoO4//AC (36.7 W h kg−1 at 346.4 W kg−1);47 and MnO2//NC-V3O7 (62.1 W h kg−1 at 340 W kg−1 and 11.06 W h kg−1 at 6890 W kg−1).48
The analysis above clearly indicates that the enhancements in the specific capacity, rate and cycling performances are closely related to the construction of heterojunctions between α-Ni(OH)2 and NiS1.97. Herein, an underlying mechanism is proposed, as illustrated in Fig. 7b. For the peony-like NO microspheres, a two-dimensional layered structure with many intercalated ions provides rich ionic transport paths inside the electrode material and further gives NO material good ionic conductivity. However, the poor electronic conductivity of α-Ni(OH)2 leads to the very low utilization of active material. On the other hand, the NO/NS-10 nanocuboids are mainly composed of NiS1.97. The compact crystal structure and higher metallicity of the sulfur ions endow NO/NS-10 with ideal electronic conductivity, which also limits the transport of OH−. The NO/NS-8 heterojunction material combines the advantages of NO and NO/NS-10 through the construction of heterojunctions between α-Ni(OH)2 and NiS1.97. They provide each component with ionic or electronic transport channels. This design ensures that NO/NS-8 has good ionic and electronic conductivities, which further leads to its high specific capacitance, excellent rate performance, long cycle life, high energy density and high power density.
Conclusions
In summary, a novel NO/NS-8 heterojunction material was rationally designed and fabricated via a universal method involving an epitaxial growth method based on ion exchange. The purposeful combination of α-Ni(OH)2 with abundant ion transport paths and NiS1.97 with good electrical conductivity is favorable for efficient ionic and electronic transport and improving the utilization of active material, as a result of α-Ni(OH)2 and NiS1.97 providing each other with ion or electron transport channels, giving rise to the high specific capacitance of the NO/NS-8 heterojunction material. The specific capacitance of the NO/NS-8 heterojunction material is as high as 2375.8 F g−1 at 1 mV s−1, which is 1.43 times that of peony-like NO microspheres. Benefiting from the high specific capacitance and superior ionic and electronic conductivities, an as-assembled NO/NS-8//AC device exhibited excellent cycling performance (the average capacitance fading rate is 0.00372% per cycle over 10![[thin space (1/6-em)]](https://www.rsc.org/images/entities/char_2009.gif) 000 cycle at 5 A g−1) and excellent rate performance (the capacitance retention ratio is 49.8% from 0.5 to 8 A g−1), and possessed a high energy density of 128.4 W h kg−1 at a power density of 402.9 W kg−1. Using an epitaxial growth method based on ion exchange to construct heterojunctions between the two kinds of material with different advantages resulted in the improvement of the overall electrochemical properties, and could provide a promising way for preparing high performance electrode materials for supercapacitors, as well as other energy storage devices.
000 cycle at 5 A g−1) and excellent rate performance (the capacitance retention ratio is 49.8% from 0.5 to 8 A g−1), and possessed a high energy density of 128.4 W h kg−1 at a power density of 402.9 W kg−1. Using an epitaxial growth method based on ion exchange to construct heterojunctions between the two kinds of material with different advantages resulted in the improvement of the overall electrochemical properties, and could provide a promising way for preparing high performance electrode materials for supercapacitors, as well as other energy storage devices.
Conflicts of interest
There are no conflicts to declare.Acknowledgements
This work was supported by the National Natural Science Foundation of China (Grant No. U1804126, U1804129, 21671205, 21771164 and U1407103), the Collaborative Innovation Centre of Henan Textile and Clothing Industry, and the Innovation Scientists and Technicians Troop Construction Projects of Henan Province (Grant No. 164100510007 and CXTD2015018).References
- K. J. Griffith, K. M. Wiaderek, G. Cibin, L. E. Marbella and C. P. Grey, Nature, 2018, 559, 556 CrossRef CAS PubMed.
- F. Wang, X. Wu, X. Yuan, Z. Liu, Y. Zhang, L. Fu, Y. Zhu, Q. Zhou, Y. Wu and W. Huang, Chem. Soc. Rev., 2017, 46, 6816 RSC.
- Y. Shao, M. F. El-Kady, J. Sun, Y. Li, Q. Zhang, M. Zhu, H. Wang, B. Dunn and R. B. Kaner, Chem. Rev., 2018, 118, 9233 CrossRef CAS PubMed.
- D. P. Dubal, N. R. Chodankar, D.-H. Kim and P. Gomez-Romero, Chem. Soc. Rev., 2018, 47, 2065 RSC.
- Q. Xue, H. Gan, Y. Huang, M. Zhu, Z. Pei, H. Li, S. Deng, F. Liu and C. Zhi, Adv. Energy Mater., 2018, 8, 1703117 CrossRef.
- W. Wei, S. Cui, L. Ding, L. Mi, W. Chen and X. Hu, ACS Appl. Mater. Interfaces, 2017, 9, 40655 CrossRef CAS PubMed.
- Z. Jiang, Y. Wang, S. Yuan, L. Shi, N. Wang, J. Xiong, W. Lai, X. Wang, F. Kang, C. P. Wong and C. Yang, Adv. Funct. Mater., 2018, 1807116 CrossRef.
- L. Shen, L. Yu, H. B. Wu, X.-Y. Yu, X. Zhang and X. W. Lou, Nat. Commun., 2015, 6, 6694 CrossRef CAS PubMed.
- Z. Pan, J. Yang, Q. Zhang, M. Liu, Y. Hu, Z. Kou, N. Liu, X. Yang, X. Ding, H. Chen, J. Li, K. Zhang, Y. Qiu, Q. Li, J. Wang and Y. Zhang, Adv. Energy Mater., 2019, 1802753 CrossRef.
- Z. Wang, J. Gu, S. Li, G. C. Zhang, J. Zhong, X. Fan, D. Yuan, S. Tang and D. Xiao, ACS Sustainable Chem. Eng., 2019, 7, 258 CrossRef CAS.
- J. Gu, X. Fan, X. Liu, S. Li, Z. Wang, S. Tang and D. Yuan, Chem. Eng. J., 2017, 324, 35 CrossRef CAS.
- K. Xiang, Z. Xu, T. Qu, Z. Tian, Y. Zhang, Y. Wang, M. Xie, X. Guo, W. Ding and X. Guo, Chem. Commun., 2017, 53, 12410 RSC.
- Z. Peng, X. Liu, H. Meng, Z. Li, B. Li, Z. Liu and S. Liu, ACS Appl. Mater. Interfaces, 2017, 9, 4577 CrossRef PubMed.
- Y. Xue, T. Chen, S. Song, P. Kim and J. Bae, Nano Energy, 2019, 56, 751 CrossRef CAS.
- L. Qu, Y. Zhao, A. M. Khan, C. Han, K. M. Hercule, M. Yan, X. Liu, W. Chen, D. Wang, Z. Cai, W. Xu, K. Zhao, X. Zheng and L. Mai, Nano Lett., 2015, 15, 2037 CrossRef CAS PubMed.
- Y. Chen, W. K. Pang, H. Bai, T. Zhou, Y. Liu, S. Li and Z. Guo, Nano Lett., 2017, 17, 429 CrossRef CAS PubMed.
- L. Ye, Y. Zhou, Z. Bao, Y. Zhao, Y. Zou, L. Zhao and Q. Jiang, J. Mater. Chem. A, 2018, 6, 19020 RSC.
- X. Tang, C. Zhu, D. Cheng, H. Zhou, X. Liu, P. Xie, Q. Zhao, D. Zhang and T. Fan, Adv. Funct. Mater., 2018, 28, 1805057 CrossRef.
- J. Xie, X. Sun, N. Zhang, K. Xu, M. Zhou and Y. Xie, Nano Energy, 2013, 2, 65 CrossRef CAS.
- M. Xie, Z. Xu, S. Duan, Z. Tian, Y. Zhang, K. Xiang, M. Lin, X. Guo and W. Ding, Nano Res., 2018, 11, 216 CrossRef CAS.
- J. L. Gunjakar, A. I. Inamdar, B. Hou, S. Cha, S. M. Pawar, A. A. A. Talha, H. S. Chavan, J. Kim, S. Cho, S. Lee, Y. Jo, H. Kim and H. Im, Nanoscale, 2018, 10, 8953 RSC.
- B. Mavis and M. Akinc, Chem. Mater., 2006, 18, 5317 CrossRef CAS.
- M. Xie, S. Duan, Y. Shen, K. Fang, Y. Wang, M. Lin and X. Guo, ACS Energy Lett., 2016, 1, 814 CrossRef CAS.
- Y. Zhu, H. Yang, K. Lan, K. Iqbal, Y. Liu, P. Ma, Z. Zhao, S. Luo, Y. Luo and J. Ma, Nanoscale, 2019, 11, 2355 RSC.
- H. Guan, S. Zhang, X. Cai, Q. Gao, X. Yu, X. Zhou, F. Peng, Y. Fang and S. Yang, J. Mater. Chem. A, 2019, 7, 2560 RSC.
- J. Balamurugan, C. Li, V. Aravindan, N. H. Kim and J. H. Lee, Adv. Funct. Mater., 2018, 28, 1803287 CrossRef.
- W. Zhou, X. Cao, Z. Zeng, W. Shi, Y. Zhu, Q. Yan, H. Liu, J. Wang and H. Zhang, Energy Environ. Sci., 2013, 6, 2216 RSC.
- Y. Ji;, W. Liu, Z. Zhang, Y. Wang, X. Zhao, B. Li, X. Wang, X. Liu, B. Liu and S. Feng, RSC Adv., 2017, 7, 44289 RSC.
- Y. Zhang, L. Yu, R. Hu, J. Zhang, Y. Wang, R. Niu, X. Qian and J. Zhu, J. Mater. Chem. A, 2018, 6, 17417 RSC.
- L. Mi, W. Wei, S. Huang, S. Cui, W. Zhang, H. Hou and W. Chen, J. Mater. Chem. A, 2015, 3, 20973 RSC.
- W. Wei, L. Mi, Y. Gao, Z. Zheng, W. Chen and X. Guan, Chem. Mater., 2014, 26, 3418 CrossRef CAS.
- S. Huang, W. Zhang, S. Cui, W. Chen and L. Mi, Inorg. Chem. Front., 2017, 4, 727 RSC.
- H. Wang, S. Casalongue, Y. Liang and H. Dai, J. Am. Chem. Soc., 2010, 132, 7472 CrossRef CAS PubMed.
- H. Yi, H. Wang, Y. Jing, T. Peng, Y. Wang, J. Guo, Q. He, Z. Guo and X. Wang, J. Mater. Chem. A, 2015, 3, 19545 RSC.
- X. Meng and D. Deng, J. Mater. Chem. A, 2016, 4, 6919–6925 RSC.
- X. Guo, W. Wang, J. Bi, Y. Chen, X. Han, X. Sun and J. Zhang, Electrochim. Acta, 2019, 296, 181 CrossRef.
- B. Xie, M. Yu, L. Lu, H. Feng, Y. Yang, Y. Chen, H. Cui, R. Xiao and J. Liu, Carbon, 2019, 141, 134 CrossRef CAS.
- J. Luo, J. Wang, S. Liu, W. Wu, T. Jia, Z. Yang, S. Mu and Y. Huang, Carbon, 2019, 146, 1 CrossRef CAS.
- H. Fu, Y. Liu, L. Chen, Y. Shi, W. Kong, J. Hou, F. Yu, Y. Wei, H. Wang and X. Guo, Electrochim. Acta, 2019, 296, 719 CrossRef CAS.
- L. Bai, Y. Zhang, L. Zhang, Y. Zhang, L. Sun, N. Ji, X. Li, H. Si, Y. Zhang and H. Huang, Nano Energy, 2018, 53, 982 CrossRef CAS.
- W. He, G. Zhao, P. Sun, P. Hou, P. Hou, L. Zhu, T. Wang, L. Li, X. Xu and T. Zhai, Nano Energy, 2019, 56, 207 CrossRef CAS.
- D. Zhao, H. Liu and X. Wu, Nano Energy, 2019, 57, 363 CrossRef CAS.
- Q. Zhang, C. Chen, W. Chen, G. Pastel, X. Guo, S.-X. Liu, Q. Wang, Y. Liu, J. Li, H. Yu and L. Hu, ACS Appl. Mater. Interfaces, 2019, 11, 5919 CrossRef CAS PubMed.
- Z. Xiao, Y. Bao, Z. Li, X. Huai, M. Wang, P. Liu and L. Wang, ACS Appl. Energy Mater., 2019, 2, 1086 CrossRef CAS.
- S. Sundriyal, V. Shrivastav, H. Kaur, S. Mishra and A. Deep, ACS Omega, 2018, 3, 17348 CrossRef CAS.
- Z. Fang, S. U. Rehman, M. Sun, Y. Yuan, S. Jin and H. Bi, J. Mater. Chem. A, 2018, 6, 21131 RSC.
- J. Lin, L. Yao, Z. Li, P. Zhang, W. Zhong, Q. Yuan and L. Deng, Nanoscale, 2019, 11, 3281 RSC.
- D. Zhao, Q. Zhu, D. Chen, Y. Yu and X. Huang, J. Mater. Chem. A, 2018, 6, 16475 RSC.
Footnotes |
| † Electronic supplementary information (ESI) available: Electrochemical measurements and Fig. S1–S3 (morphological, structural, phase and element distribution characterization of NO/NS-2, NO/NS-4 and NO/NS-6 materials). See DOI: 10.1039/c9nr00962k |
| ‡ These authors contributed equally. |
| This journal is © The Royal Society of Chemistry 2019 |

