Li4Ti5O12 quantum dot decorated carbon frameworks from carbon dots for fast lithium ion storage
Lin
Li
a,
Xinnan
Jia
a,
Yu
Zhang
a,
Tianyun
Qiu
a,
Wanwan
Hong
a,
Yunling
Jiang
a,
Guoqiang
Zou
a,
Hongshuai
Hou
 *a,
Xianchun
Chen
*b and
Xiaobo
Ji
 a
a
aCollege of Chemistry and Chemical Engineering, Central South University, Changsha, 410083, China. E-mail: hs-hou@csu.edu.cn; Tel: +86 731-88877237
bCollege of Materials Science and Engineering, Sichuan University, Chengdu, 6110064, China. E-mail: kfwcxc@163.com
First published on 20th June 2019
Abstract
Spinel Li4Ti5O12 (LTO) shows great security and structural stability as a promising anode material for lithium-ion batteries (LIBs), but its application is restricted by its low conductivity and diffusion coefficient. Thus, LTO quantum dots (QDs) anchored on 3D carbon frameworks (CFs) from carbon dots are constructed to overcome these issues; LTO with a quantum size is designed to largely reduce the diffusion distance of Li+ and 3D CFs are introduced to enhance the electronic conductivity. As expected, the composite attains a high discharge capacity of 191 mA h g−1 at 0.2C and 115.4 mA h g−1 at a high rate of 40C; even when the current density is reduced back to 0.5C from 40C, the reversible capacity of 169.1 mA h g−1 can still be restored and the capacity retention is 92.96%, which is much better than that of bare LTO particles. This work will provide a feasible idea for improving the performance of anode materials for LIBs.
1. Introduction
As a promising anode material for lithium-ion batteries (LIBs), Li4Ti5O12 (LTO) has received extensive attention in recent years. Li4Ti5O12 exhibits a spinel structure, and is also known as a zero-strain material. The volume change of Li4Ti5O12 is very small or even close to zero in the process of charging and discharging, thus resulting in excellent structural stability and cycling performance. Furthermore, spinel Li4Ti5O12 presents a high voltage platform at about 1.5 V, which avoids forming a solid electrolyte interface (SEI) film and lithium dendrites, leading to high security.1–6 However, the poor electrical conductivity and sluggish diffusion kinetics cause an inferior rate capability, which has restricted the application of LTO in LIBs. In order to improve the electrochemical lithium storage performance of LTO, many methods have been proposed and developed, including ionic doping, carbon coating, morphology redesign and reducing particle size.7,8 Ionic doping and carbon coating are effective ways to improve the electrical conductivity so as to enhance the performance of Li4Ti5O12. Kang et al.9 utilized glucose as a carbon source to synthesize Li4Ti5O12/C composite materials, and the carbon layer prevented particle agglomeration, and improved the conductivity. At the current density of 0.5C, the capacity retention of Li4Ti5O12/C was 11.15% higher than that of the material without a carbon coating after 100 cycles. By combining the hydrothermal method and high-temperature calcination, Wang et al.10 prepared Ca+ doped (doped in lithium position) Li4Ti5O12 with a flower-like pattern, whose capacity was twice higher that of pure Li4Ti5O12 at a high-rate. Compared with bulk electrode materials, nanosized electrode materials often show better rate capability due to the shorter ion diffusion channels and larger specific surface. In recent years, many studies on nanometer spinel Li4Ti5O12 have been reported. In recent years, there have been more and more research studies on hollow micro-/nanostructures,11–18 and Zhu et al.19 obtained Li4Ti5O12 nanosheets with a serrated-like morphology by using a hydrothermal and calcination method, and then the nanosheets self-assemble into layered hollow microspheres which exhibit superior electrochemical performance compared to commercial LTO particles.Quantum dots (QDs) are a kind of special nanostructure with a size of <10 nm in all three dimensions, and are the smallest nanostructures. Benefitting from the ultrafine structure and large exposed surface area, QD materials have been considered as promising electrode materials for alkali metal ion batteries. The ultrasmall size can extremely reduce the diffusion distance of Li+ during the charge/discharge process, which is in favour of accelerating the kinetics. And the large specific surface area is able to cause the effective contact of the electrode material and electrolyte, facilitating the infiltration and wetting of electrolyte solution.20,21 Zhao et al.22 prepared a SnO2 QDs@GO composite, which delivered a capacity of 566 mA h g−1 even at 2 A g−1 and exhibited outstanding rate capability. But the capacities of the SnO2/GO composite and SnO2 particles quickly reduced to low values. Ji et al.23 used CQDs to modify Mn3O4, and the obtained composite displayed higher coulombic efficiency, and superior rate performance and cycling stability compared to pure Mn3O4 nanoparticles. There have been more and more research studies about QDs and their derivatives have been utilized as LIB anodes in recent years. Many other literature reports also have reported that a variety of QD materials have excellent electrochemical properties in batteries, and it follows that QD materials are promising electrode materials.
Since QD materials have large surface energy, they often tend to self-aggregate into large particles and lose the merit of the size effect. Introducing carbon materials to construct QD/carbon composites is an effective approach to hamper the self-aggregation of QDs. In our previous work, we found that carbon dots can be obtained from the aldol condensation reaction of acetone and they are able to be transformed into 3D carbon frameworks (CFs) when calcining with NaOH. In this work, a composite, in which LTO QDs are uniformly dispersed on 3D carbon frameworks (CFs), is designed to improve the electrochemical performances of LTO. The 3D CFs can not only provide conductive paths but also prevent the LTO QDs from self-aggregating, and the quantum size is able to extremely diminish the Li+ diffusion distance. Therefore, the LTO QDs/CFs not only reveal the advantage of particle size, but also show excellent lithium storage performances; the capacity retention can reach 93.87% after 200 cycles with 1C, and the capacity of 115.4 mA h g−1 at a high rate of 40C, which is much larger than that of bare LTO particles.
2. Experimental section
Preparation of LTO QDs/CFs and bare LTO
For synthesizing 3D CFs, 12 g NaOH (Tianjin Hengxing Chemical Reagent Manufacturing) and 40 mL acetone (Chengdu Cologne Chemicals) were stirred for 30 min and then placed in an air environment for 120 h. Afterwards, the product was calcined at 800 °C for 2 h in an argon atmosphere, followed by washing with hydrochloric acid (Chengdu Cologne Chemicals) and deionized water, and the 3D CF powder was obtained after drying. 80 mg 3D CFs was dispersed in 100 mL ethanol by sonicating for 1 h and then 50 mL LiOH (Tianjin Wind Ship Chemical Reagent) aqueous solution (containing 2.1 g LiOH) was added, which was termed as solution A. 5 g Ti(OC4H9) (Sinopharm Chemical Reagent) was uniformly dispersed in 50 mL ethanol to form solution B. Solution B was added dropwise to solution A at the temperature of 80 °C in an oil bath, then a reflux reaction was continued for 12 hours under 80 °C. After washing and drying, the precursor was calcined at 800 °C for 2 h in argon. And the LTO QDs/CFs were obtained after washing and drying. The preparation process of bare LTO is the same as the above process without the addition of 3D CFs.Material characterization
X-ray diffraction (XRD, Rigaku, Rint-2000), scanning electronic microscopy (SEM, a JEM-2100F instrument at 200 kV), transmission electron microscopy (TEM, JEM-2100F), thermogravimetric analysis (TGA, NETZSCH STA449F3) and X-ray photoelectron spectroscopy (XPS, VG Multi Lab 2000 system) were utilized to investigate the structure, morphology and composition of the obtained samples.Electrochemical measurements
A slurry was prepared by mixing the as-prepared material (active material) and super P (conductive agent) with carboxymethylcellulose sodium (CMC, binder agent) dissolved in deionized water with the mass ratio of 70![[thin space (1/6-em)]](https://www.rsc.org/images/entities/char_2009.gif) :
:![[thin space (1/6-em)]](https://www.rsc.org/images/entities/char_2009.gif) 15
15![[thin space (1/6-em)]](https://www.rsc.org/images/entities/char_2009.gif) :
:![[thin space (1/6-em)]](https://www.rsc.org/images/entities/char_2009.gif) 15. The obtained slurry was coated on copper foils and dried in a vacuum oven at 100 °C for 12 h to prepare the working electrodes. The electrolyte solution is composed of 1 mol L−1 lithium hexafluorophosphate (LiPF6) in ethylene carbonate/dimethyl-carbonate (1
15. The obtained slurry was coated on copper foils and dried in a vacuum oven at 100 °C for 12 h to prepare the working electrodes. The electrolyte solution is composed of 1 mol L−1 lithium hexafluorophosphate (LiPF6) in ethylene carbonate/dimethyl-carbonate (1![[thin space (1/6-em)]](https://www.rsc.org/images/entities/char_2009.gif) :
:![[thin space (1/6-em)]](https://www.rsc.org/images/entities/char_2009.gif) 1 by volume). The 2016 coin-type cells, which use Li sheet as the counter electrode and Celgard 2400 as a separator, were assembled in an argon-filled MBraun glovebox. Cyclic voltammetry (CV) was carried out on an AUTO LAB apparatus with voltage window range from 1.0 V to 3.0 V and scanning rates of 1.0 mV s−1. The tests of galvanostatic charge–discharge were performed by a Land battery system (CT-2001A) with the cutoff voltage of 1.0 and 3.0 vs Li+/Li. Electrochemical impedance spectra (EIS) were collected on a CHI 660D (Chenhua Instrument Company, Shanghai, China) with the voltage amplitude of 5 mV and in the frequency range from 0.01 Hz to 100 kHz. All electrochemical tests were performed at room temperature except for special requirements.
1 by volume). The 2016 coin-type cells, which use Li sheet as the counter electrode and Celgard 2400 as a separator, were assembled in an argon-filled MBraun glovebox. Cyclic voltammetry (CV) was carried out on an AUTO LAB apparatus with voltage window range from 1.0 V to 3.0 V and scanning rates of 1.0 mV s−1. The tests of galvanostatic charge–discharge were performed by a Land battery system (CT-2001A) with the cutoff voltage of 1.0 and 3.0 vs Li+/Li. Electrochemical impedance spectra (EIS) were collected on a CHI 660D (Chenhua Instrument Company, Shanghai, China) with the voltage amplitude of 5 mV and in the frequency range from 0.01 Hz to 100 kHz. All electrochemical tests were performed at room temperature except for special requirements.
3. Results and discussion
The XRD patterns of the as-prepared bare LTO and LTO QDs/CFs are shown in Fig. 1a; it can be seen that all diffraction peak positions of the LTO QDs/CFs are identical to LTO, which is in good accordance with standard cubic spinel Li4Ti5O12 (JCPDS #49-0207). The peaks located at 18.33°, 30.18°, 35.57°, 37.21°, 43.24°, 47.35°, 57.21°, 66.07°, 74.34°, 75.36°, and 79.34° can be indexed to (111), (220) (311), (222), (400), (331), (333), (440), (531), (533), (622) and (444) crystallographic planes of Li4Ti5O12, respectively. Peaks of other titanium oxide are not discovered in the XRD patterns of the composite indicating high purity. In addition, in the XRD pattern of LTO QDs/CFs, the peaks of amorphous carbon are not obvious, which may be attributed to the fact that the characteristic diffraction peak intensity of Li4Ti5O12 is high and the carbon content is low. To measure the content of carbon in the LTO QDs/CFs, thermogravimetric analysis technology is employed and the weight loss curve is exhibited in Fig. 1b, suggesting that the weight loss of the composite material is 4.823%. The mass variation of 0.25% at 200–350 °C may be ascribed to the shedding of functional groups on the surface of the LTO particles, and the change also could be seen from the TGA curves of the pure LTO. The weight decrement of LTO at 400–800 °C was relatively small and could be ignored; therefore, the carbon content of LTO QDs/CFs is about 4.573 wt%.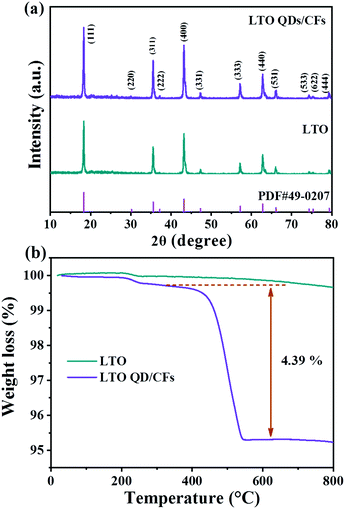 | ||
| Fig. 1 Chemical structure properties of LTO QDs/CFs and bare LTO: (a) XRD patterns, and (b) TGA curves. | ||
XPS was used to further analyze the valence state and chemical composition on the surface of LTO QDs/CFs. Clearly, the signals for O, Li, and C are found in the full survey spectra (Fig. 2a), and also confirming that the amorphous carbon exists in LTO QDs/CFs. In the C 1s spectrum (Fig. 2b), the peaks located at 284.66 eV, 286.40 eV, 288.71 eV and 289.79 eV are assigned to C–C, C–O, C![[double bond, length as m-dash]](https://www.rsc.org/images/entities/char_e001.gif) O and O
O and O![[double bond, length as m-dash]](https://www.rsc.org/images/entities/char_e001.gif) C–O, respectively,24–26 which indicated that some oxygenous functional groups existed on the surface of the CFs and they may be beneficial for the tough loading of LTO QDs. The XPS spectrum of Ti 2p is shown in Fig. 2c; due to the spin–orbital splitting, the signal of Ti 2p is constitutive of Ti 2p1/2 and Ti 2p3/2. The binding energy of Ti 2p1/2 and Ti 2p3/2 approximately locates at 464.1 eV and 458.3 eV, which corresponds to values for Ti4+ in spinel LTO.27–31
C–O, respectively,24–26 which indicated that some oxygenous functional groups existed on the surface of the CFs and they may be beneficial for the tough loading of LTO QDs. The XPS spectrum of Ti 2p is shown in Fig. 2c; due to the spin–orbital splitting, the signal of Ti 2p is constitutive of Ti 2p1/2 and Ti 2p3/2. The binding energy of Ti 2p1/2 and Ti 2p3/2 approximately locates at 464.1 eV and 458.3 eV, which corresponds to values for Ti4+ in spinel LTO.27–31
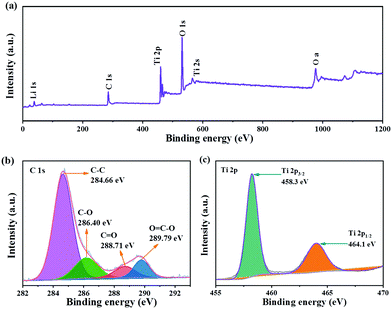 | ||
| Fig. 2 XPS of LTO QDs/CFs: (a) X-ray photoelectron spectroscopy full spectrum, and (b) C 1s and (c) Ti 2p XPS spectra. | ||
The TEM image in Fig. 3a shows that the carbon quantum dots synthesized by acetone and NaOH without calcining treatment are evenly dispersed with a size between 2 and 4 nm. The CQDs were carbonized and self-assembled into 3D carbon frameworks. As shown in Fig. 3b and c, the 3D CFs with a loose and porous structure are composed of cross-linked carbon sheets with uniform thicknesses and a rough surface. The SEM and TEM images of pure LTO are displayed in Fig. 3d and e, and it is clearly found that the LTO particles are agglomerated and stackable, and the size is around 40–60 nm. From the HRTEM image of LTO (Fig. 3f), the lattice fringe is clearly observed. According to the measurement, the interplanar distance of 0.21 nm is related to the (400) crystal plane of standard Li4Ti5O12. The surface morphology and internal structure of LTO QDs/CFs are exhibited in Fig. 4a–f. After a reflux reaction and high temperature calcination, the surface of the 3D CFs becomes rougher, which can be obviously observed in Fig. 4a. Abundant active sites and residual hydrophilic groups on the surface of 3D CFs can effectively absorb metal ion precursors, making the LTO tightly land on the 3D CFs. The low-magnification TEM images in Fig. 4b–d show that numerous ultrafine particles (QDs) with a size of about 5 nm are evenly loaded on the base surface of the 3D CFs. The lattice fringe of the particles and the lattice space of 0.21 nm could be clearly observed from the HRTEM image in Fig. 4e, agreeing well with the pure LTO. The SAED pattern of the LTO QDs/CFs is displayed in Fig. 4f; these three circles index to the reflections of the (111), (311) and (400) lattice planes of Li4Ti5O12, respectively. This consequence is in good accordance with the XRD pattern of the sample, which further confirms that the QDs are Li4Ti5O12.
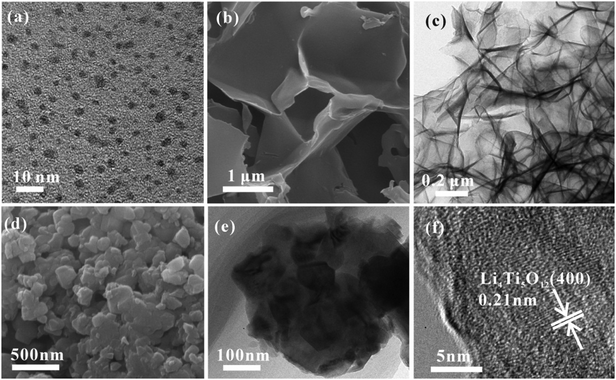 | ||
| Fig. 3 TEM image of CQDs (a), SEM (b) and TEM images (c) of 3D CFs, and SEM (d), TEM (e) and HRTEM (f) images of bare LTO particles. | ||
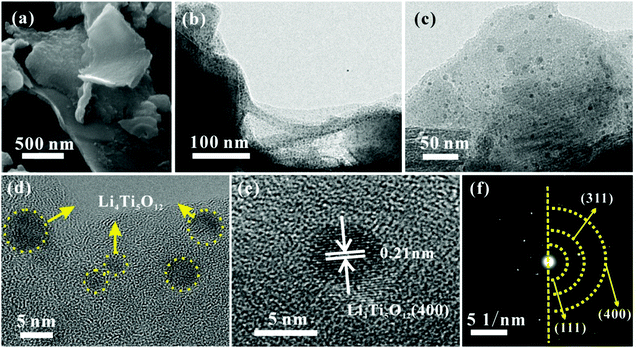 | ||
| Fig. 4 Morphological structure of LTO QDs/CFs: (a) SEM image, (b and c) TEM images, (d and e) HRTEM images and (f) SAED image. | ||
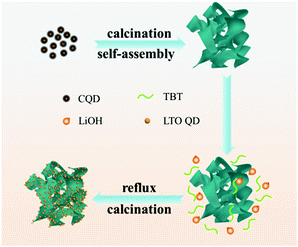
Based on the above-mentioned analysis, illustration of the formation process of LTO QDs/CFs is shown in Scheme 1. The carbon quantum dots (CQDs) were self-assembled into three-dimensional carbon frameworks under the assistance of a strong alkali at high temperature.25,32,33 After the activation of NaOH, the CFs can provide abundant active sites to absorb the precursor and act as the nucleation sites for the precursor, and thus the LTO was nucleated and grown on the surface of the CFs in the process of reflux and heat treatment, the numerous nucleation sites inhibit the further growth of crystalline sturctures, and finally, LTO quantum dots are formed on the surfaces of the carbon frameworks. To sum up, the presence of 3D carbon frameworks restrains the growth of Li4Ti5O12 and leads to a decrease in particle size. The extraordinary morphology of the LTO QDs/CFs not only guarantees the stability of the structure, but also links the LTO QDs with the 3D carbon frameworks, which is beneficial for improving electrical conductivity and the electron-charge transfer rate.
As LIB anodes, the electrochemical performance of LTO QDs/CFs and bare LTO were investigated with various current densities in the voltage window of 1.00–3.00 V. To better verify the difference of kinetics between bare LTO and LTO QDs/CFs, CV was carried out to investigate the oxidation–reduction process of the electrode reactions. Fig. 5a presents the CV curves of the composite for the initial five cycles at a scan rate of 1 mV s−1. In the first scan, a weak and broad cathodic peak appears at 2.42 V, which is related to the irreversible reaction of 3D CF surface functional groups and the formation.34 The five CV curves of LTO QDs/CFs overlap well, indicating that the stability and reversibility of the composite material are excellent. As shown in Fig. 5b, at the scan rate of 0.5 mV s−1, the cathodic and anodic peaks of LTO QDs/CFs are 1.70 V and 1.48 V, respectively, while the cathodic and anodic peaks of the bare LTO correspond to 1.75 V and 1.44 V, respectively. The redox potential difference of the LTO QDs/CFs (∼0.22 V) is smaller than that of bare LTO (∼0.31 V), and thus the composite possesses higher utilization efficiency and smaller electrochemical polarization. Moreover, Fig. 5c displays the long-term cycling performance of bare LTO and LTO QDs/CFs at 1C. Both materials show good cycling stability for up to 200 cycles. Note that the initial coulomb efficiency of LTO QDs/CFs is 87.4%, which is lower than 96.4% of the pure material; the reason may be that the introduction of 3D CFs leads to some irreversible side reactions in the first charge and discharge process. Nonetheless, after 200 cycles, the specific capacity of LTO QDs/CFs is 165.4 mA h g−1 while that of the LTO material is only 113.4 mA h g−1, corresponding to a capacity retention of 93.87% and 77.40%, respectively.
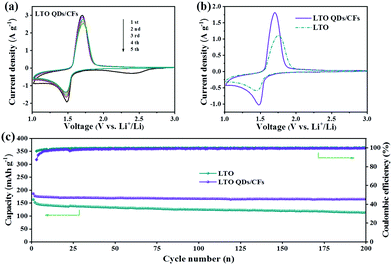 | ||
| Fig. 5 (a) Five CV curves of LTO QDs/CFs at 1 mV s−1, (b) comparison of CV curves between LTO and LTO QDs/CFs at 0.5 mV s−1, and (c) cycling performance at 1C (1C = 175 mA g−1). | ||
From the average capacity of ten cycles in Fig. 6a, the reversible specific capacities of the LTO QDs/CFs can deliver 191, 181.9, 173.6 and 162.2 mA h g−1 at the rate of 0.2, 0.5, 1 and 5C, and the corresponding capacities of bare LTO are 167.5, 157.4, 146.5 and 133.2 mA h g−1, respectively. Whereas, with the current rate increasing from 0.2 to 40C, the difference of the capacity between bare LTO and LTO QDs/CFs becomes larger, as shown in Fig. 6b. At the high current densities of 10, 20 and 40C, the specific capacities of LTO decrease rapidly and the values are 115.4, 92.1 and 62.4 mA h g−1, and the capacity is no longer stable in a numerical range at the rate of 40C. When the current density recovers to 0.5C, the discharge capacity of LTO only reverts to 87.1% of the initial capacity. For LTO QDs/CFs, the capacities of 149.4, 138.2 and 117.1 mA h g−1 can be kept at high current densities of 10, 20 and 40C. Even though the current density comes back to 0.5C, the reversible capacity of 169.1 mA h g−1 could still be restored and the capacity retention is as high as 92.96%. Moreover, comparing the charge and discharge curves of the LTO QDs/CFs and LTO at stepwise current rates in Fig. 6c and d, both materials reveal a broad and stable voltage platform near 1.5 V. However, the LTO QDs/CFs material still maintains an elongated charge and discharge plateau at the extremely high current density of 40C when the voltage platform of LTO has been deformed at 20C, which indicates that the composite possesses higher utilization efficiency and smaller electrochemical polarization.
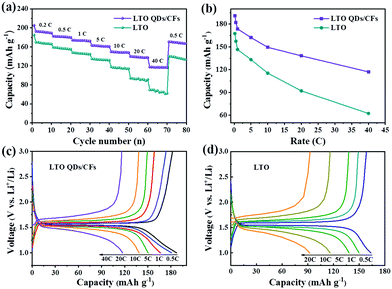 | ||
| Fig. 6 Rate performances (a), capacity contrast diagram at different rates (b), and charge–discharge curves of LTO QDs/CFs (c) and bare LTO particles (d). | ||
Hence, the electrochemical performances of LTO QDs/CFs are more excellent, especially the specific capacity and cycling property at high current rates. The excellent performances of the LTO QDs/CFs material benefit from the addition of 3D CFs; the carbon frameworks with a three-dimensional porous structure provide a solid conductive matrix for Li4Ti5O12. Additionally, the 3D CFs can induce the formation of LTO QDs with ultrasmall size, which effectively increases the electrode/electrolyte contact areas and reduces the diffusion distance of Li+ in LTO, thus facilitating the high-efficiency diffusion of Li+. Table 1 summarizes the electrochemical performances of some previously reported LTO-based anode materials for LIBs, which suggests that the as-prepared LTO QDs/CFs have nice lithium storage performances.
| Materials | Rate (C) | Cycles (n) | Capacity (mA h g−1) | Rate capability (mA h g−1) | Ref. |
|---|---|---|---|---|---|
| LTO/CS | 0.5 | 100 | 142.63 | ≈165 at 0.1C, ≈115 at 20C | 201835 |
| LTO-B | 2 | 100 | 108.0 | 142 at 0.5C, 85 at 6.0C | 201536 |
| HLTOM | 30 | 1000 | 101.5 | 177 at 0.5C, 115 at 10C | 201737 |
| LTO/C-PR | 5 | 100 | 136 | ≈155 at 0.2C, ≈135 at 10C | 201638 |
| LTO-ScMeOH | 1 | 400 | 134.9 | 155.6 at 4C, 79.7 at 20C | 201339 |
| Li4Ti4.99Ru0.01O12 | 1 | 50 | 146 | 141 at 1C, 106 at 20C | 20118 |
| C-Coated LTO | 1 | 100 | 160 | 165 at 1C, 159 at 10C | 201140 |
| Mesoporous LTO powder | 0.5 | 300 | 150 | 132 at 5C, 100 at 10C | 201541 |
| LTO/C | 0.2 | 1000 | 152 | ≈140 at 5C, ≈123 at 10C | 201342 |
| CN-LTO-NMS | 1 | 1000 | 143 | 138 at 4C, 126 at 10C | 201143 |
| LTO QDs/CFs | 1 | 100 | 165.4 | 191 at 0.2C, 149.4 at 10C | This work |
| 138.2 at 20C |
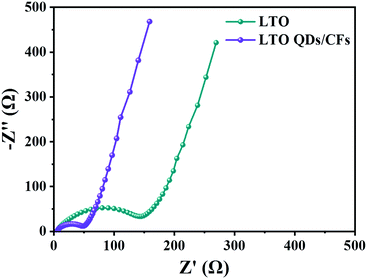
Fig. 7 displays the electrochemical impedance spectroscopy (EIS) of LTO QDs/CFs and bare LTO; the impedance spectra are composed of two parts: the semicircle in the high-frequency region, which represents the charge transfer impedance between the electrode and the electrolyte; and the diagonal line in the low frequency region, which is related to the solid phase diffusion of Li+ in the electrode material.44 The semicircle diameter of the LTO QDs/CFs is obviously smaller than that of the bare LTO, indicating that the addition of 3D CFs greatly improves the conductivity of the electrode material, so as to improve the performance.
4. Conclusions
In summary, Li4Ti5O12 quantum dots/carbon composites are designed to improve the lithium storage performances of Li4Ti5O12, and Li4Ti5O12 quantum dots with a size of 5 nm uniformly loaded on 3D carbon frameworks have been obtained. It was found that 3D carbon frameworks can tailor the formation of Li4Ti5O12 quantum dots due to the fact that their abundant active sites can provide more nucleation sites. Benefitting from the 3D conductive carbon networks and quantum-sized LTO, as an anode material for LIBs, the LTO QDs/CFs composite exhibited superior cycling stability and rate properties. The capacity retention of the composite can reach 93.87% after 200 cycles at 1C and the discharge capacity of 138.2 mA h g−1 is obtained even at a large current density of 20C, suggesting that the LTO QDs/CFs may be a promising battery material for LIBs. Significantly, this work provides a new idea for the preparation of quantum dots/carbon composites, which may facilitate the development of novel nano functional materials.Conflicts of interest
There are no conflicts to declare.Acknowledgements
This work was financially supported by Young Elite Scientists Sponsorship Program by CAST (2017QNRC001), China Postdoctoral Science Foundation (2017M6203552), the National Natural Science Foundation of China (51622406 and 21673298), the National Key Research and Development Program of China (2017YFB0102000 and 2018YFB0104200), Hunan Provincial Science and Technology Plan (2017TP1001 and 2016TP1009) and Project of Postdoctoral Innovative Talents (BX201600192).References
- S. Chen, Y. Xin, Y. Zhou, Y. Ma, H. Zhou and L. Qi, Energy Environ. Sci., 2014, 7, 1924–1930 RSC.
- T. Yi, S. Yang and Y. Xie, J. Mater. Chem., 2015, 3, 5750–5777 RSC.
- L. Yang, H. Li, J. Liu, Y. Lu, S. Li, J. Min, N. Yan, Z. Men and M. Lei, J. Alloys Compd., 2016, 689, 812–819 CrossRef CAS.
- L. Aldon, P. Kubiak, M. C. Womes, J. C. Jumas, J. Olivier-Fourcade, J. L. Tirado, J. I. Corredor and C. P. Vicente, J. Cheminf., 2005, 36, 5721–5725 Search PubMed.
- S. C. Lee, M. L. Sang, J. W. Lee, B. L. Jin, M. L. Sang, S. S. Han, H. C. Lee and H. J. Kim, J. Phys. Chem. C, 2009, 113, 18420–18423 CrossRef CAS.
- Y. Le, B. W. Hao and W. D. L. Xiong, Adv. Mater., 2013, 25, 2296–2300 CrossRef PubMed.
- Y. Wang, L. Guo, Y. Guo, H. Li, X. He, S. Tsukimoto, Y. Ikuhara and L. Wan, J. Am. Chem. Soc., 2012, 134, 7874–7879 CrossRef CAS PubMed.
- Y.-R. Jhan, C.-Y. Lin and J.-G. Duh, Mater. Lett., 2011, 65, 2502–2505 CrossRef CAS.
- J. Park, S. Kang, T. Kwon and H. S. Park, Ceram. Int., 2018, 44, 2683–2690 CrossRef CAS.
- W. Lei, Y. Zhang, H. Guo, L. Jing and S. S. Wong, Chem. Mater., 2018, 30, 671–684 CrossRef.
- J. Wang, H. Tang, L. Zhang, H. Ren, R. Yu, Q. Jin, J. Qi, D. Mao, M. Yang, Y. Wang, P. Liu, Y. Zhang, Y. Wen, L. Gu, G. Ma, Z. Su, Z. Tang, H. Zhao and D. Wang, Nat. Energy, 2016, 1, 6417–6420 Search PubMed.
- J. Qi, X. Lai, J. Wang, H. Tang, H. Ren, Y. Yang, Q. Jin, L. Zhang, R. Yu, G. Ma, Z. Su, H. Zhao and D. Wang, Chem. Soc. Rev., 2015, 44, 6749–6773 RSC.
- X. Zhao, J. Wang, R. Yu and D. Wang, J. Am. Chem. Soc., 2018, 140, 17114–17119 CrossRef CAS PubMed.
- J. Zhang, J. Wan, J. Wang, H. Ren, R. Yu, L. Gu, Y. Liu, S. Feng and D. Wang, Angew. Chem., Int. Ed., 2019, 58, 5266–5271 CrossRef CAS PubMed.
- J. Wang, N. Yang, H. Tang, Z. Dong, Q. Jin, M. Yang, D. Kisailus, H. Zhao, Z. Tang and D. Wang, Angew. Chem., Int. Ed., 2013, 52, 6417–6420 CrossRef CAS PubMed.
- J. Wang, L. Liao, Y. Li, J. Zhao, F. Shi, K. Yan, A. Pei, G. Chen, G. Li, Z. Lu and Y. Cui, Nano Lett., 2018, 18, 7060–7065 CrossRef CAS PubMed.
- J. Wang, Y. Cui and D. Wang, Adv. Mater., 2018, 1801993 CrossRef PubMed.
- H. Ren, R. Yu, J. Wang, Q. Jin, M. Yang, D. Mao, D. Kisailus, H. Zhao and D. Wang, Nano Lett., 2014, 14, 6679–6684 CrossRef CAS PubMed.
- K. Zhu, H. Gao, G. Hu, M. Liu and H. Wang, J. Power Sources, 2017, 340, 263–272 CrossRef CAS.
- P. Wu, Y. Xu, J. Zhan, Y. Li, H. Xue and H. Pang, Small, 2018, 14, 1801479 CrossRef PubMed.
- B. C. C. Peng, Y. Qin, S. Yang, C. Li, Y. Zuo, S. Liu and J. Yang, ACS Nano, 2012, 6, 1074–1081 CrossRef PubMed.
- K. Zhao, L. Zhang, R. Xia, Y. Dong, W. Xu, C. Niu, L. He, M. Yan, L. Qu and L. Mai, Small, 2016, 12, 588–594 CrossRef CAS PubMed.
- J. W. M. Jing, H. Hou, Y. Yang, Y. Zhang, C. Pan, J. Chen, Y. Zhu and X. Ji, J. Mater. Chem. A, 2015, 3, 16824–16830 RSC.
- L. Bao, Z. L. Zhang, Z. Q. Tian, L. Zhang, C. Liu, Y. Lin, B. Qi and D. W. Pang, Adv. Mater., 2011, 23, 5801–5806 CrossRef CAS PubMed.
- H. Hou, C. E. Banks, M. Jing, Y. Zhang and X. Ji, Adv. Mater., 2015, 27, 7861–7866 CrossRef CAS PubMed.
- X. Liu, C. Chen and Y. Wu, Ionics, 2016, 23, 889–896 CrossRef.
- Y. Cai, Y. Huang, J. Wei, X. Wang and Z. Guo, J. Mater. Chem. A, 2016, 4, 9949–9957 RSC.
- T. Xia, W. Zhang, J. Murowchick, G. Liu and X. Chen, Adv. Energy Mater., 2013, 3, 1516–1523 CrossRef CAS.
- Q. Xia, N. Jabeen, S. V. Savilov, S. M. Aldoshin and H. Xia, J. Mater. Chem., 2016, 4, 17543–17551 RSC.
- J. Yue, C. Suchomski, B. M. Smarsly and T. Brezesinski, ChemNanoMat, 2015, 1, 415–421 CrossRef CAS.
- J. Haetge, P. Hartmann, K. Brezesinski, J. Janek and T. Brezesinski, J. Cheminf., 2011, 42, 4384–4393 Search PubMed.
- Z. X. Ting, A. Arundithi, L. Kathy Qian and C. Peng, Small, 2015, 11, 1620–1636 CrossRef PubMed.
- H. Hou, L. Shao, Y. Zhang, G. Zou, J. Chen and X. Ji, Adv. Sci., 2017, 4, 1600243 CrossRef PubMed.
- L. Fu, K. Tang, K. Song, P. A. van Aken, Y. Yu and J. Maier, Nanoscale, 2014, 6, 1384–1389 RSC.
- J.-H. Park, S.-W. Kang, T.-S. Kwon and H. S. Park, Ceram. Int., 2018, 44, 2683–2690 CrossRef CAS.
- M. L. B. Yan, X. Li, Z. Bai, J. Yang, D. Xiong and D. Li, J. Mater. Chem. A, 2015, 3, 11773–11781 RSC.
- K. Zhu, H. Gao, G. Hu, M. Liu and H. Wang, J. Power Sources, 2017, 340, 263–272 CrossRef CAS.
- X. Li, J. Xu, P. Huang, W. Yang, Z. Wang, M. Wang, Y. Huang, Y. Zhou, M. Qu, Z. Yu and Y. Lin, Electrochim. Acta, 2016, 190, 69–75 CrossRef CAS.
- A. Nugroho, S. J. Kim, W. Chang, K. Y. Chung and J. Kim, J. Power Sources, 2013, 244, 164–169 CrossRef CAS.
- H.-G. Jung, S.-T. Myung, C. S. Yoon, S.-B. Son, K. H. Oh, K. Amine, B. Scrosati and Y.-K. Sun, Energy Environ. Sci., 2011, 4, 1345–1351 RSC.
- J. Yue, C. Suchomski, T. Brezesinski and B. M. Smarsly, ChemNanoMat, 2015, 1, 415–421 CrossRef CAS.
- Z. Zhu, F. Cheng and J. Chen, J. Mater. Chem. A, 2013, 1, 9484–9490 RSC.
- G.-N. Zhu, H.-J. Liu, J.-H. Zhuang, C.-X. Wang, Y.-G. Wang and Y.-Y. Xia, Energy Environ. Sci., 2011, 4, 4016–5022 RSC.
- P. Ge, H. Hou, S. Li, L. Huang and X. Ji, ACS Appl. Mater. Interfaces, 2018, 10, 14716–14726 CrossRef CAS PubMed.
| This journal is © the Partner Organisations 2019 |

