Structure–thermopower relationships in molecular thermoelectrics
Sohyun
Park†
,
Hungu
Kang†
and
Hyo Jae
Yoon
 *
*
Department of Chemistry, Korea University, Seoul, 02841, Korea. E-mail: hyoon@korea.ac.kr
First published on 21st May 2019
Abstract
Studies of molecular thermoelectrics help to reveal how atomic-detailed structural modification in molecules can affect the thermopower of molecular-scale devices. This review covers advances in the use of molecular junctions for studies of molecular thermoelectrics based on physical-organic approaches. Through a stepwise approach, this review provides (i) a summary of the types of thermoelectric molecular junctions and thermopower measurement techniques employed in the field of molecular thermoelectrics, (ii) an extensive discussion on how they affect the thermoelectric data in terms of absolute value and distribution, and (iii) a comprehensive summary and analysis of structure–thermopower relationships established in the field.
1. Introduction
1.1. Organic thermoelectrics on a molecular scale: “Molecular Thermoelectrics”
Thermoelectrics focuses on the conversion of waste heat into electrical power in an environmentally friendly manner. Traditional thermoelectric devices depend predominantly on bulk inorganic materials. The thermoelectric efficiency of conventional inorganic materials still remains lower than the theoretical maximum efficiency (that is, the Carnot efficiency).1–4 Moreover, inorganic thermoelectric materials are usually composed of rare and/or toxic elements, and with such materials, it is difficult to fulfill the latest requirements of thermoelectric devices, such as flexibility, light weight, and solution-processability. As a result, organic thermoelectric materials and devices have attracted considerable attention in the last few decades.5–7 The efficiency of thermoelectric materials can be described with figure of merit ZT = σS2κ−1T. Higher electrical conductivity (σ) and Seebeck coefficient (S) values, and a lower thermal conductivity (κ) value result in high thermoelectric conversion efficiency. Organic materials are advantageous in terms of efficiency due to their low thermal conductivity. However, their electrical conductivity is usually much lower than that of inorganic materials. Therefore, efforts are being made to increase their efficiency through doping and other processes.7–10 For the development of organic thermoelectrics, the use of thin films of conductive organic polymers and molecules, as well as their composites with other organic and inorganic materials is a common approach to achieving high thermoelectric efficiency. For example, a ZT value of 0.42 has recently been reported by adjusting the doping density of a solution-processable organic material, poly(3,4-ethylenedioxythiophene):poly(styrenesulfonate) (PEDOT:PSS), through treatment with DMSO and ethylene glycol.9 Considering that the ZT value of commercialized inorganic thermoelectric devices is ∼1, the field of organic thermoelectrics is promising.It is difficult to obtain atomic-detailed structure–thermopower relationships for these organic thermoelectric devices primarily because of the complexities arising from the complicated (supra)molecular structures of active organic components and the ill-defined organic–electrode and organic–organic interfaces. Physical-organic chemistry focuses on changing a component—usually the chemical structure of a molecule—while keeping other components constant in a system, and permits one to draw a reliable inference on the structure–property relationship in general.11–13 Hence, physical-organic studies with the simple nanoscale architecture of the electrode–molecule–electrode junction could help isolate reliably the desired information on the structure–thermopower relationship from other effects. The results of physical-organic studies could provide design rules for the development of efficient organic thermoelectric materials and facilitate optimization of device performance. Moreover, fundamental studies on the thermopower of molecular-scale electronic devices could help obtain detailed information on the energy topography across devices and mechanisms of charge transport, which cannot be obtained via tunneling current measurement as a function of an external electric field. Molecular thermoelectrics remains relatively unexplored compared to molecular electronics. Few testbeds and (supra)molecular structures have been explored thus far in terms of thermopower. This is rather surprising given that the two research fields share the same energy landscape across molecular junctions and quantum-chemical mechanisms, at least in part. Only a few review articles14–18 on molecular thermoelectrics have been published since the first experimental demonstration of thermoelectric molecular junctions in the 1990s–2000s.19–23 To our knowledge, a comprehensive review of structure–thermopower relationships from a physical-organic point of view, with an emphasis on the role of chemical structural diversity in a physical-organic approach has not been published in molecular thermoelectrics literature. Rather, most of the previous review articles have focused on the physics and the technological aspects of thermoelectric devices such as theories and nano-fabrication.14–18 This review covers recent advances in the use of molecular junctions for molecular thermoelectrics studies based on physical-organic approaches. This review discusses the following topics stepwise: (i) a summary of the types of thermoelectric molecular junctions and thermopower measurement techniques employed in the field of molecular thermoelectrics, (ii) an extensive discussion on how they affect the thermoelectric data in terms of absolute value and distribution, and (iii) a comprehensive summary and analysis of structure–thermopower relationships established in the field.
1.2. Brief history of molecular thermoelectrics
In 1990, Williams and Wickramasinghe19 reported the first experimental measurement of thermoelectric voltage by means of scanning chemical potential microscopy (SCPM), an analog of scanning tunneling microscopy (STM) that can measure variations in chemical potential at the atomic scale. SCPM helped create a spatial map of thermoelectric potential variations at the atomic level upon the application of a temperature difference (20 K above ambient temperature) between a sample and the SCPM tip. Williams and Wickramasinghe19 tested two-dimensional (2D) materials such as MoS2 and graphite, and liquid crystals on graphite (Fig. 1a). In 1995, Poler et al.20 conducted a similar experimental measurement over a molecular monolayer by using the method (Fig. 1b) developed by Williams and Wickramasinghe.19 They measured the thermoelectric voltage of a guanine monolayer adsorbed on highly oriented pyrolytic graphite (HOPG) at a 20 K temperature differential. These two early studies were likely focused on obtaining surface information that was not readily accessible by conventional STM, and they did not report Seebeck coefficient values. | ||
| Fig. 1 (a) Chemical-potential-gradient image of MoS2 created with thermoelectric voltage (temperature differential = 20 K) measured by means of scanning chemical potential microscopy (SCPM). (b and c) Schematic diagram showing the experimental setup used for the first experimental measurement of the thermopower of molecular junctions. (a) Adapted with permission from ref. 19. Copyright 1990 Springer Nature 1990. (b) Reproduced with permission from ref. 20. Copyright 1995 American Chemical Society. | ||
Four years later, the thermopower of atomic-size metallic contacts was measured by Ludoph and Ruitenbeek.21 They formed atomic-size gold contacts using a mechanically controlled break junction (MCBJ) and measured simultaneously the conductance and thermopower of the junction at various temperature differentials. The thermoelectric voltage over the contact was measured under zero DC current bias while maintaining separate temperature differentials across the contact through application of ∼2 mW heating power to a heater on one side of the leads. The Seebeck coefficient measured in their study had a random value and sign (either positive or negative). This fluctuation in the value of the Seebeck coefficient was rather surprising, given that the conductance of an identical junction exhibited plateaus in its plot as a function of piezovoltage (corresponding to the contact size of the junction). They attributed this observation to the high sensitivity of thermopower to small changes in the atomic geometry of the contact, whereas the conductance was found to be insensitive to the same structural changes.
In 2003, Paulsson and Datta22 theoretically proposed that the thermopower of a single-molecule junction is detectable and can provide valuable information pertaining to the relative alignment of molecular orbital energy levels with respect to the Fermi level. They further analyzed the thermovoltage of guanine, which was measured by Poler et al.,20 and suggested that the thermoelectric function is dominated by the highest occupied molecular orbital (HOMO) level of the molecule and is thus characterized by p-type conduction.
In 2007, Majumdar and coworkers23 reported the first experimental determination of the thermopower of molecules. The authors used the STM-based break junction (STM-BJ) technique (Fig. 1c). In a typical experiment, a STM gold tip was made to travel repeatedly along the vertical direction to the gold surface, and many single-molecule junctions were formed that yielded many data points of open-circuit voltage (i.e., thermoelectric voltage) under the application of temperature differentials to the junctions. The resulting large quantity of thermoelectric voltage values enabled the authors to plot a histogram in which the peak and the error range (the full width at half maximum) were estimated. Finally, the Seebeck coefficient was estimated by plotting the mean thermovoltage as a function of the temperature differential. They estimated thermopower at the molecular level: +8.7 ± 2.1 μV K−1, +12.9 ± 2.2 μV K−1, and +14.2 ± 3.2 μV K−1 for 1,4-benzenedithiolate, 4,4′-dibenzenedithiolate, and 4,4′′-tribenzenedithiolate, respectively. This was the first result relevant to the structure–thermopower relationship (here, length-dependence). Since the time of these stimulating studies, several research teams have begun (i) investigating the thermopower of various molecules, (ii) developing new thermoelectric junction techniques, (iii) attempting to understand the fundamental mechanism of the thermoelectric function in a junction, and (iv) establishing thermopower–structure relationships.
2. Distribution of thermoelectric data
The Lorentzian-shaped transmission function, T(E) (eqn (1)), is useful for describing the shape of | (1) |
 | (2) |
Statistical analysis of thermoelectric data (e.g., thermoelectric voltage (ΔV) and Seebeck coefficient (S) histograms) is a key step for establishing reliable and robust structure–thermopower relationships. The importance of statistical analysis has been well emphasized in molecular electronics.13,28,29 Because of trace-by-trace, junction-to-junction, and sample-to-sample variations in measurements, molecular conductance histograms have usually shown broad distributions to some extent.30–32 Similarly, thermoelectric junction measurements have usually shown dispersed values of ΔV.14 Moreover, statistical analysis is important for determining the value of S from thermovoltage datasets. Given that the value of the Seebeck coefficient is determined by linear regression fitting of ΔV values measured at different ΔT, the dispersion of ΔV data and its trend analysis (usually using linear square fitting) could significantly affect not only the absolute value of S but also its distribution.25
Despite recent progress in molecular thermoelectrics, the reason for the dispersion of thermoelectric data at molecular junctions remains unclear.17,33 Although thermovoltage histograms are widely used in molecular thermoelectrics studies, interpretation of the aforementioned dispersion is uncertain.25 For example, in a histogram of ΔV, it is difficult to define the origin of secondary peaks found at a lower voltage.25 This difficulty is plausible considering that many undefined factors could induce junction-to-junction variations of thermopower.
Based on our literature survey, the origin of the thermoelectric data dispersion can be ascribed to two main factors: (i) testbeds (i.e., junction contacts) and (ii) (supra)molecular structures of active organic components.25 Thus, in the following sections, we will summarize the characteristics of individual testbeds that have been used thus far in molecular thermoelectrics studies in terms of fabrication and thermopower measurements. Thereafter, we will introduce how the dispersion of thermoelectric data is affected by the type of junction testbed measurement, in addition to discussing the supramolecular and molecular structures of active molecules inside junctions.
2.1. Testbeds in molecular thermoelectrics
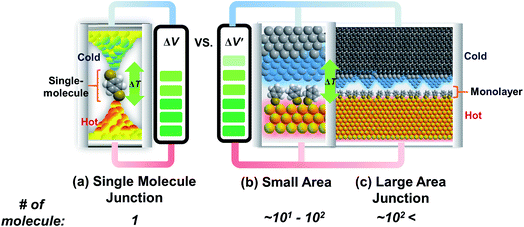
Research on molecular thermoelectrics has evolved in conjunction with the development of a variety of junction techniques. Differences in top and bottom electrodes, organic–electrode interfaces (e.g., methods to form contacts, anchoring groups, and presence/absence of a protective layer), and the number of active molecules contained inside a junction help distinguish various junction testbeds in terms of thermoelectric performance. The relationships between different junction structures (and measurement methods) and the function of thermoelectric junctions remain relatively unexplored compared to the analogous tunneling conductance junctions. Thus far, only a few types of junction techniques have been employed for thermopower measurements (Fig. 2). The early testbeds relied on MCBJ34–36 and STM-BJ23,37,38 techniques for single-molecule junctions. Later, atomic force microscopy (AFM) was used to measure the thermopower of small-area junctions (number of molecules contained in a junction = ∼101–102).39,40 Recently, a large-area thermoelectric junction (number of molecules in a junction > 102) was demonstrated with a soft top-contact comprising a eutectic gallium–indium alloy (EGaIn).41 In the following section, we will summarize these thermoelectric junctions point-by-point from three perspectives: (i) fabrication method, (ii) measurement method of ΔV and ΔT, and (iii) yield of working junctions.2.2. Single-molecule junctions
Molecular thermoelectrics studies have taken advantage of previously developed nanoscale platforms in molecular electronics. Fabrication of the ideal metal–single molecule–metal junction had long been a significant challenge in molecular electronics. This challenge has been resolved at least in part by several stimulating studies in the 1990s–2000s.19,20 Hence, early molecular thermoelectrics studies relied on single-molecule- and single-atomic-level thermoelectric measurements by using MCBJs,34–36,42,43 STM-BJs,23,37,38 and electron migration break junctions (EMBJs).44,45 Especially, MCBJs and STM-BJs have been used actively for characterizing the thermopower of single-molecules. | ||
| Fig. 3 (a) Schematic descriptions of the MCBJ system to form the Au–BDT–Au junctions by using a piezo-driven pushing rod that moves in a vertical direction. (b) Scanning electron micrograph of a microheater embedded in an MCBJ with a free-standing Au junction and Pt heater on Al2O3 layers on a polyimide coated phosphor bronze substrate. (c) Schematic descriptions of simultaneous measurement of conductance (G) and thermoelectric voltage (ΔV) of a single-molecule junction. (a–c) Adapted with permission from ref. 36. | ||
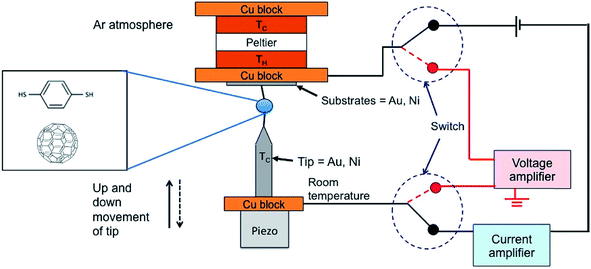 | ||
| Fig. 4 Schematic diagram of the thermovoltage measurement setup through switching of the circuit from the current amplifier to the voltage amplifier. The STM tip mounted on a Cu block is kept at room temperature and the temperature difference between the tip and the substrate is generated by heating the substrate with a Peltier device. The monolayers of BDT are formed by the incubation of substrates in a diluted solution of BDT. The STM tip approaches the substrate until reaching a certain threshold current value (G). Through the current amplifier connection, the current value can be monitored. After a certain threshold current value (G), the current amplifier is disconnected, and then the voltage amplifier is connected for the measurement of thermovoltage. Reproduced with permission from ref. 49. Copyright 2014 American Chemical Society. | ||
In the STM-BJ technique, thermopower can be measured by three different methods, namely, circuit switching,23,38,49,50 thermocurrent,37,51 and current–voltage (I–V) curve48,52 methods. Previously reported thermovoltage measurements by Reddy et al.,23 Lee et al.,49 and Yee et al.38 relied on circuit switching from the current amplifier to the voltage amplifier at the point where the formation of single-molecule junctions is confirmed by conductance measurement (Fig. 4). That is to say, when the system conductance approaches the threshold conductance at a given bias, the current amplifier is disconnected. Then, the voltage amplifier is connected to measure the thermoelectric voltage induced by the temperature difference, and the tip is retracted slowly. These steps are repeated to obtain statistically significant amounts of thermoelectric voltage data of single-molecule junctions. This technique cannot be used for simultaneous measurement of thermopower and conductance.17
Widawsky et al.37,51 reported a thermocurrent measurement technique that can measure conductance and thermopower simultaneously in the same junction. In this technique (Fig. 5), after a STM tip comes into contact with a substrate, the tip is withdrawn from the surface and the voltage bias is set to zero within a short time interval as soon as a single-molecule junction is formed. By simultaneously measuring conductance and thermocurrent at the moment when the tip is fixed, conductance and thermopower can be measured simultaneously at the same junction.37 The advantage of the thermocurrent measurement technique is that conductance and thermopower measured at the same junction can be reconciled directly and straightforwardly to understand the charge transport mechanism across the junction.
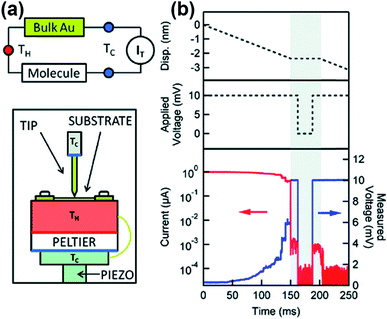 | ||
| Fig. 5 (a) Schematic descriptions of the thermocurrent technique in molecular junctions, showing the experimental setup and the thermal circuit. (b) Thermocurrent measurement is performed by the following procedure. First, the tip is withdrawn after the tip comes into contact with the substrate. When the molecular junction is formed during the tip withdrawal, the tip is fixed for 50 ms and the thermocurrent is measured with a bias voltage of zero. (a and b) Reproduced with permission from ref. 37. Copyright 2012 American Chemical Society. | ||
Based on the thermocurrent technique, Evangeli et al.52 developed the I–V curve technique to measure the thermopower of STM-BJs (Fig. 6a). In their measurements, the bias voltage is swept after fixing the distance between the STM tip and the substrate at intervals of 20–30 pm (Fig. 6b).52 When I–V curves are measured as a function of the temperature differential (ΔV = V0 = −SΔT, where V0 is the voltage offset, and S is the Seebeck coefficient), the corresponding voltage offset value induced by ΔT can be measured, as shown in Fig. 6b. With this measurement technique, information on the measured thermoelectric properties can be correlated with the tunneling spectroscopy results of molecules through I–V curves. For example, Rincón-García et al.53 were able to observe bi-thermoelectric single-molecule junctions by using the I–V curve technique. The authors studied the thermoelectric characteristics of Au//Sc3N@C80//Au STM-BJs, which exhibited both positive and negative thermopower depending on the orientation of the Sc3N single-molecule encapsulated by C80. This junction presents two different asymmetric I–V curves. The polarities of rectification were opposite, which was attributed to the orientation of the Sc3N molecule. Interestingly, Sc3N@C80 molecules with higher conductance at positive voltage (black line in Fig. 6c) exhibited negative thermopower (Fig. 6d), while the molecules with higher conductance at negative voltage (purple line in Fig. 6c) exhibited positive thermopower (Fig. 6e).53
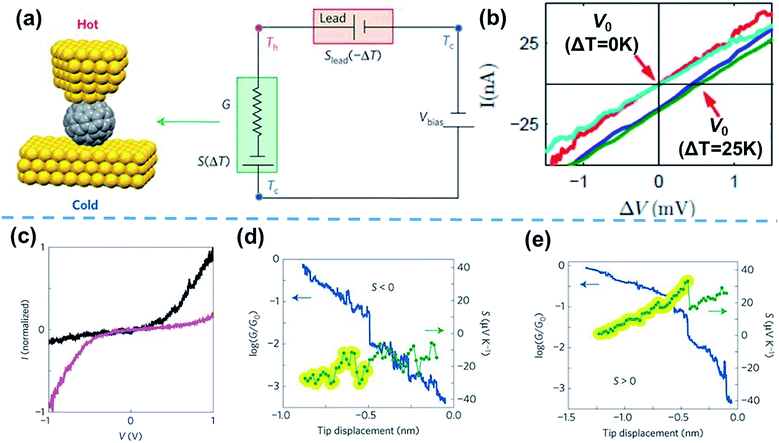 | ||
| Fig. 6 (a) Schematic describing the I–V curve technique for the simultaneous measurement of thermovoltage and conductance. (b) I–V curves measured at different temperature differentials (ΔT = 0 K and 25 K). The voltage offset induced by the temperature difference is emphasized. (c) I–V curves of two different Sc3N@C80 molecules in the tunneling regime, showing opposite rectifying behavior. Simultaneously measured conductance (blue) and thermopower (green) of Sc3N@C80 molecules, showing (d) negative and (e) positive thermopower. (b) Reproduced with permission from ref. 52. Copyright 2013 American Chemical Society. (a and c–e) Adapted with permission from ref. 53. Copyright 2016 Springer Nature. | ||
2.3. Small/large-area junctions
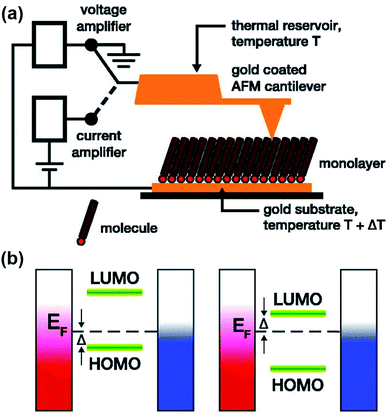 | ||
| Fig. 7 Schematic representation of (a) the experimental setup of a ThAFM-based small-area junction (the diagram was taken from the original work and simplified in terms of the number of molecules trapped in a junction), and (b) the energy separation between the HOMO or LUMO and the Fermi level of the electrode (EF). Adapted with permission from (a and b) ref. 40. Copyright 2012 AIP Publishing. | ||
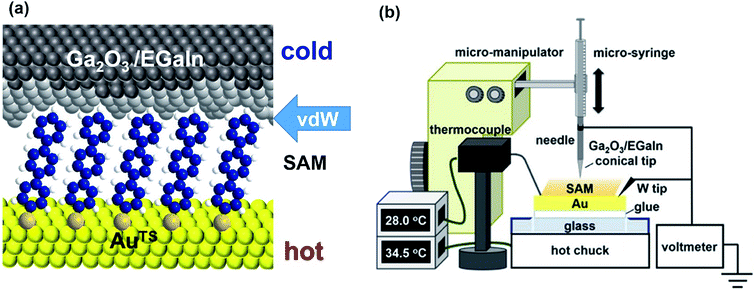 | ||
| Fig. 8 Schematic representation of (a) the structure of the large-area thermoelectric junction and (b) the experimental setup of the thermoelectric measurement based on EGaIn junctions. (a and b) Reproduced with permission from ref. 41. Copyright 2018 American Chemical Society. | ||
2.4. Origins of thermoelectric data dispersion
| Molecules | Junction method | Contact area | Number of data points | S (Seebeck coefficient, μV K−1) | Error range | Ref. |
|---|---|---|---|---|---|---|
| a In single-molecule junctions, Au atom–molecules–Au atom junctions were formed for BDT (yellow in Fig. 9), DBDT (4,4′-dibenzenedithiol; cyan in Fig. 9), and TBDT (4,4′′-tribenzenedithiol; pink in Fig. 9) molecules. In small area junctions, Au substrate–molecules–Au tip junctions were formed for BT (benzenethiol; yellow in in Fig. 9), BPT (biphenylthiol; cyan in Fig. 9), and TPT (terphenylthiol; pink in Fig. 9) molecules. In large area junctions, AuTS–molecules–Ga2O3/EGaIn junctions were formed for BT (yellow in Fig. 9), BPT (cyan in Fig. 9), and TPT (pink in Fig. 9) molecules. In small-/large-area junctions, the top-contact between the molecules and the Au tip/Ga2O3/EGaIn was formed via a vdW contact. | ||||||

|
STM-BJ | Single molecule | 500 | 7.7 | ± 0.5 | Malen et al.25,50 |
| ThAFM | Small area | — | 8.1 (mono-) | ± 0.8 (mono-) | Tan et al.39,40 | |
| 9.8 | ± 0.6 | |||||
| EGaIn | Large area | ∼3000 | 7.8 (mono-) | ± 0.4 (mono-) | Park et al.41 | |

|
STM-BJ | Single molecule | 500 | 10.8 | ± 0.6 | Malen et al.25,50 |
| ThAFM | Small area | — | 13.6 (mono-) | ± 1.2 (mono-) | Tan et al.39,40 | |
| 11.7 | ± 1.3 | |||||
| EGaIn | Large area | ∼6000 | 9.8 (mono-) | ± 0.2 (mono-) | Park et al.41 | |

|
STM-BJ | Single molecule | 500 | 15.1 | ± 0.9 | Malen et al.25 |
| ThAFM | Small area | — | 17.0 (mono-) | ± 1.0 (mono-) | Tan et al.39,40 | |
| 15.4 | ± 1.0 | |||||
| EGaIn | Large area | ∼6000 | 12.9 (mono-) | ± 1.5 (mono-) | Park et al.41 | |
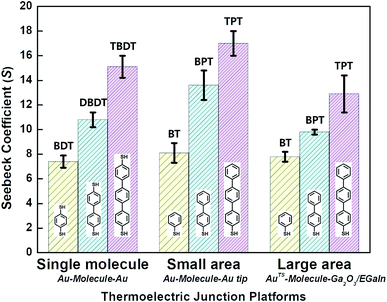 | ||
| Fig. 9 Comparison of thermopower measured using different junction methods. The Seebeck coefficient (S) of oligophenylene-dithiol or -monothiol molecules is measured using single molecule (Au, Au electrode), small-area (Au, Au), and large-area (Ga2O3/EGaIn, AuTS) junctions. In single-molecule junctions, Au atom–molecules–Au atom junctions were formed for BDT (yellow), DBDT (4,4′-dibenzenedithiol) (cyan), and TBDT (4,4′′-tribenzenedithiol) (pink) molecules. In small-area junctions, Au substrate–molecules–Au tip junctions were formed for BT (benzenethiol) (yellow), BPT (biphenylthiol) (cyan), and TPT (terphenylthiol) (pink) molecules. In large-area junctions, AuTS–molecules–Ga2O3/EGaIn junctions were formed for BT (yellow), BPT (cyan), and TPT (pink) molecules. In small-/large-area junctions, the top contact between the molecules and the Au tip/Ga2O3/EGaIn was formed owing to vdW force (ref. 25, 39 and 41). | ||
Overall, for all types of junctions, the dispersion of S values (corresponding to the error bars and σS values in Fig. 9 and Table 1, respectively) increases as the temperature differential or the number of oligophenylene units increases. The dependence of σS values could be rationalized by the increase in internal conformational complexity.25
Different junction methods can yield different thermopowers for identical molecules because the junctions have different organic–electrode interfaces. Early studies on molecular thermoelectrics focused mostly on single-molecule junctions. Thus, the way in which different junction techniques in single molecule junctions can affect the thermopower of a molecule can be rationalized in part by comparing the thermopower values of molecules incorporated into different single-molecule junction platforms. As shown in Fig. 10, the S values of BDT measured using the STM-BJ technique in separate studies are similar to each other (the blue-shaded box). Note that all the junctions shown in Fig. 10 used gold electrodes. Considering the error bars in the plot, these values are indistinguishable: 7.2 ± 0.2 μV K−1 (Baheti et al.24), 7.7 ± 0.5 μV K−1 (Malen et al.25), and 7.4 ± 0.5 μV K−1 (Lee et al.49). By contrast, the thermopower values of identical molecules estimated using different junction platforms such as ThAFM (9.8 ± 0.6 μV K−1; Tan et al.39) and MCBJ (15 ± 4 μV K−1; Tsutsui et al.36) (red-shaded box) differ significantly from the values measured using STM-BJs. This finding indicates that different junction methods can yield different thermopower values for the same molecule.
Even within the same junction method, the thermoelectric data of the same molecule could vary based on the way in which thermovoltage is measured. For example, Table 2 summarizes the data of thermoelectric measurements for the same molecule, namely, fullerene C60, in single-molecule junctions. Despite the use of the same junction method (STM-BJ), there is a significant difference in the dispersion of S values. Indeed, as shown in Fig. 11, the error ranges of S obtained via the switching circuit method (±1.2 and ±0.5 μV K−1)38,49 are smaller than those obtained via the I–V curve method (±6 and ±6.84 μV K−1).48,52 Details of the reason for this difference in error range remain uncertain. Recently, fine control over the S value has been achieved. Kim et al.57 have recently demonstrated that the S value of fullerene C60 can be manipulated by applying a gate voltage to electromigrated break junctions with integrated heaters (EBJIHs). When the gate voltage is zero, the S value is −12.4 μV K−1, as shown in Table 2. Upon the application of gate voltage from −8 to +8 V, the S value can be changed, ranging from −10 to −50 μV K−1. Details of this molecular thermoelectric gating will be discussed in Section 3.8. This technique opens up the possibility of controlling the thermoelectric properties systematically. However, the challenge of junction fabrication yield (∼3%) with this technique is yet to be overcome.57
| Molecule | Methoda | Contact area | Number of data points | S (mean value of the Seebeck coefficient) | Error range | Ref. |
|---|---|---|---|---|---|---|
| a Scanning tunneling microscopy break junction (STM-BJ); electromigrated break junction with integrated heaters (EBJIHs). b We could not find values that can determine whether there is statistical significance of data in the original work. c The error range is extracted from the FWHM of the thermovoltage histogram. d The error range is obtained from linear fitting of thermovoltage histogram peak values as a function of ΔT. e The error range corresponds to standard deviation of the histogram of experimental thermopower values. | ||||||

|
STM-BJ (circuit switching) | Single molecule | 500 | −14.5 | ±1.2c | Yee et al.38 |
| STM-BJ (circuit switching) | Single molecule | —b | −16.1 | ±0.5d | Lee et al.49 | |
| STM-BJ (I–V curve) | Single molecule | 200 | −12.0 | ±6 | Komoto et al.48 | |
| STM-BJ (I–V curve) | Single molecule | 50–100 | −18.0 | ±6.84e | Evangeli et al.52 | |
| EBJIHs | Single molecule | —b | −12.4 | — | Kim et al.57 | |
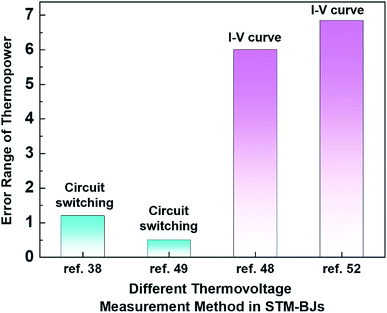 | ||
| Fig. 11 Comparison of the error range of thermopower for different measurement methods in STM-BJs: circuit switching (ref. 38 and 49) and I–V curve measurement methods in STM-BJs (ref. 48 and 52). | ||
2.5. Factors influencing the variation of thermovoltage
By analyzing the thermovoltage (ΔV) data obtained from single-molecule junctions of oligophenylene dithiolates, Malen et al.25 described the possible origins for the distribution of thermoelectric data. They estimated the full width at half maximum of thermovoltage (VFWHM) in thermovoltage histograms (Fig. 12a), and the variation of S values (ΔS) was obtained via linear square fitting of VFWHM values measured at different temperature gradients (ΔT).14,25 Positive values of ΔS were observed, and these values increased as the molecular length or the temperature difference increased (Fig. 12b). This finding indicates that VFWHM and ΔS are correlated with the temperature difference and the molecular length.14 They finally proposed that the following factors can contribute significantly to the variation of thermoelectric data (Fig. 12c): (i) contact geometry and hybridization, (ii) intermolecular interaction, (iii) average ring–ring torsion angle, and (iv) high frequency fluctuations with internal vibrations and rotations.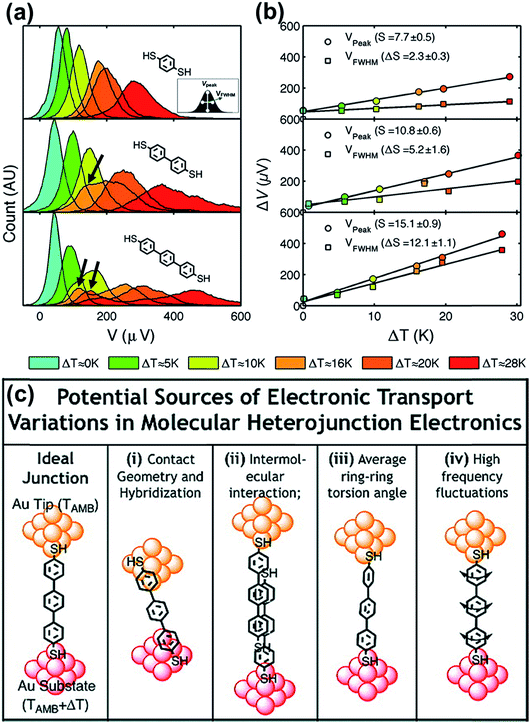 | ||
| Fig. 12 (a) Thermovoltage histogram of oligophenylene dithiolate as a function of temperature difference. The inset shows how to define Vpeak (corresponding to a peak value of distribution) and VFWHM (corresponding to the full width at half maximum of data distribution). The arrows emphasize the secondary peaks in the thermovoltage histograms. (b) The plot of Vpeak and VFWHM as a function of temperature difference (ΔT). (c) The sources of the variation of electronic transport in a molecular junction. (a–c) Adapted with permission from ref. 14. Copyright 2010 Elsevier. | ||
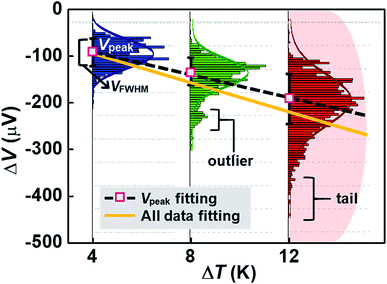
These factors can be recategorized depending on whether they stem from junction formation or from the structural features of molecules. Factor (i) is related closely to the manner in which a molecule is adsorbed on the surface of an electrode upon junction formation. Factors (iii) and (iv) depend predominantly on the structural complexity of a molecule, while factor (ii) is related more to the supramolecular structures of molecules dominated by lateral interactions with the neighboring molecules. In addition, we consider statistical analysis as another factor that can influence thermopower data. Note that when Vpeak is estimated, the outlier (e.g., secondary peaks at lower ΔV, see the ΔV histogram of terphenylene dithiolate in Fig. 12a) in ΔV histograms is commonly ignored. If this outlier is considered, the values of Vpeak and VFWHM may change considerably. Different statistical methods can yield different means and error ranges of thermovoltage and the Seebeck coefficient, which can critically influence the process of drawing reliable inferences about structure–thermopower relationships. Therefore, in the following section, we will summarize previous studies based on the points suggested by Malen et al. and based on statistical analysis.
 | (3) |
The ΔEHOMO term (ΔEHOMO/(EF − EHOMO)) in the equation can be influenced significantly by fluctuation in the junction structure near the electrode–molecule contact.25 Thus, the equation suggests that the contact motif of the molecule near the electrode plays an important role in determining the thermopower of a molecule. By contrast, Malen et al. showed that variation in the conductance of a molecular junction is related to both the variation in HOMO energy offset and the contact coupling (ΔΓHOMO), and thus, it can be expressed as follows:25,50
 | (4) |
According to this expression, the normalized variation of conductance (ΔG/G) is affected not only by ΔEHOMO but also by ΔΓHOMO. However, eqn (3), which describes the variation of thermopower, does not contain the coupling term (ΔΓHOMO),25 indicating that ΔS/S is dominated by ΔEHOMO rather than ΔΓHOMO.
A couple of experimental results consistent with the theoretical proposal of Malen et al. have been reported. Tsutsui et al.36 have attempted to change the binding configuration between the BDT molecule and an Au nanoelectrode by mechanically stretching the Au/BDT/Au junction after forming it using the MCBJ technique.36Fig. 13a shows the thermoelectric voltage (ΔV) and conductance (G) against stretching time t (s) measured by the authors. For measuring ΔV, three different types of ΔV–t traces were observed in three separate junction formations: rapid increase, steady rise, and steady decrease (denoted as RI, TR, and TD, respectively; red lines in Fig. 13a) in the absolute value of ΔV as a function of junction elongation. The authors suggested that the three different types of ΔV–t traces reflect the geometrical dependence of S of the BDT molecule (SBDT). That is to say, different adsorption configurations of the sulfur atom on an Au electrode (e.g., adsorption of the sulfur atom on a highly coordinated “hollow site” or less coordinated “top site” of the Au nanoelectrode, see Fig. 13b) lead to changes in the HOMO level with respect to the EF of the Au electrode (EF − EHOMO),58 resulting in the variation of thermoelectric properties according to eqn (3).36,59 Specifically, the RI in ΔV corresponds to sulfur adsorption on Au adatoms (i.e., adatom configuration), and it results in a high SBDT of 120 μV K−1 compared to the average SBDT of 15 μV K−1 (see the slopes in Fig. 12b).36 The transmission curve of SBDT = 120 μV K−1 calculated by using the Lorentzian expression supports this result with a considerably smaller value of EF − EHOMO (denoted as Egap; Egap = 0.10 eV) than the value of the average SBDT (Egap = 0.1 eV (Fig. 13b)). Furthermore, the authors confirmed that the change in the Γ value does not significantly influence the SBDT value, as shown in Fig. 13c. Therefore, Tsutsui et al.36 demonstrated that the contact geometry upon junction formation critically determines the energy alignment of the molecular orbital relative to EF, which in turn affects the variation of thermoelectric properties. This strongly supports the proposal of Malen et al.25
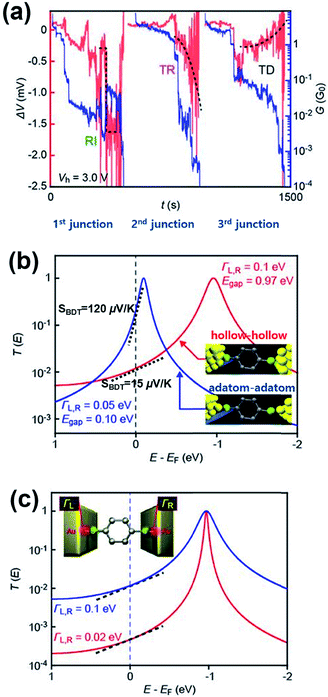 | ||
| Fig. 13 (a) The three types of ΔV (red) with the simultaneously recorded G (blue) during the stretching process: rapid increase (RI), steady rise (TR), and steady decrease (TD). (b) A transmission curve calculated for the SBDT (blue) with a ΓL,R of 0.05 eV and Egap of 0.10 eV, and SBDT (red) with a ΓL,R of 0.1 eV and Egap of 0.97 eV. The inset presents junctions having different configurations of hollow–hollow and adatom–adatom contacts. (c) A transmission curve calculated for the SBDT with a ΓL,R of 0.1 (blue) and 0.02 (red) eV in the same ΔE (EF − EHOMO), indicating no significant effect of ΓL,R value on S. The slope in T(E) at EF correspond to the Seebeck coefficient. (a–c) Adapted with permission from ref. 36. | ||
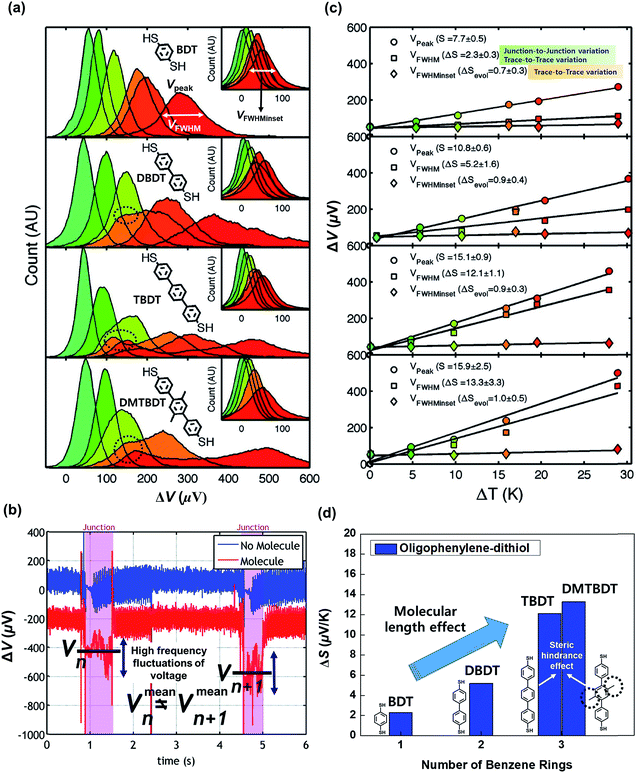 | ||
| Fig. 14 (a) Thermovoltage histograms of BDT, DBDT, TBDT, and DBTBDT molecules as a function of ΔT. From the histograms, Vpeak, VFWHM, and VFWHMinset values were extracted. (b) Voltage traces for two consecutive molecular junctions. Vmeann and Vmeann+1 indicate the mean values of thermovoltage in the two consecutive (nth and n + 1th) molecular junctions, respectively. Each junction involves the high frequency fluctuation of thermovoltage. Different values of Vmeann and Vmeann+1 represent the significant junction-to-junction variation. (c) Plots of Vpeak, VFWHM, and VFWHMinset values as a function of ΔT. Linear square fitting of these values yields S values, the variation of S values (ΔS), and the evolution of S values (ΔSevol). (d) Comparison of ΔS for oligophenylene molecules having different lengths and different degrees of steric hindrance. Reproduced with permission from ref. 25. Copyright 2009 American Chemical Society. | ||
Moreover, Malen et al.25 investigated the effect of the ring–ring torsion angle of the molecular backbone on the variation of S by comparing the thermopowers of TBDT and 2′,5′-dimethyl-4,4′′-tribenzenedithiol (DMTBDT) molecules. These two molecules have similar molecular lengths but different backbone structures (Fig. 14d), thus allowing for a reliable investigation of how the increased steric hindrance affects thermoelectric junction measurements. The steric hindrance in the internal backbone of the DMTBDT molecule could disturb the ring–ring torsion motion relative to the TBDT molecule. In a comparison of the variation of the S values of TBDT and DMTBDT molecules, there was no significant difference between the ΔS values of TBDT and DMTBDT (12.1 and 13.3 μV K−1, respectively), as shown in Fig. 14d. This result demonstrates that the ring–ring torsion angle of the molecular backbone has an insignificant effect on the variation of the S value.25
Fig. 15 shows an example of a hypothetical thermoelectric histogram including some outliers and tails. The outliers and tails become significant as ΔT increases. Most of the early molecular thermoelectrics studies used peak (ΔVpeak) and FWHM (ΔVFWHM) values of thermovoltage histograms to determine S values. This traditional method does not consider outliers and tails in histograms. Consequently, this method may ignore any important thermoelectric features contained in the outliers and tails, which could arise from molecular or junction structures. If we can obtain S values considering all data, the slope of the ΔV–ΔT plot may change (Fig. 15), leading to a different S value. Further study is needed to establish the importance of statistical analysis in thermoelectric studies. Accordingly, it can be inferred that the S value can be sensitive to the statistical method and may depend on whether the outlier and the tail parts are considered when plotting the slope of linear regression.
3. Structure–thermopower relationships
3.1. Overview
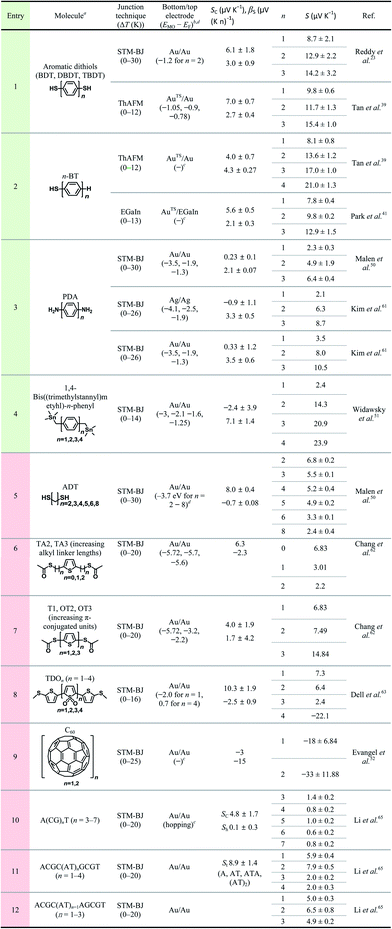
Table 3 summarizes the scope of the substrate in molecular thermoelectrics studies. Similar to the limited number of testbeds, the scope of the chemical structures in molecular thermoelectrics is relatively narrow as compared to that in molecular electronics. Indeed, according to our survey of substrate scope in Table 3, oligophenylene derivatives are the only class of molecules that have been characterized thermoelectrically on multiple junction platforms (single-molecule vs. small-area vs. large-area thermoelectric junctions). Hence, these molecules potentially serve as references in molecular thermoelectrics studies and facilitate comparison of thermoelectric characteristics among different junction techniques.17 The thermoelectric junctions incorporating oligophenylene derivatives have thus far shown that thermopower depends on (i) the length of the oligophenylene backbone,23,39–41 (ii) the anchoring group of molecules over the bottom-electrode,24,39 and (iii) the proximity of the frontier molecular orbital energy to the Fermi level of the electrode.24,40
a BDT = 1,4-benzenedithiol; DBDT = 4,4′-dibenzenedithiol; TBDT = 4,4′′-tribenzenedithiol; n-BT = 1-n-benzenethiol; PDA = 1,4-n-phenylenediamine; ADT = n-alkanedithiol; TA2 = S,S′-thiophene-2,5-diylbis(methylene) diethanethiol; TA3 = S,S′-2,2′-(thiophene-2,5-diyl)bis(ethane-2,1-diyl) diethanethiol; T1 = S,S′-thiophene-2,5-diyl diethanethiol; OT2 = S,S′-([2,2′-bithiophene]-5,5′-diyl) diethanethiol; OT3 = S,S′-([2,2![[thin space (1/6-em)]](https://www.rsc.org/images/entities/char_2009.gif) : :![[thin space (1/6-em)]](https://www.rsc.org/images/entities/char_2009.gif) 5′,2′′-terthiophene]-5,5′′-diyl) diethanethiol; TDO = thiophene-1,1-dioxide; A, C, G, T = the four DNA bases, adenine, cytosine, guanine and thymine, respectively.
b
E
MO − EF values are estimated from T(E) plots.
c
E
MO − EF values are not available from the literature, or charge transport relies on the regime other than tunneling (i.e., hopping).
d For n-alkanethiol, we used the literature value, EHOMO = −8.9 eV.75 5′,2′′-terthiophene]-5,5′′-diyl) diethanethiol; TDO = thiophene-1,1-dioxide; A, C, G, T = the four DNA bases, adenine, cytosine, guanine and thymine, respectively.
b
E
MO − EF values are estimated from T(E) plots.
c
E
MO − EF values are not available from the literature, or charge transport relies on the regime other than tunneling (i.e., hopping).
d For n-alkanethiol, we used the literature value, EHOMO = −8.9 eV.75
|
|---|
|
Thermoelectrics studies that have examined the structure–thermopower relationship have relied predominantly on the physical-organic approach, in which the structure of a component (mostly an active organic molecule) is varied while maintaining other components (e.g., interfaces and electrodes) in a thermoelectric junction constant. The majority of molecular thermoelectric studies have focused on the length dependence23,39,41,50–52,61–63 of thermopower. A limited number of studies have investigated the effects of the interface and substitution on thermopower24,38,39,49,50,61,64 and exotic thermoelectric properties, such as the dependence of thermopower on the base pair sequence of DNA,65 Peltier cooling,66 and molecular gating of thermopower.57 In the following sections, we will discuss these studies.
3.2. Length dependence
The Landauer formula (eqn (2)) can be used to relate the Seebeck coefficient (S) to the transmission function T(E), which is expressed by fitting Lorentzians to the frontier orbitals (e.g., HOMO and LUMO) (eqn (1)).22,67,68 Quek et al.69 have shown that the linear correlation of the Seebeck coefficient (S) with the length of oligophenylenes could be analyzed using a simplified parametric equation (eqn (5)).| SSAM = SC + n × βS | (5) |
In eqn (5), n is the length of the molecular backbone (presented as the number of repeating units (e.g., phenylene or methylene), or measured in Å); βS is the rate of change of thermopower with n (μV (K n)−1); and SC is the thermopower of a hypothetical junction where n = 0 (i.e., non-shorting junction without the most insulating part, usually the backbone of a molecule), reflecting the thermopower of non-molecular components in the junction.22,70
The molecular backbones that have been investigated thus far for length dependence of thermopower include phenylene,23,39,41,50,51,61n-alkane,50,62 thiophene,62 thiophene 1,1′-dioxide,63 fullerene C60,52 and DNA.65 Length dependence studies are usually designed to vary the number of repeating units in the molecular backbone, while keeping other molecular and junction structures unchanged. Table 3 summarizes previous studies that have focused on the length dependence of thermopower. We categorized these studies primarily according to the type of molecular backbone (see the different colors in the entry).
The thermopower of the phenylene backbone has been tested with different anchoring groups and testbeds (entries 1–5 in Table 3). Reddy et al.23 first determined experimentally the length dependence of thermopower with oligophenylene dithiolates in 2007. They showed the linear correlation of the Seebeck coefficient with the number of phenylene units in Au/S(Ph)nS/Au (n = 1, 2, 3) single-molecule junctions formed using the STM-BJ technique (entry 1 in Table 3). Tan et al.39 first formed small-area thermoelectric junctions by using the ThAFM technique to investigate the length dependence of thermopower in a SAM of oligophenylene dithiolates and monothiolates (entries 1 and 2 in Table 3). The monothiolate junction has the structure Au/S(Ph)n//Au (n = 1, 2, 3, 4), where “//” denotes a vdW top-interface. Recently, Park et al.41 first demonstrated thermoelectric large-area junctions with a liquid metal EGaIn top-contact, and studied the thermopower of AuTS/S(Ph)n//Ga2O3/EGaIn junctions (n = 1, 2, 3), where AuTS is ultraflat template-stripped gold (entry 2 in Table 3). Oligophenylenes with anchoring groups other than thiol have been incorporated into single-molecule junctions. Malen et al.50 and Kim et al.61 characterized the length dependence of thermopower for Au/H2N(Ph)nNH2/Au (n = 1, 2, 3) STM-BJs (entry 3 in Table 3). Widawsky et al.51 used trialkyltin moieties as the anchoring group in Au/Me3Sn-(Ph)n-SnMe3 (n = 1, 2, 3, 4) STM-BJs and measured the resulting thermopower (entry 4 in Table 3).
Entries 1–3 in Table 3 show that all the molecules of phenylene backbones have βS values of 2.1–4.3 μV (K n)−1 (where n is the number of phenylene units) with positive polarity for HS(Ph)nSH, HS(Ph)n, and H2N(Ph)nNH2 molecules. The Me3Sn-(Ph)n-SnMe3 molecule has a βS value of 7.1 μV (K n)−1, approximately two times higher than those of the thiol and amine derivatives. The reason for this difference in βS values is unclear. All junctions in entries 1–4 exhibited positive βS values, which could be accounted for by the decreased height of the tunneling barrier as a result of the increased conjugation length of oligophenylenes. When the conjugation length increases in oligophenylene derivatives, the HOMO–LUMO gap decreases. Thus, the increased length decreases the energy offset (ΔE = EMO − EF) between the Fermi level (EF) of the electrode and the transport frontier orbital (EMO). Notably, the length dependence of thermopower in oligophenylene-based thermoelectric junctions is opposite to the length dependence of molecular electrical conduction in the analogous tunneling junctions. That is, as the number of phenylene units increases, the value of S increases and the current density (J, A cm−2) decreases.71,72
Given that quantum tunneling-based conduction of n-alkane chains has been widely studied,28,70,73–77 it is surprising that very few (only two, to our knowledge) studies have investigated the thermopower of analogous systems. Malen et al.50 have shown the length dependence of thermopower in Au/S(CH2)nS/Au (n = 2, 3, 4, 5, 6, 8) STM-BJs (entry 5 in Table 3). Chang et al.62 have varied the length of the n-alkyl spacer between the anchoring group and the middle thiophene moiety by incorporating the CH3(O)CS-(CH2)n-thiophene-(CH2)n-SC(O)CH3 (n = 0, 1, 2) molecule into STM-BJs (entry 6 in Table 3). These thermoelectric junctions exhibited βS values of negative polarity, −0.7 and −2.3 μV (K n)−1 for HS(CH2)nSH and CH3(O)CS-(CH2)n-thiophene-(CH2)n-SC(O)CH3, respectively. Unlike oligophenylenes, both tunneling current density and thermopower decrease as the length increases. However, the rates of decrease differ: the tunneling current density decreases exponentially with increasing length,28,29 while the thermopower shows linear regression. The polarity of βS for n-alkanes is opposite to that for oligophenylenes, and the reason for this is yet to be determined. An explanation for the negative value of βS in n-alkanes has been suggested by Malen et al.50 Upon the chemisorption of n-alkanethiols onto the gold substrate, new energy states called metal-induced gap states (MIGSs) are formed between a HOMO–LUMO gap.78–81 The MIGSs result from the orbital mixing of gold and sulfur atoms present at the interface with some of the hydrocarbons in the n-alkane. The magnitude of the transmission coefficient of MIGSs depends on the length of n-alkanes, which accounts for the length dependence of thermopower in short n-alkanethiolates, consistent with the observation of Malen et al.50 In molecular electronics, the full length range of the n-alkane chain that can be measured reliably in tunnel junctions is usually from SC1 to SC18.28 By contrast, extant previous thermoelectrics studies have explored short n-alkane chains (e.g., SCn where n = 2–8).50 Notably, none of these studies have shown the thermopower of n-alkane monothiolates, whereas the tunneling conduction across these molecules has been determined extensively in molecular electronics studies. Chang et al.62 attributed the decrease in S value with the length of the n-alkyl spacer in CH3(O)CS-(CH2)n-thiophene-(CH2)n-SC(O)CH3 to the increase in spatial distance between the middle aromatic moiety (thiophene) and the electrodes, which results in electronic isolation of the orbital energy levels of the thiophene from the energy levels of the electrodes.
The length dependence of thermopower has been studied on another type of π-conjugated system as well, namely, oligo-thiophene derivatives. Chang et al.62 further studied the length dependence of thiophene molecules in STM-BJs (entry 7 in Table 3). The S value of oligothiophenes increases as the number of thiophene units increases. This length dependence is consistent with that of oligophenylene. Dell et al.63 formulated a unique system in which the type of charge carrier depends on the length of the molecular backbone. They studied the thermoelectric properties of single-molecules composed of electron-deficient oligo(thiophene-1,1-dioxide) (denoted as TDO) building blocks (entry 8 in Table 3). Their results show that the dominant charge carriers change from holes (p-type) to electrons (n-type) as the number of TDO units increases. This finding implies that the accessible frontier orbital is switched from the HOMO to the LUMO once the molecule length increases.
Evangeli et al.52 reported an experimental study in which both conductance and the Seebeck coefficient increased negatively as the number of fullerene C60 units increased in the molecular backbone in junctions. Especially, when the number of fullerene C60 units increased from one to two, the absolute value of the Seebeck coefficient increased by a factor of approximately two. This result was explained based on an increase in the intermolecular coupling and the proximity of the energy level of the frontier orbitals to the Fermi level of the electrode, which was confirmed through density functional theory (DFT) calculations.
All Seebeck coefficient values summarized in Table 3 have a positive sign, except those for the long oligomer of thiophenene-1,1′-dioxide (entry 6) and fullerene C60 (entry 9). The positive sign of the S value indicates that the majority of tested molecules have the electronic structure in which the high-lying occupied orbitals rather than the low-lying unoccupied orbitals are close to the Fermi level of the electrode. By contrast, only two types of molecules use the low-lying unoccupied orbitals for thermopower generation.
Fig. 16a compares the βS values of the different backbones summarized in Table 3. Regardless of the type of testbed (single-molecule vs. small-area vs. large-area junctions) and the type of anchoring group, all βS values of the conjugated backbones are positive, except for that of oligoTDO. The βS values of the saturated hydrocarbon backbones are negative although only two data points are available from the literature. Fig. 16b compares the interfacial thermopower (SC in eqn (5)) values of different types of anchoring groups (dithiol, monothiol, thioacetate, methyl sulfide, trialkyltin and diamine). The thiol-based anchoring groups (dithiol, monothiol, thioacetate and methyl sulfide) exhibit positive SC values ranging from 3 to 10 μV K−1. According to our estimation based on the data available in the literature, small positive and negative values of SC are observed for the diamine (0.23 μV K−1) and trialkyltin (−2.4 μV K−1) anchoring groups, respectively. The reason for the difference between these values and the SC values of oligophenylenes is yet to be ascertained.
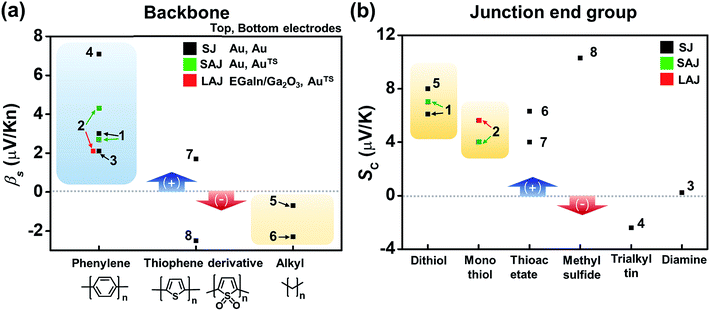 | ||
| Fig. 16 Comparison of (a) βS and (b) SC values for different backbones and anchoring groups based on Table 3. The numbers in the plots correspond to the entry number of Table 3. Data of fullerene C60 and DNA (entries 9–12 in Table 3) are excluded because the C60 units are linked to each other via a van der Waals contact, not a covalent one, and the thermopower of DNA molecules depends on the charge transport regime (hopping process). Details of these thermoelectric characteristics are discussed in detail in other sections (3.4 and 3.6). SJ, SAJ and LAJ denote single-molecule, small-area, and large-area junctions, respectively. | ||
3.3. Interface effect (anchoring group and electrode)
Tan et al.39 studied the role of contact coupling chemistry in the thermopower of molecular junctions with the ThAFM technique. The thermopower of two analogous junctions with and without the vdW interface (Au/S(Ph)nS/Au vs. Au/S(Ph)n//Au; Fig. 17a) has been compared. The authors observed that the replacement of the terminal group from –SH to –H at the top interface results in the reduction of electrical conductance. This was attributed to the decrease in the coupling of the molecule with the top-electrode. In contrast, the thermopower change in the same junctions was only a few percent. This finding indicates that the thermopower of the vdW interface is similar to that of the covalent interface (Fig. 17b).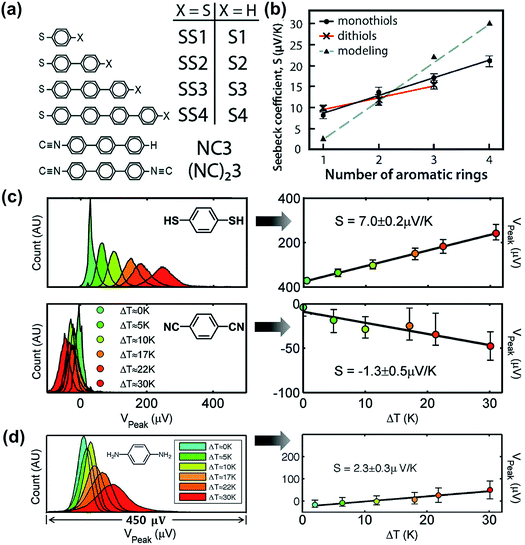 | ||
| Fig. 17 (a) Molecules studied by Tan et al. (ref. 39). (b) The plot of experimentally (solid lines) and theoretically (dotted line) measured S values against the number of phenylene units. Reproduced with permission from ref. 39. Copyright 2011 American Chemical Society. (c) Thermovoltage histograms of 1,4-benzenedithiol and 1,4-phenylene diisocyanide at different ΔT, and the corresponding plots of peak values of the histograms (Vpeak), which clearly show the opposite polarity of thermopower (the error bars correspond to VFWHM of the corresponding histograms). Reproduced with permission from ref. 24. Copyright 2008 American Chemical Society. (d) Thermovoltage histograms of 1,4-phenylenediamine (PDA) at different ΔT, and the corresponding plot of Vpeak values against ΔT to estimate the S value. (a and b) Reproduced with permission from ref. 39. Copyright 2011 American Chemical Society. (c) Reproduced with permission from ref. 24. Copyright 2008 American Chemical Society. (d) Reproduced with permission from ref. 50. Copyright 2009 American Chemical Society. | ||
The authors further investigated the effect of anchoring group on the thermopower of molecular junctions.39 While the junctions of thiol-terminated aromatic molecules exhibited positive values of the Seebeck coefficient, the analogous junctions of isocyanide-terminated aromatic molecules exhibited negative values (Fig. 17c). The energy offset, EMO − EF, was −0.78 eV and +1.82 eV for terphenyl dithiolate and dicarbonitrile junctions, respectively, and this difference in the energy offset accounted for the opposite sign of S values for the two anchoring groups. This implies that the anchoring group plays an important role in determining the transport character, namely, p- vs. n-type. Baheti et al.24 studied the thermoelectric characteristics of similar molecules and confirmed the polarity change of S with quantum-chemical calculations.82
Malen et al.50 compared the values of the Seebeck coefficient (S) for phenylene with different anchoring groups (–SH vs. –NH2). Similar to the thiol anchoring group as shown in Fig. 18c, amine-terminated aromatic molecular junctions showed positive values of S that increase linearly with increasing molecular length because of HOMO-based charge transport (Fig. 17d). Kang et al.83 recently reported S values for molecules with the NHC (N-heterocyclic carbene) anchoring group. The thiol anchoring group is easily oxidized and decomposed under ambient conditions.84–86 Crudden et al.87 demonstrated that replacing thiol with NHC as the anchoring group in SAMs can help to overcome the instability issue in thiol-based SAMs. Molecular junctions that had the structure of AuTS/NHC(Ph)n//Ga2O3/EGaIn (n = 0, 1, 2) showed positive values of S. The S value increased linearly with increasing molecular length like the junctions formed with SAMs based on thiol and amine anchoring groups.
 | ||
| Fig. 18 The effect of different electrodes on the thermopower of the molecular junction. (a) The different EF in T(E) according to different work functions of electrodes (Pt ≈ 5.6 eV (blue), Au ≈ 5.1 eV (green), and Ag ≈ 4.5 eV (red)), which yields different S values. Reproduced with permission from ref. 38. Copyright 2011 American Chemical Society. (b) Schematic illustration of the effect of spin hybridization between the HOMO of a molecule (BDT) and the Ni electrode on the shape of the transmission coefficient (T(E)) in the Ni/BDT/Ni junction. In the T(E) diagram, the red and blue arrows show up and down spins. The T(E) diagrams from top to bottom show negligible, weak/moderate, and strong spin hybridization between the HOMO and the Ni electrode. The corresponding plots of thermovoltage (ΔV) against temperature differential (ΔT) show the opposite sign of thermopowers for a BDT molecule anchored on Au and Ni electrodes. (a) Reproduced with permission from ref. 38. Copyright 2011 American Chemical Society. (b) Reproduced with permission from ref. 49. Copyright 2014 American Chemical Society. | ||
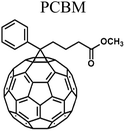
A few studies have investigated the thermopower of heterojunctions, where a molecule is trapped between two different metal electrodes, to understand the role of the organic–electrode interface in charge transport characteristics. Yee et al.38 measured thermopower of fullerene derivatives such as C60 (entries 1–3 in Table 4), PCBM (entries 4–6), and C70 (entries 7–9) trapped between asymmetric metallic electrodes (Pt, Au, and Ag). They revealed that fullerene molecules' thermopower is correlated with the gap between the LUMO and the Fermi level of the electrode (Pt ≈ 5.6 eV, Au ≈ 5.1 eV, Ag ≈ 4.5 eV). The S value was negatively increased in the order of Pt < Au < Ag. This finding implied that the transmission function T(E) was dominated by ΔE = ELUMO − EF (Fig. 18a). On the other hand, the coupling of the molecule with the electrode Γ varied weakly with the change of the electrode, indicating that the variation of Γ did not significantly affect the thermopower.
| Entry | Moleculea | Bottom electrode | Top electrode | E MO − EFb (eV) | ΔT (K) | S (μV K−1) | Ref. | |
|---|---|---|---|---|---|---|---|---|
| a PCBM = [6,6]-phenyl-C61-butyric acid methyl ester; PDA = 1,4-n-phenylenediamine; BDT = 1,4-benzenedithiol. b If the original work did not report EMO − EF values, we calculated these values using the following literature values of EF and EMO: C60 LUMO level (−4.3 eV),88 PCBM LUMO level (−3.83 eV),89 C70 LUMO level (−4.04 eV),90 BDT EMO − EF = −1.2 eV,23 Au EF = −5.1 eV, Ag EF = −4.5 eV.50 | ||||||||
| 1 |

|
Au | Pt | 1.05 | 0–30 | −8.9 ± 2.2 | Yee et al.38 | |
| 2 | Au | Au | 0.8 | −14.5 ± 1.2 | ||||
| 3 | Au | Ag | 0.5 | −29.6 ± 3.4 | ||||
| 4 |
|
Au | Pt | 1.52 | 0–30 | −7.6 ± 3.2 | Yee et al.38 | |
| 5 | Au | Au | 1.27 | −16.4 ± 1.6 | ||||
| 6 | Au | Ag | 0.97 | −30.0 ± 2.6 | ||||
| 7 |

|
Au | Pt | 1.31 | 0–30 | −8.4 ± 1.9 | ||
| 8 | Au | Au | 1.06 | −20.1 ± 1.4 | ||||
| 9 | Au | Ag | 0.76 | −33.1 ± 8.8 | ||||
| 10 |

|
Ag | Ag | n = 1 | −4.1 | 0–26 | 2.1 | Kim et al.61 |
| 2 | −2.5 | 6.3 | ||||||
| 3 | −1.9 | 8.7 | ||||||
| 11 | Au | Au | n = 1 | −3.5 | 3.5 | |||
| 2 | −1.9 | 8.0 | ||||||
| 3 | −1.3 | 10.5 | ||||||
| 12 |

|
Au | Au | −1.2 | 0–15 | 7.44 ± 0.5 | Lee et al.49 | |
| 13 | Ni | Ni | 0.4 | −13.8 ± 1.8 | ||||
Kim et al.61 examined the role of different electrodes in the thermopower of single-molecule junctions as well. Thermoelectric junctions of PDA were formed on silver or gold electrodes. The Au/PDA/Au junction exhibited a larger positive Seebeck coefficient by a factor of ∼1.4 than the analogous junction with Ag electrodes. This was attributed to the lower work function of Ag by a factor of ∼1.1 than that of Au (entries 10–11 in Table 4), which ultimately changed the energy offset, ΔE = EMO − EF.
Lee et al.49 investigated how the thermopower of a molecular junction is influenced by the spin hybridization between the electrode and the molecule. They constructed thermoelectric molecular junctions of the BDT molecule with Au and Ni electrodes, respectively, using the STM-BJ technique, and compared the thermopower between them (entries 12–13 in Table 4). The sign of the S value depended predominantly on the type of electrode. The Au/BDT/Au junction exhibited a positive S value because the HOMO energy level of the BDT was closer to EF of the Au electrode than the LUMO. By contrast, the Ni/BDT/Ni junction exhibited a negative S value although the work function of Ni (∼5.0 eV) is similar to that of Au (∼5.1 eV). Quantum-chemical calculation revealed that strong spin-split hybridization of the HOMO energy level of the BDT coupled with s- and d-states of the Ni electrode yielded two large T(E) peaks corresponding to up and down spins (Fig. 18b). The T(E) peak of the down spin arose near the EF, thereby leading to a negative S value (the blue data points in Fig. 18b).
3.4. Substitution effect (covalent functionalization and non-covalent encapsulation)
A couple of studies in the literature have focused on the role of chemical functionalization of the molecular backbone in the thermopower of molecular junctions. These studies have relied on a well-defined physical-organic approach: the molecule inside a junction is chemically functionalized via covalent or non-covalent bonds while the length of the molecule and other junction structures (e.g., anchoring group and top/bottom electrodes) remains constant. Baheti et al.24 examined how the thermopower is associated with the chemical functionalization of the phenylene backbone in STM-BJs. They focused on thermoelectric junctions of oligophenylene derivatives having the structure Au/S(Ph-Rn)S/Au (where Rn = 2,3,5,6-Cl4; 2,3,5,6-F4; 1,4-dimethyl). They found that the substitution of hydrogen atoms in the phenylene backbone with electron-withdrawing groups (F and Cl) led to a decrease in the S value by a factor of ∼1.3 and ∼1.8 for fluorine (5.4 ± 0.4 μV K−1) and chlorine (4.0 ± 0.6 μV K−1), respectively, as compared to the S value (7.2 ± 0.2 μV K−1) of the intact backbone (Fig. 19a). In contrast, substitution with a donating group (–CH3) increased the S value (8.3 ± 0.3 μV K−1) by a factor of ∼1.1. These findings revealed that the Seebeck coefficient depends on the proximity of frontier molecular orbital energy to the Fermi level of the electrode (ΔE = EMO − EF), which could be manipulated through the addition of electron-withdrawing or -donating groups into the backbone of molecules. This conclusion was reinforced by the simulation of S values based on the transmission function and Landauer formula (Fig. 19b).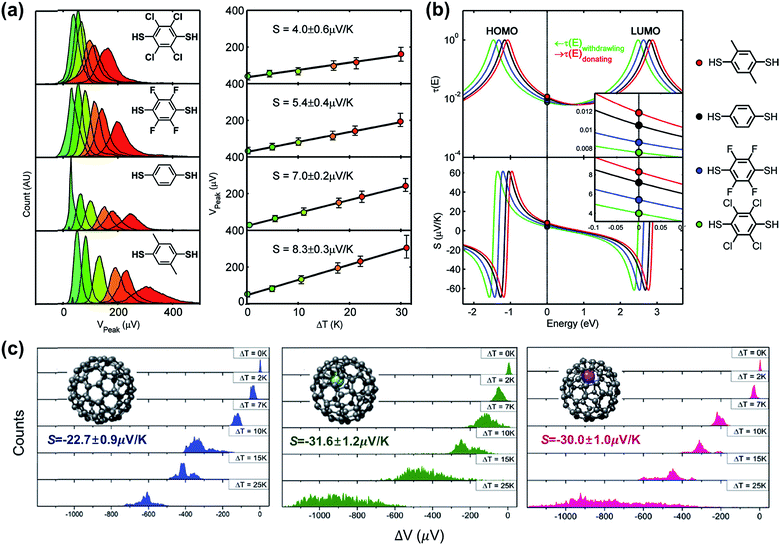 | ||
| Fig. 19 (a) Normalized thermoelectric voltage histograms at different temperature differentials (ΔT), and the corresponding plots of voltage peaks (mean values of thermoelectric voltage, denoted as Vpeak) as a function of ΔT (K) in substituted BDT junctions. (b) Relation between the Seebeck coefficients of substituted BDT junctions and the position of EF in T(E). (c) Thermoelectric voltage histograms at different ΔT for C82, Gd@C82 and Ce@C82 molecules (from left to right). (a and b) Reproduced with permission from ref. 24. Copyright 2008 American Chemical Society. (c) Reproduced with permission from ref. 64. Copyright 2015 Royal Society of Chemistry. | ||
Lee et al.64 obtained the thermopower and conductance of endohedral metallofullerene (EMF) derivatives (Gd@C82 and Ce@C82), which had the structure of a C82 encapsulating a metal atom (Gd or Ce). The authors observed that the encapsulation of the metal atom shifted the fullerene's LUMO toward the EF of the Au electrode, and thus, this resulted in the transport mainly through the LUMO localized on the C82 cage in the EMF derivatives. Finally, the S values increased toward negative values (−31.6 ± 1.2 μV K−1 and −30.0 ± 1.0 μV K−1 for Gd@C82 and Ce@C82, respectively) as compared to the C82 molecule without any metal atom (−22.7 ± 0.9 μV K−1) (Fig. 19c). Considering that many organic molecules showed p-type thermoelectric properties (see Table 4), the negative thermopower was insightful in that the n-type thermoelectric character could be enhanced by incorporation of a metal atom into fullerene.
The increase and decrease of S values summarized in Sections 3.3 and 3.4 (and some of the results in Section 3.2) can be reconciled from the energy topography point of view. Most of the previous studies ultimately change the energy offset, ΔE = EMO − EF: the changes in the type of electrode material or in the frontier molecular orbital energy levels of molecules are translated into a change in ΔE without exception. To confirm this hypothesis, we prepared a plot of S values available from the literature as a function of the corresponding ΔE values (Fig. 20). In the plot, filled and empty symbols correspond to the cases of varying EMO and EF energies, respectively. As hypothesized, positive and negative increases in S values are observed as the ΔE values in all the literature data decrease. Interestingly, our data analysis indicates that there are roughly exponential relationships between S and ΔE values for both p- and n-type thermoelectric molecules. These relationships are probably related to the shape of T(E), namely, the Lorentzian-shape.
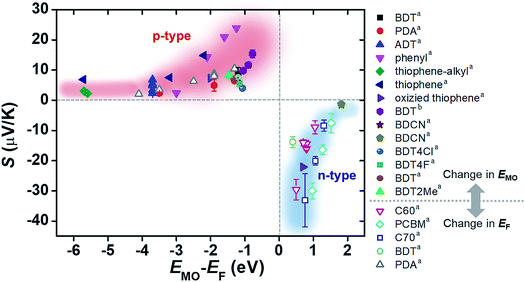 | ||
| Fig. 20 Plot of Seebeck coefficient (S, μV K−1) values of molecular junctions, available in the literature, against energy difference (EMO − EF, eV) between the frontier orbital energy level and electrode Fermi level. Filled and empty symbols correspond to the thermopower resulting from the control of EMO of the molecule, and the thermopower resulting from the control of EF of the electrode, respectively. The values of S, EMO, and EF are taken from the references cited in Tables 3 and 4 (asingle-molecule junction; bsmall-area junction). | ||
3.5. Quantum interference
While quantum interference—the effect arising from passing electron wave functions through the junction multiple times after scattering from remote defects42—has been widely investigated in molecular electronics studies,91–93 little is known about how it affects thermopower. Recently, Miao et al.94 investigated thermoelectric properties of oligo(phenylene ethynylene) derivatives (denoted as OPE) with a meta- or para-substituted central phenyl ring and with dithiolate end groups (Fig. 21a and b). They showed experimental evidence of the quantum interference effect in STM-BJs. No voltage bias was applied to the junction, and the thermo-current (Ith) was recorded to estimate the thermoelectric voltage generated across the junction. The junction incorporating a meta-OPE3 molecule (Fig. 21a) exhibited the destructive π-interference effect, which resulted in a higher thermopower (Fig. 21c; 22.5 ± 1.1 μV K−1) than that of the analogous para form (Fig. 21d; 8.0 ± 0.8 μV K−1). This interference was a consequence of the different phase between the HOMO and LUMO channels, which in turn led to a sharp feature in the transmission curve (Fig. 21e) relative to the conventional Lorentzian transmission (Fig. 21f). Further calculations with the Landauer–Büttiker scattering67 theory of phase-coherent transport through nanostructures yielded thermopower results consistent with the experimental results, supporting the presence of the destructive π-interference effect. The same destructive π-interference effect has also been observed in small-area thermoelectric junctions formed with the ThAFM technique.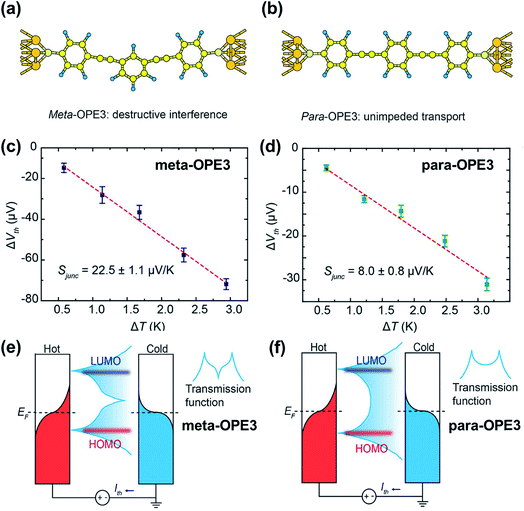 | ||
| Fig. 21 The role of quantum interference in the thermopower of a molecular junction. (a and b) Schematic describing Au/(meta-OPE3)/Au and Au/(para-OPE3)/Au junctions where meta- and para-OPE molecules are the oligo(phenylene ethynylene) with a para- or meta-substituted central phenyl ring and with dithiolate end groups. (c and d) Thermoelectric voltage as a function of ΔT measured in single-molecule junctions containing meta- and para-OPE3 molecules. Red dashed lines are trend lines. (e and f) Schematic describing the change of transmission curve shape that accounts for the increase in thermopower by the destructive π-interference effect. (a–f) Reproduced with permission from ref. 94. Copyright 2018 American Chemical Society. | ||
3.6. Biomolecule (DNA)
Only a few studies have demonstrated thus far thermoelectric biomolecular junctions.65,95–97 Li et al.65 reported the thermopower of double-stranded DNA (dsDNA) molecules in STM-BJs (Fig. 22a). Study of the thermoelectric effect in DNA is important for discovering the detailed mechanism of charge transport through a series of nucleotides. Interestingly, the authors found that varying the length of the oligonucleotide and the sequence of nucleotide bases led to changes in (i) the magnitude and polarity of the change rate of S (corresponding to βS in eqn (5)) in length dependence and (ii) the transport regime, namely, either thermal hopping or quantum tunneling (Fig. 22b). They analyzed the hopping-based thermopower of A(CG)nT sequences (S[A(CG)nT]) with the molecule–electrode contact (Sc) and hopping along the double stranded DNA (dsDNA) sequences (Sh) as follows: | (6) |
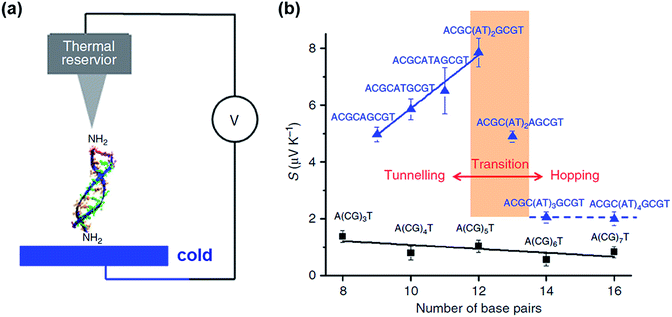 | ||
| Fig. 22 (a) Schematic illustrating the STM-BJ of dsDNA. (b) Seebeck coefficients of DNA with different molecular lengths and sequences. The black squares are the Seebeck coefficients of A(CG)nT (n = 1, 2, 3). The blue triangles are the Seebeck coefficients of ACGC(AT)mGCGT (m = 1, 2, 3, 4) and ACGC(AT)m−1AGCGT (m = 1, 2, 3) sequences. (a and b) Reprinted with permission from ref. 65. Copyright 2016 Springer Nature. | ||
In the case of ACGC(AT)mGCGT and ACGC(AT)m−1AGCGT sequences, the contribution of Rt (tunneling part resistance) to the value of S was significant. The value of Rt exhibited an exponential function over the number of base pairs; and the thermopower of AT (S[AT]) included the contribution by St as follows:
 | (7) |
Inserting a short (AT)n block (n < 5) into the middle of A(CG)nT resulted in a remarkable increase in the Seebeck coefficient in the tunneling regime (blue solid line and data points in Fig. 22b). However, the transition of the transport regime (red line in Fig. 22b) occurred from tunneling to hopping when the AT block was longer than five bases. As a result, the Seebeck coefficient dropped to the level of A(CG)nT and became insensitive to the AT length in the hopping regime (blue dotted line and data points in Fig. 22b).
3.7. Peltier cooling
The Peltier cooling effect, discovered in 1834 by Jean Peltier,98 arises when current flows from an n-type material to a p-type material. In this process, the dominant charge carriers in both materials move away from the junction and take away heat.1,99 Peltier cooling in molecular junctions has been a significant challenge because molecular-level refrigeration was difficult to achieve. Cui et al.66 have recently reported the direct experimental observation of Peltier cooling in the Au/SAM/Au small-area molecular junctions, where the SAM was a monolayer of biphenyl 4,4′-dithiolate (BPDT), terphenyl-4,4′-dithiolate (TPDT) or 4,4′-bipyridine (BP) (Fig. 23a). The authors developed a platform that allowed the measurement of the electrical conductance and Seebeck coefficient in a unified manner while stably maintaining molecular junctions. A SAM was formed on an Au-coated calorimetric microdevice, and an Au-coated AFM tip was used as a top-electrode for junction formation (Fig. 23b and c). The calorimetric microdevice consisted of a Pt thermometer patterned on a SiNx substrate and covered with Al2O3. A temperature differential (ΔT) was created by flowing a current (I) through the microdevice at an external bias (Vp). The total heating and cooling power (Qcal) depended on ΔT and thermal resistance (RS), and was described as . Given that the value of Rs (∼3.3 × 10⁶ kW−1) was constant, ΔT was directly related to Qcal.
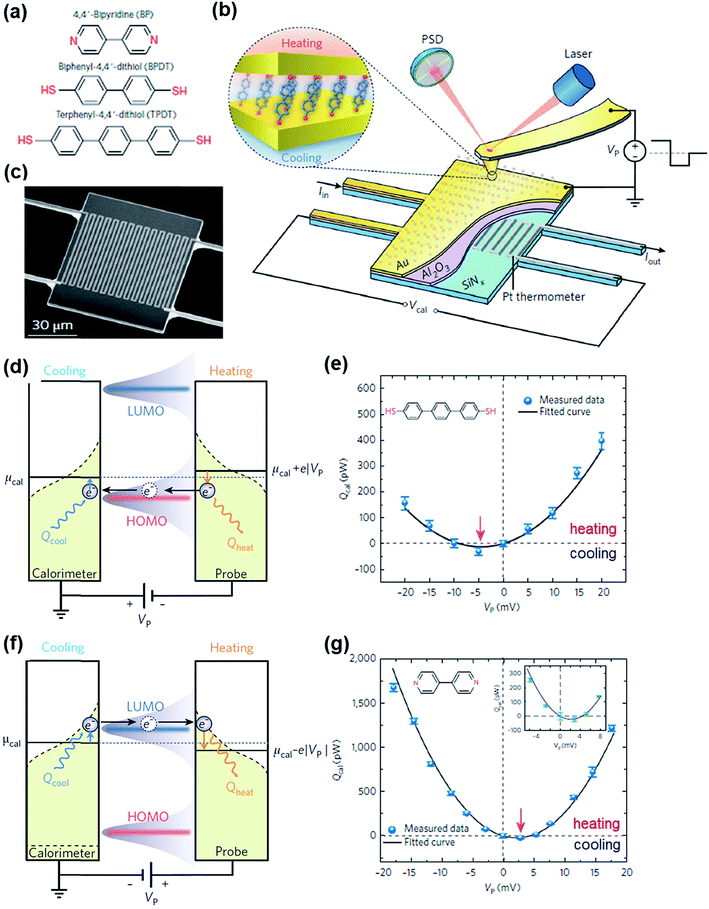 | ||
| Fig. 23 (a) Molecules used to study the Peltier cooling effect in small-area molecular junctions. (b) Schematic illustrating the experimental setup. (c) Scanning electron microscope (SEM) image of the microdevice developed for the study. (d and f) Schematic description of the origin of the Peltier effect in a molecular junction in which transport is dominated by the HOMO or the LUMO. (e and g) The plot of Qcal against Vp for TPDT and BT junctions. The maximum cooling power is obtained when a negative (TPDT junction) or positive (BP junction) bias is applied. (a–g) Reproduced with permission from ref. 66. Copyright 2018 Springer Nature. | ||
The S value in the TPDT junction was 15.7 ± 1.1 μV K−1. A positive S value indicated that the transport was dominated by the HOMO in the TPDT junction (Fig. 23d). The cooling effect in the TPDT was small (Fig. 23e), which was attributed to the low electric conductance in the TPDT. Indeed, the authors observed that the BPDT junction whose conductance was higher than that of the TPDT junction exhibited an enhanced cooling effect. The Peltier cooling in the BDPT and TDPT junctions was achieved when Vp values were negative in sign. By contrast, the BP junction showed a negative S value (−6.9 ± 1.1 μV K−1), indicating that the transport was dominated by the LUMO (Fig. 23f), and the Vp for the Peltier cooling was positive (Fig. 23g). This difference in the sign of Vp was due to the different conduction channels (HOMO vs. LUMO) in the thiol and pyridine derivatives.
3.8. Molecular gating in thermoelectric junctions
Molecular orbital gating has been demonstrated as a means of modulating charge tunneling behaviors in three-terminal single-molecule tunneling devices.100–103 Kim et al.57 have shown that, similarly, molecular orbital gating can be used for controlling the thermopower of a molecule trapped in a single-molecule junction. They formed Au/BPDT/Au and Au/fullerene-C60/Au electromigrated break junctions (EMBJs; Fig. 24a) and enabled electrostatic control over the electrical conductance and Seebeck coefficient of the junctions at different voltages in an Al gate electrode (Fig. 24a). It was revealed that the Seebeck coefficient of the junctions was enhanced via tuning of the gate voltage. For example, upon the application of a gate voltage of −8.0 V, the S value of the BDPT junction increased by a factor of ∼1.2 compared to the S value at zero gate voltage; in fullerene C60, the S value changed by ∼300% when the applied gate voltage was varied from −8.0 V to +8.0 V. These findings indicate that electrostatic control via the gate voltage leads to a change in the proximity of frontier molecular orbital energy levels to the Fermi level of the electrode (ΔE = EMO − EF) in T(E) (Fig. 24b and c). This result was further confirmed using the following modified Lorentzian-shaped transmission function (T(E, VG)):22,67,68 | (8) |
 | (9) |
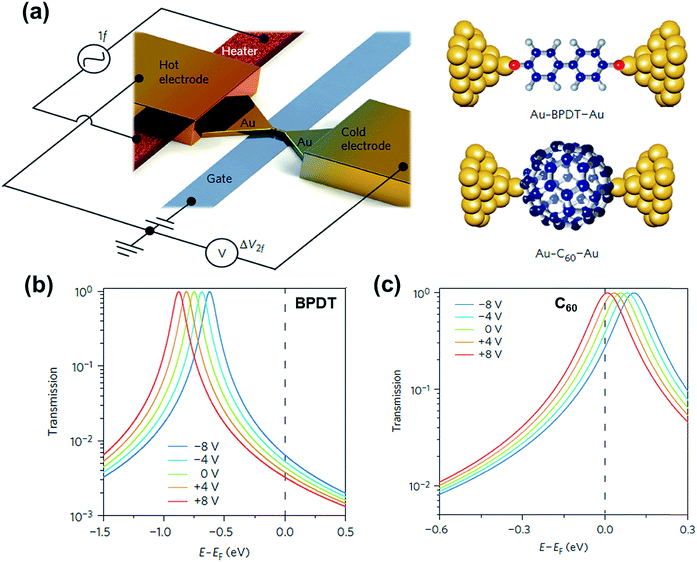 | ||
| Fig. 24 (a) Schematic of the electromigrated break junctions with an integrated heater (left) and the molecular junctions studied in this work (right). A thin Al gate electrode is located beneath the Au nanowire. (b) Transmission curves as a function of five different gate voltage (VG) values using T(E, VG) for the Au–BPDT–Au junction (positive Seebeck coefficient) and (c) Au–C60–Au junction (negative Seebeck coefficient). (a–c) Reproduced with permission from ref. 57. Copyright 2014 Springer Nature. | ||
4. Conclusions and future directions
Molecular thermoelectrics has been studied for the past 25 years, introducing temperature gradients into single-molecule, small-area and large-area junction testbeds. Organic thermoelectrics is rapidly evolving as an environmentally friendly energy harvesting methodology, with promise to overcome limitations of inorganic thermoelectrics. Molecular-scale thermoelectrics studies offer an unprecedented opportunity to obtain information pertaining to atomic-detailed structure–thermopower relationships, which cannot be accessed straightforwardly by conventional organic thermoelectrics studies. They can also help in advancing the understanding of energy topography shapes across molecular junctions. Indeed, in this review article, we have found the usefulness of molecular thermoelectrics in both fundamental and practical aspects. Previous studies of molecular thermoelectrics have explored thermoelectric characteristics in molecular junctions through physical-organic approaches for many cases, and provided experimentally defined direct evidence for validating the shape of the transmission coefficient at least in part.However, it is important to highlight that molecular thermoelectrics still remains relatively unexplored as compared to molecular electronics. This often makes it difficult to establish statistically reliable structure–thermopower relationships that fall within consensus ranges across different types of junction platforms, molecules and electrodes. The length dependence of thermopower is likely the only one that has been well defined by reconciling many datasets obtained from separate studies and different junction platforms. Therefore, we believe that molecular thermoelectrics has plenty of room to be explored. Molecules with a greater variety of chemical structures have to be characterized thermoelectrically in order to obtain sufficient cumulative information on structure–thermopower relationships. Notably, nearly all the molecules incorporated into thermoelectric molecular junctions have relied on the charge transport in a pure tunneling regime. DNA-based thermoelectric single-molecule junctions were the only example to describe the thermopower behavior in the junction functioning in a thermal hopping regime.65 As there are abiotic molecules that facilitate thermal hopping-based charge transport in junctions,105,106 one can further investigate molecular thermopower based on the hopping process. Similar to substrate and testbed scopes, limited electrode materials have been used for thermoelectric junction formation. As we learned from the work by Lee et al.,49 junctions formed with electrodes comprising exotic materials would yield interesting thermopower features that have not been accessed yet.
To measure accurate values of thermopower on a molecular scale, the temperature differential (ΔT) has to be accurately and precisely determined. This is a significant scientific and engineering challenge. Thermoelectric measurements are usually conducted under ambient conditions where heat can be easily dissipated in air and thermal equilibrium in a junction is dynamic. Moreover, the typical temperature differences used to measure the thermopower of molecular junctions are small, and molecular junctions are tiny electric circuits. These make it difficult to measure directly accurate values of ΔT in junctions.
Another challenge in molecular thermoelectrics would be to detect undefined energy states between HOMO and LUMO energies in molecular junctions, metal-induced gap states (MIGSs),79–81 and understand their role in the thermopower performance of molecular junctions. Malen et al.50 proposed that the length dependence of thermopower in n-alkane dithiolate (SCnS; n = 2, 3, 4, 5, 6, 8) single-molecule junctions is probably due to the dependence of the shape of MIGSs' energy barrier on the n-alkane chain length. While MIGSs are the known energy states in the interface of metals with semiconductors in general, the MIGSs in thiolate–metal are relatively undefined. Other studies have suggested that the MIGSs result from orbital mixing of sulfur and gold atoms at the interface with a small amount of n-alkane chain, and the length dependence of thermopower in n-alkanethiolate is valid only for short molecules.79,107,108 Further experimental study is needed to establish the role and presence of MIGSs in n-alkanethiolate (and other) junctions.
The results of molecular thermoelectrics can be reconciled with the performance of practical organic thermoelectric devices. Recent studies in molecular electronics are good examples. Among others, Lambert's,109 Venkataraman's110 and Chiechi's111 research teams have investigated the length dependence of tunneling currents in molecular junctions of oligo(porphyrin), oligo(diketopyroolopyrrole) and oligothiophenes, respectively. These research teams have revealed that the rates of charge tunneling across these molecules do not obey the simplified Simmons model: i.e., their separate studies exhibited that the tunneling probability increases or remains constant with increasing length. Given that these molecules resemble key building blocks of many organic materials that exhibit high optoelectronic performance, their findings are particularly insightful for understanding the reasons for efficient energy conversion of optoelectronic devices incorporating organic materials based on their derivatives. Similarly, the study of molecular thermoelectrics can help to understand the underlying mechanisms behind many organic thermoelectric performances.
One can image the use of molecules or monolayers as active components for realizing tiny thermoelectric devices. To this end, significant attention should be paid to the three following challenges, among others. (i) As shown in this review article, most of the studies in the field of molecular thermoelectrics were fundamental in nature and focused on measurements of the Seebeck coefficient. To achieve practical molecular-scale thermoelectric devices, further studies are needed to develop reliable methods to measure practical values such as the power factor and figure of merit that provide a measure of the true thermoelectric conversion efficiency. (ii) At the same time, the minimum values required for practical uses should be accomplished. Note that the Seebeck coefficient values of molecular junctions range from ∼−40 to ∼30 μV K−1 (see Fig. 20). If one can enhance the value of the Seebeck coefficient significantly, it will also help in advancing the development of molecular-scale thermoelectric devices. (iii) Molecular junctions are based on delicate organic components in general. Therefore, a high-yielding and non-invasive device fabrication technique is necessary, and long-term stability of device performance should be guaranteed for the use of molecular thermoelectric junctions in applications.
Conflicts of interest
There are no conflicts to declare.Acknowledgements
This work is supported by National Research Foundation of Korea grants funded by the Ministry of Science and ICT (NRF-2017M3A7B8064518 and NRF-2019R1A2C2011003).References
- F. J. Disalvo, Science, 1999, 285, 703–706 CrossRef CAS PubMed
.
- N. Nakpathomkun, H. Q. Xu and H. Linke, Phys. Rev. B: Condens. Matter Mater. Phys., 2010, 82, 235428 CrossRef
.
- K. Yazawa and A. Shakouri, J. Appl. Phys., 2012, 111, 024509 CrossRef
.
- R. P. C. a. R. Stratton, J. Electron. Control, 1959, 7, 52–72 CrossRef
.
- Y. Sun, P. Sheng, C. Di, F. Jiao, W. Xu, D. Qiu and D. Zhu, Adv. Mater., 2012, 24, 932–937 CrossRef CAS PubMed
.
- Q. Zhang, Y. Sun, W. Xu and D. Zhu, Adv. Mater., 2014, 26, 6829–6851 CrossRef CAS PubMed
.
- A. G. B. Russ, J. J. Urban, M. L. Chabinyc and R. A. Segalman, Nat. Rev. Mater., 2016, 1, 16050 CrossRef
.
- O. Bubnova, Z. U. Khan, A. Malti, S. Braun, M. Fahlman, M. Berggren and X. Crispin, Nat. Mater., 2011, 10, 429–433 CrossRef CAS PubMed
.
- G. H. Kim, L. Shao, K. Zhang and K. P. Pipe, Nat. Mater., 2013, 12, 719–723 CrossRef CAS PubMed
.
- D. Huang, H. Yao, Y. Cui, Y. Zou, F. Zhang, C. Wang, H. Shen, W. Jin, J. Zhu, Y. Diao, W. Xu, C. Di and D. Zhu, J. Am. Chem. Soc., 2017, 139, 13013–13023 CrossRef CAS PubMed
.
- G. M. Whitesides, Annu. Rev. Anal. Chem., 2013, 6, 1–29 CrossRef CAS PubMed
.
- G. M. Whitesides, Isr. J. Chem., 2016, 56, 66–82 CrossRef CAS
.
- H. J. Yoon, N. D. Shapiro, K. M. Park, M. M. Thuo, S. Soh and G. M. Whitesides, Angew. Chem., Int. Ed., 2012, 51, 4658–4661 CrossRef CAS PubMed
.
- J. A. Malen, S. K. Yee, A. Majumdar and R. A. Segalman, Chem. Phys. Lett., 2010, 491, 109–122 CrossRef CAS
.
- C. A. Perroni, D. Ninno and V. Cataudella, J. Phys.: Condens. Matter, 2016, 28, 373001 CrossRef CAS PubMed
.
- L. Cui, R. Miao, C. Jiang, E. Meyhofer and P. Reddy, J. Chem. Phys., 2017, 146, 092201 CrossRef
.
- L. Rincón-García, C. Evangeli, G. Rubio-Bollinger and N. Agraït, Chem. Soc. Rev., 2016, 45, 4285–4306 RSC
.
- A. Aiba, M. Iwane, S. Fujii and M. Kiguchi, ChemElectroChem, 2018, 5, 2508–2517 CrossRef CAS
.
- C. C. Williams and H. K. Wickramasinghe, Nature, 1990, 344, 317–319 CrossRef CAS
.
- J. C. Poler, R. M. Zimmermann and E. C. Cox, Langmuir, 1995, 11, 2689–2695 CrossRef CAS
.
- B. Ludoph and J. M. v. Ruitenbeek, Phys. Rev. B: Condens. Matter Mater. Phys., 1999, 59, 12290 CrossRef CAS
.
- M. Paulsson and S. Datta, Phys. Rev. B: Condens. Matter Mater. Phys., 2003, 67, 241403 CrossRef
.
- P. Reddy, S.-Y. Jang, R. A. Segalman and A. Majumdar, Science, 2007, 315, 1568–1571 CrossRef CAS PubMed
.
- K. Baheti, J. A. Malen, P. Doak, P. Reddy, S.-Y. Jang, T. D. Tilley, A. Majumdar and R. A. Segalman, Nano Lett., 2008, 8, 715–719 CrossRef CAS PubMed
.
- J. A. Malen, P. Doak, K. Baheti, T. D. Tilley, A. Majumdar and R. A. Segalman, Nano Lett., 2009, 9, 3406–3412 CrossRef CAS PubMed
.
- H. Basch, R. Cohen and M. A. Ratner, Nano Lett., 2005, 5, 1668–1675 CrossRef CAS PubMed
.
- S. Y. Quek, L. Venkataraman, H. J. Choi, S. G. Louie, M. S. Hybertsen and J. Neaton, Nano Lett., 2007, 7, 3477–3482 CrossRef CAS PubMed
.
- F. C. Simeone, H. J. Yoon, M. M. Thuo, J. R. Barber, B. Smith and G. M. Whitesides, J. Am. Chem. Soc., 2013, 135, 18131–18144 CrossRef CAS PubMed
.
- H. J. Yoon, C. M. Bowers, M. Baghbanzadeh and G. M. Whitesides, J. Am. Chem. Soc., 2013, 136, 16–19 CrossRef PubMed
.
- N. Tao, Science, 2006, 301, 1221–1223 Search PubMed
.
- L. Venkataraman, J. E. Klare, I. W. Tam, C. Nuckolls, M. S. Hybertsen and M. L. Steigerwald, Nano Lett., 2006, 6, 458–462 CrossRef CAS PubMed
.
- J. Ulrich, D. Esrail, W. Pontius, L. Venkataraman, D. Millar and L. H. Doerrer, J. Phys. Chem. B, 2006, 110, 2462–2466 CrossRef CAS PubMed
.
- A. Harzheim, Mater. Sci. Technol., 2018, 34, 1275–1286 CrossRef CAS
.
- S. Kaneko, Y. Nakamura, R. Matsushita, S. Marqués-González and M. Kiguchi, Appl. Phys. Express, 2015, 8, 065201 CrossRef
.
- T. Morikawa, A. Arima, M. Tsutsui and M. Taniguchi, Nanoscale, 2014, 6, 8235–8241 RSC
.
- M. Tsutsui, T. Morikawa, Y. He, A. Arima and M. Taniguchi, Sci. Rep., 2015, 5, 11519 CrossRef CAS PubMed
.
- J. R. Widawsky, P. Darancet, J. B. Neaton and L. Venkataraman, Nano Lett., 2011, 12, 354–358 CrossRef PubMed
.
- S. K. Yee, J. A. Malen, A. Majumdar and R. A. Segalman, Nano Lett., 2011, 11, 4089–4094 CrossRef CAS PubMed
.
- A. Tan, J. Balachandran, S. Sadat, V. Gavini, B. D. Dunietz, S.-Y. Jang and P. Reddy, J. Am. Chem. Soc., 2011, 133, 8838–8841 CrossRef CAS PubMed
.
- A. Tan, J. Balachandran, B. D. Dunietz, S.-Y. Jang, V. Gavini and P. Reddy, Appl. Phys. Lett., 2012, 101, 243107 CrossRef
.
- S. Park and H. J. Yoon, Nano Lett., 2018, 18, 7715–7718 CrossRef CAS PubMed
.
- A. Aiba, F. Demir, S. Kaneko, S. Fujii, T. Nishino, K. Tsukagoshi, A. Saffarzadeh, G. Kirczenow and M. Kiguchi, Sci. Rep., 2017, 7, 7949 CrossRef PubMed
.
- M. Tsutsui, T. Morikawa, A. Arima and M. Taniguchi, Sci. Rep., 2013, 3, 3326 CrossRef PubMed
.
- A. Umeno and K. Hirakawa, Appl. Phys. Lett., 2009, 94, 162103 CrossRef
.
- C. Durkan, M. Schneider and M. Welland, J. Appl. Phys., 1999, 86, 1280–1286 CrossRef CAS
.
- A. R. Champagne, A. N. Pasupathy and D. C. Ralph, Nano Lett., 2005, 5, 305–308 CrossRef CAS PubMed
.
- S. Guo, G. Zhou and N. Tao, Nano Lett., 2013, 13, 4326–4332 CrossRef CAS PubMed
.
- Y. Komoto, Y. Isshiki, S. Fujii, T. Nishino and M. Kiguchi, Chem.–Asian J., 2017, 12, 440–445 CrossRef CAS PubMed
.
- S. K. Lee, T. Ohto, R. Yamada and H. Tada, Nano Lett., 2014, 14, 5276–5280 CrossRef CAS PubMed
.
- J. A. Malen, P. Doak, K. Baheti, T. D. Tilley, R. A. Segalman and A. Majumdar, Nano Lett., 2009, 9, 1164–1169 CrossRef CAS PubMed
.
- J. R. Widawsky, W. Chen, H. Vazquez, T. Kim, R. Breslow, M. S. Hybertsen and L. Venkataraman, Nano Lett., 2013, 13, 2889–2894 CrossRef CAS PubMed
.
- C. Evangeli, K. Gillemot, E. Leary, M. T. Gonzalez, G. Rubio-Bollinger, C. J. Lambert and N. s. Agraït, Nano Lett., 2013, 13, 2141–2145 CrossRef CAS PubMed
.
- L. Rincón-García, A. K. Ismael, C. Evangeli, I. Grace, G. Rubio-Bollinger, K. Porfyrakis, N. Agraït and C. J. Lambert, Nat. Mater., 2016, 15, 289–293 CrossRef PubMed
.
- A. Tan, S. Sadat and P. Reddy, Appl. Phys. Lett., 2010, 96, 013110 CrossRef
.
- L. Cademartiri, M. M. Thuo, C. A. Nijhuis, W. F. Reus, S. Tricard, J. R. Barber, R. N. Sodhi, P. Brodersen, C. Kim and R. C. Chiechi, J. Phys. Chem. C, 2012, 116, 10848–10860 CrossRef CAS
.
- R. C. Chiechi, E. A. Weiss, M. D. Dickey and G. M. Whitesides, Angew. Chem., Int. Ed., 2008, 47, 142–144 CrossRef CAS PubMed
.
- Y. Kim, W. Jeong, K. Kim, W. Lee and P. Reddy, Nat. Nanotechnol., 2014, 9, 881–885 CrossRef CAS PubMed
.
- A. Bratkovsky and P. Kornilovitch, Phys. Rev. B: Condens. Matter Mater. Phys., 2003, 67, 115307 CrossRef
.
- A. Torres, R. B. Pontes, A. J. da Silva and A. Fazzio, Phys. Chem. Chem. Phys., 2015, 17, 5386–5392 RSC
.
- W. F. Reus, C. A. Nijhuis, J. R. Barber, M. M. Thuo, S. Tricard and G. M. Whitesides, J. Phys. Chem. C, 2012, 116, 6714–6733 CrossRef CAS
.
- D. Kim, P. S. Yoo and T. Kim, J. Korean Phys. Soc., 2015, 66, 602–606 CrossRef CAS
.
- W. B. Chang, C.-K. Mai, M. Kotiuga, J. B. Neaton, G. C. Bazan and R. A. Segalman, Chem. Mater., 2014, 26, 7229–7235 CrossRef CAS
.
- E. J. Dell, B. Capozzi, J. Xia, L. Venkataraman and L. M. Campos, Nat. Chem., 2015, 7, 209–214 CrossRef CAS PubMed
.
- S. K. Lee, M. Buerkle, R. Yamada, Y. Asai and H. Tada, Nanoscale, 2015, 7, 20497–20502 RSC
.
- Y. Li, L. Xiang, J. L. Palma, Y. Asai and N. Tao, Nat. Commun., 2016, 7, 11294 CrossRef CAS PubMed
.
- L. Cui, R. Miao, K. Wang, D. Thompson, L. A. Zotti, J. C. Cuevas, E. Meyhofer and P. Reddy, Nat. Nanotechnol., 2018, 13, 122–127 CrossRef CAS PubMed
.
-
S. Elke and C. J. Carlos, Molecular electronics: an introduction to theory and experiment, World Scientific, 2017 Search PubMed
.
- A. Nitzan and M. A. Ratner, Science, 2003, 300, 1384–1389 CrossRef CAS PubMed
.
- S. Y. Quek, H. J. Choi, S. G. Louie and J. B. Neaton, ACS Nano, 2010, 5, 551–557 CrossRef PubMed
.
- A. Vilan, D. Aswal and D. Cahen, Chem. Rev., 2017, 117, 4248–4286 CrossRef CAS PubMed
.
- K. C. Liao, H. J. Yoon, C. M. Bowers, F. C. Simeone and G. M. Whitesides, Angew. Chem., Int. Ed., 2014, 53, 3889–3893 CrossRef CAS PubMed
.
- C. M. Bowers, D. Rappoport, M. Baghbanzadeh, F. C. Simeone, K.-C. Liao, S. N. Semenov, T. Żaba, P. Cyganik, A. Aspuru-Guzik and G. M. Whitesides, J. Phys. Chem. C, 2016, 120, 11331–11337 CrossRef CAS
.
- L. Jiang, C. S. Sangeeth, A. Wan, A. Vilan and C. A. Nijhuis, J. Phys. Chem. C, 2015, 119, 960–969 CrossRef CAS
.
- J. Jin, G. D. Kong and H. J. Yoon, J. Phys. Chem. Lett., 2018, 9, 4578–4583 CrossRef CAS PubMed
.
- Z. Xie, I. Bâldea and C. D. Frisbie, Chem. Sci., 2018, 9, 4456–4467 RSC
.
- W. Wang, T. Lee and M. A. Reed, Phys. Rev. B: Condens. Matter Mater. Phys., 2003, 68, 035416 CrossRef
.
- Y. Qi, I. Ratera, J. Y. Park, P. D. Ashby, S. Y. Quek, J. Neaton and M. Salmeron, Langmuir, 2008, 24, 2219–2223 CrossRef CAS PubMed
.
- Ž. Crljen, A. Grigoriev, G. Wendin and K. Stokbro, Phys. Rev. B: Condens. Matter Mater. Phys., 2005, 71, 165316 CrossRef
.
- C.-C. Kaun and H. Guo, Nano Lett., 2003, 3, 1521–1525 CrossRef CAS
.
- Y. Zhou, F. Jiang, H. Chen, R. Note, H. Mizuseki and Y. Kawazoe, J. Chem. Phys., 2008, 128, 044704 CrossRef CAS PubMed
.
- C. Zeng, B. Li, B. Wang, H. Wang, K. Wang, J. Yang, J. Hou and Q. Zhu, J. Chem. Phys., 2002, 117, 851–856 CrossRef CAS
.
- Y. Xue and M. A. Ratner, Phys. Rev. B: Condens. Matter Mater. Phys., 2004, 70, 205416 CrossRef
.
- S. Kang, S. Park, H. Kang, S. J. Cho, H. Song and H. J. Yoon, Chem. Commun., 2019 10.1039/c9cc01585j
.
- G. D. Kong and H. J. Yoon, J. Electrochem. Soc., 2016, 163, 115–121 CrossRef
.
- E. A. Doud, M. S. Inkpen, G. Lovat, E. Montes, D. W. Paley, M. L. Steigerwald, H. Vázquez, L. Venkataraman and X. Roy, J. Am. Chem. Soc., 2018, 140, 8944–8949 CrossRef CAS PubMed
.
- Y. Li, J. Huang, R. T. McIver and J. C. Hemminger, J. Am. Chem. Soc., 1992, 114, 2428–2432 CrossRef CAS
.
- C. M. Crudden, J. H. Horton, I. I. Ebralidze, O. V. Zenkina, A. B. McLean, B. Drevniok, Z. She, H.-B. Kraatz, N. J. Mosey, T. Seki, E. C. Keske, J. D. Leake, A. Rousina-Webb and G. Wu, Nat. Chem., 2014, 6, 409–414 CrossRef CAS PubMed
.
- R. Koeppe and N. Sariciftci, Photochem. Photobiol. Sci., 2006, 5, 1122–1131 RSC
.
- G. D. Han, W. R. Collins, T. L. Andrew, V. Bulović and T. M. Swager, Adv. Funct. Mater., 2013, 23, 3061–3069 CrossRef CAS
.
- S. Arabnejad, A. Pal, K. Yamashita and S. Manzhos, Frontiers in Energy Research, 2019, 7, 3 CrossRef
.
- C. M. Guédon, H. Valkenier, T. Markussen, K. S. Thygesen, J. C. Hummelen and S. J. Van Der Molen, Nat. Nanotechnol., 2012, 7, 305–309 CrossRef PubMed
.
- S. Ballmann, R. Härtle, P. B. Coto, M. Elbing, M. Mayor, M. R. Bryce, M. Thoss and H. B. Weber, Phys. Rev. Lett., 2012, 109, 056801 CrossRef PubMed
.
- S.-H. Ke, W. Yang and H. U. Baranger, Nano Lett., 2008, 8, 3257–3261 CrossRef CAS PubMed
.
- R. Miao, H. Xu, M. Skripnik, L. Cui, K. Wang, K. G. Pedersen, M. Leijnse, F. Pauly, K. Warnmark and E. Meyhofer, Nano Lett., 2018, 18, 5666–5672 CrossRef CAS
.
- E. Maciá, Rev. Adv. Mater. Sci., 2005, 10, 166–170 Search PubMed
.
- E. Maciá, Phys. Rev. B: Condens. Matter Mater. Phys., 2007, 75, 035130 CrossRef
.
- G. G. Nestorova and E. J. Guilbeau, Lab Chip, 2011, 11, 1761–1769 RSC
.
- J.-C. Peltier, Ann. Chim. Phys., 1834, 56, 371–386 Search PubMed
.
- K. L. Grosse, M.-H. Bae, F. Lian, E. Pop and W. P. King, Nat. Nanotechnol., 2011, 6, 287–290 CrossRef CAS PubMed
.
- H. Song, Y. Kim, Y. H. Jang, H. Jeong, M. A. Reed and T. Lee, Nature, 2009, 462, 1039–1043 CrossRef CAS PubMed
.
- W. Liang, M. P. Shores, M. Bockrath, J. R. Long and H. Park, Nature, 2002, 417, 725–729 CrossRef CAS PubMed
.
- J. Park, A. N. Pasupathy, J. I. Goldsmith, C. Chang, Y. Yaish, J. R. Petta, M. Rinkoski, J. P. Sethna, H. D. Abruña and P. L. McEuen, Nature, 2002, 417, 722–725 CrossRef CAS PubMed
.
- H. Song, M. A. Reed and T. Lee, Adv. Mater., 2011, 23, 1583–1608 CrossRef CAS PubMed
.
- S.-H. Ke, W. Yang, S. Curtarolo and H. U. Baranger, Nano Lett., 2009, 9, 1011–1014 CrossRef CAS PubMed
.
- C. A. Nijhuis, W. F. Reus and G. M. Whitesides, J. Am. Chem. Soc., 2010, 132, 18386–18401 CrossRef CAS PubMed
.
- C. A. Nijhuis, W. F. Reus, J. R. Barber, M. D. Dickey and G. M. Whitesides, Nano Lett., 2010, 10, 3611–3619 CrossRef CAS PubMed
.
- C. Zeng, B. Li, B. Wang, H. Wang, K. Wang, J. Yang, J. G. Hou and Q. Zhu, J. Chem. Phys., 2002, 117, 851–856 CrossRef CAS
.
- Y. X. Zhou, F. Jiang, H. Chen, R. Note, H. Mizuseki and Y. Kawazoe, J. Chem. Phys., 2008, 128, 044704 CrossRef CAS PubMed
.
- N. Algethami, H. Sadeghi, S. Sangtarash and C. J. Lambert, Nano Lett., 2018, 18, 4482–4486 CrossRef CAS PubMed
.
- Y. Zang, S. Ray, E.-D. Fung, A. Borges, M. H. Garner, M. L. Steigerwald, G. C. Solomon, S. Patil and L. Venkataraman, J. Am. Chem. Soc., 2018, 140, 13167–13170 CrossRef CAS PubMed
.
- Y. Zhang, S. Soni, T. L. Krijger, P. Gordiichuk, X. Qiu, G. Ye, H. T. Jonkman, A. Herrmann, K. Zojer, E. Zojer and R. C. Chiechi, J. Am. Chem. Soc., 2018, 140, 15048–15055 CrossRef CAS PubMed
.
Footnote |
| † These authors contributed equally to this work. |
| This journal is © The Royal Society of Chemistry 2019 |


