 Open Access Article
Detectability and discrimination of biomarker organic precursors in a low pressure CO2 atmosphere by LIBS
T.
Delgado
 ,
L.
García-Gómez
,
L. M.
Cabalín
,
L.
García-Gómez
,
L. M.
Cabalín
 and
J. J.
Laserna
 *
*
Departamento de Química Analítica, Universidad de Málaga, Campus de Teatinos s/n, 29071 Málaga, Spain. E-mail: laserna@uma.es; Web: http://laser.uma.es
First published on 29th May 2020
Abstract
In view of the new challenges that can arise in the next interplanetary missions, studies aimed at shedding light on the interpretation of acquired analytical signals are of high priority in planetary science. Among the suite of techniques used in this field, LIBS has gained ample acceptance after its successful demonstration in the Mars Science Laboratory rover. As a consequence, several planned missions to Mars integrate this technology due to its capability for the quantitative analysis of rocks, minerals, and soils. While LIBS is primarily an atomic spectroscopy tool, recent research has demonstrated that significant information concerning organic radicals in the plasma can be useful for identification of molecular solids such as polycyclic aromatic hydrocarbons. This work explores this application by studying atomic and molecular species generated in reactions within the plasma plume in a low pressure CO2 atmosphere of selected organic compounds of interest as possible chemical biosignatures – adenine, glycine, pyrene and urea. The study also involves mixtures of variable composition of the organic compounds with carbonate salts, a material that has been detected in the surroundings of the landing site of the Perseverance rover of the upcoming Mars 2020 mission. Important routes for the formation of C2 and CN radicals such as aromatic ring fragmentation and displacement reactions in the CO2 atmosphere are identified using correlation analysis of the signals associated with the several emitting species detected in the plasma. The notion that LIBS can complement organic analysis techniques is further developed with successful data for differentiation between the organic compounds, with limits of detection from 3 wt% to 14 wt% in the carbonate matrix.
1. Introduction
The use of laser-induced breakdown spectroscopy (LIBS) in conducting satisfactory qualitative analysis of a variety of organic materials has been demonstrated in the last few years.1,2 The application of LIBS in polymer sorting,3–5 identification of explosive residues6–8 or examination of biological materials9–11 has shown excellent and promising results. Nowadays, LIBS has gone a step further in the scope of molecular solids and its application in astrobiology research has become an effective tool in planetary exploration for the detection of the possible presence of organic extra-terrestrial materials. The advantages of LIBS are particularly interesting when it is applied in this scientific endeavour.12,13 Thus, the integration of LIBS instruments in space missions for planetary surface analysis has been a reality for some years now.14–21 One of the main objectives of these investigations lies in the detection of possible chemical biosignatures, as well as in the recognition and discrimination by LIBS of organic compounds,22 a task that may become rather complex since it is a technique that is very sensitive to environmental conditions.23–28 However, regardless of the verified potential of LIBS in dealing with these diagnoses by obtaining multi-elemental information, more needs to be known about the nature of plasmas from laser ablation of molecular solids, especially the transfer mechanisms of matter and energy from the solid towards the plasma and the constant interference of the surrounding atmosphere. Consequently, determining a specific emission pattern for identifying a molecular solid is a very difficult practice due to the mentioned impact of chemical reactions with atmospheric components. In the particular case of the Martian atmosphere, its composition (rich in CO2 gas (96%)) and ambient pressure (7–9 mb) lead to high signal intensities in comparison to the Earth's atmospheric pressure or higher and to a vacuum.29 However, only a few studies have focused on plasma formation under simulated Martian atmospheric conditions and its influence on LIBS emission from laser ablation of molecular solids.22,30 Regarding plasma chemistry under such ablation conditions, in the case of samples containing no carbon, LIBS signals corresponding to this element will derive exclusively from the surrounding gas. This factor can be used to investigate the Martian atmospheric rupture as well as its influence on the final plasma emission. However, if a carbon containing substrate is analyzed by LIBS, the existence of two carbon sources will contribute to the emission signal at different levels. Lastly, in the case of an inorganic phase mixed with a certain organic matter, a third carbon source could be involved in the mechanisms of ablation and generation pathways of emitting species, thus turning the plasma chemistry into a more complex system in which participating carbon species will arise from different sources under these conditions. Oxygen, on the other hand, is present in most of the mineral phases existing on Mars, e.g. in silicates, sulfates or carbonates. Hence, oxygen spectral emissions could be due to both the inner oxygen in the sample and a contribution from the breakup of the atmosphere.23 In this context, the present work has sought to evaluate the effect of rupture of a CO2 low-pressure atmosphere in laser-induced plasma formation by sample ablation of an inorganic matrix doped with selected organic compounds.On the other hand, through the survey of the spectral responses of organic molecules and the application of adapted chemometric methods, the interrelation between principal emission signals has been analyzed, and therefore, the possibilities of identification and sorting of some molecular compounds have been studied. In this case, the application of Discriminant Function Analysis (DFA) besides the calculation of Pearson coefficients was used as chemometric tools for data analysis, in order to both try to discern the selected organic dopants analyzed in a CO2 atmosphere and evaluate the relationship existing between the atomic/molecular emitting species appearing in LIBS spectra, respectively. Thus, the achieved results have been used to clarify the preferential routes of emitting species formation under experimental conditions. Thus, the plausible origin routes are proposed and discussed and the limits of detection (LODs) of these main emission species for each organic compound were established.
2. Materials and methods
2.1 LIBS instrumentation
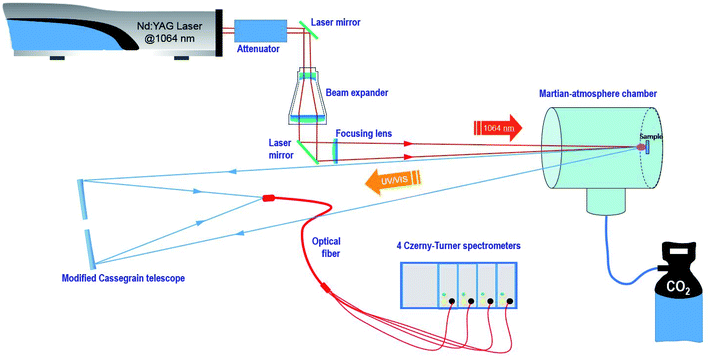
A remote LIBS system using a Q-switched Nd-YAG laser (1064 nm, 9 mm beam diameter, 20 Hz repetition rate and pulse width 5 ns) in coaxial configuration was used for the present study. The configuration is depicted in Fig. 1. Measurements were carried out with two different fluence regimes, 14.5 J cm−2 and 72.4 J cm−2 on the sample, and a repetition rate of 3 Hz. The spot diameter measured for the sample using a single laser shot was around 350 μm.The laser beam was guided by means of a laser line mirror for IR irradiation and then expanded using a 5× beam expander composed of several 1064 nm antireflection-coated fused silica lenses. Afterward, the expanded beam was re-collimated using a 45° dichroic mirror (R > 99.5% @ 1064 nm) to finally be focused using a BK7 800 mm focal length plane-convex lens and through a quartz window on the target surface situated in a stainless steel vacuum chamber. This homemade chamber of about 10 liter capacity was filled either with CO2 or with air at a pressure of 7 mb (700 Pa) at room temperature.
Pellet samples were individually attached to a homemade holder actuated by a rotary motor with a variable angular velocity that allowed both manual and automatic turning of the sample, thus varying the sampling position.
The plasma emission was collinearly collected using a modified Maksutov–Cassegrain telescope (F 1900 mm, FL/15, D 127 mm) that was guided to the entrance slit of a Czerny–Turner multi-channel spectrometer (four linear CCD 2048 pixels, total spectral region 237 to 975 nm) through a quadrifurcated UV-fiber optic cable of 600 μm diameter and 2 m length. Detector setting parameters were set at the minimum values allowed by the instrument, namely, 1.1 ms as the integration time and an integration delay of 1.28 μs from the laser event. For every measurement, 3 sampling positions were analyzed per data set with 25 sequential laser shots, thus averaging a total of 75 spectra.
2.2. Samples
Calcium carbonate either pure or mixed with organic compounds was analyzed in pellet form. CaCO3 was selected since it has been detected on Mars in different mineral phases,31 namely aragonite, calcite and dolomite, among others, so it could constitute an interesting surrogate to gain information of interest for the upcoming Martian missions. The organic compounds chosen for the study included adenine, glycine, pyrene and urea because of their variable functional groups, heteroatoms, presence of cycles, etc. This structural variability helps in the interpretation of the LIBS spectral emission response, thus resulting in a better understanding of their behavior in the CO2 atmosphere. These compounds also arouse interest as they could be related to biogenic processes.32 Adenine is a nitrogenous base which is part of nucleic acid chains and so it may be present in bacteria. Meanwhile, glycine is a simple and compact amino acid forming proteins in living beings, and urea has an important role in the metabolism of nitrogen-containing compounds, constituting a product of the degradation of amino acids. On the other hand, pyrene is not an indicator or a precursor of life. However, this compound offers important information on fragmentation pathways and recombination processes occurring between atomic carbon and the different species present in the atmosphere.Materials were crushed with an agate mortar and then were mixed and homogenized in increasing concentrations of organic dopants. Powders were prepared in pellet form for analysis by compacting 0.5 g of the mixture in a manual hydraulic press at 1.5 T cm−2 for 3 minutes, without any other additional preparation. All pellets exhibited a homogeneous appearance and a common size of 3 mm width and 11 mm diameter.
3. Results and discussion
3.1. Influence of organic dopant concentration on the emission response and LOD calculation
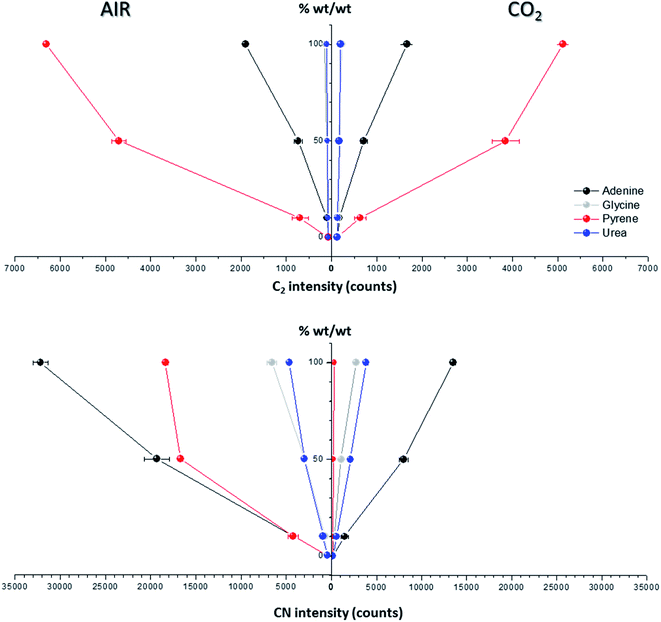
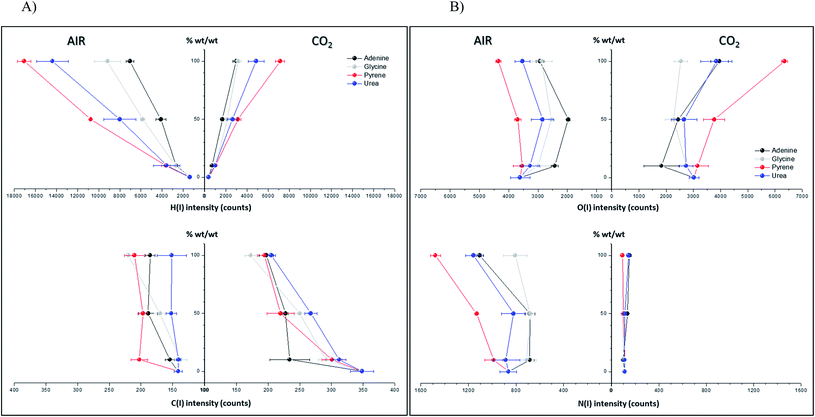
Spectral peak intensities with background subtraction of the main emission signals registered in the LIBS spectra, both from atomic species (C, H, N and O) and from molecules (CN and C2), were taken as variables for data analysis. Measurements were carried out using two different atmospheric conditions (CO2 and air), both at a pressure of 7 mb and at a laser fluence of 72.4 J cm−2.The dependence of emission intensity on dopant concentration for the molecular bands of C2 at 473.7 nm and CN at 388.3 nm, as well as for the atomic lines, namely C(I) 247.8 nm, H(I) 656.3 nm, O(I) 777.4 nm and N(I) 746.8 nm, is shown in Fig. 2 and 3, respectively. Error bars were calculated by averaging signal intensities from three measurements of 25 laser pulses per sampling position. As shown, a positive linear correlation exists between molecular emission intensity and dopant concentration in both the tested atmospheres for all studied cases except for pyrene. In this case, saturation of the curve is observed for CN and C2 (see Fig. 2). As for atomic signals (Fig. 3A), the H(I) emission intensity also exhibits a linear fit with dopant concentration in all measured cases. However, the emission intensity of C(I) is found to deviate from that observed for other species. In air, the carbon intensity does not increase with the increase in organic concentration, whereas in CO2 an inverse relationship is observed. This fact could be attributed to the formation of non-emitting species by secondary reactions in the plasma plume in which carbon is involved. Fig. 4 shows detailed data of the carbon atomic line at 247.8 nm acquired in both atmospheres in which the evolution of the emission signal with variation of the percentage of pyrene is clearly seen. As observed, peak intensities were very low for this emission line, but reproducible signals were recorded. In air, similar intensities were found for both pure pyrene and for a mixture of 50 wt% CaCO3/pyrene samples. On the other hand, in the case of the CO2 atmosphere, the carbon intensity dropped to nearly 60% when an inorganic matrix was doped with 50% organic material, thus evidencing the above cited effect.
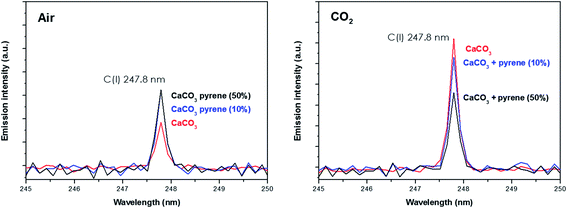 | ||
| Fig. 4 Emission intensity of the atomic carbon signal from both the pure CaCO3 matrix and that doped with 10% pyrene in both air and the CO2 atmosphere. | ||
For the O(I) and N(I) lines, different patterns were observed in both atmospheres depending on the organic compound as shown in Fig. 3B. It is remarkable how the N(I) intensity in air as well as the O(I) intensity in the CO2 atmosphere are enhanced when pyrene is present in the matrix. An in-depth discussion of these particular trends will be presented in the following section.
The limits of detection (LODs) of different emitting species were calculated in both atmospheres following the IUPAC criteria, based on the standard deviation of the blank response (σ) and the slope of the calibration curve (s), following the expression LOD = 3.3σ/s. Measurements were carried out at two different fluence regimes, 14.5 J cm−2 and 72.4 J cm−2.
LOD values found for the four studied dopants are listed in Table 1. Samples of pure CaCO3 with a variable amount of organic material, namely 2.5 wt%, 5 wt%, 7.5 wt% and 10 wt%, were prepared and analyzed. The CN, C2 and H(I) emission signals seem to be in agreement with the results discussed above. As observed, the LODs are independent of atmospheric conditions with values ranging from 11 wt% for the C2 signal of adenine in CO2 to 1 wt% for the CN signal for the same dopant and the same atmosphere, with 72.4 J cm−2 as the fluence regime. As expected, the detection power drops considerably as the fluence decreases. Hence, the LOD value for the C2 signal of adenine in the CO2 atmosphere, not measurable when using the 14.5 J cm−2 fluence regime, is 11 wt% at 72.4 J cm−2 as mentioned above. Likewise, the LOD value for the CN signal of urea in the CO2 atmosphere is improved from 10 wt% to a value of 2 wt% when the fluence regime is increased. These results indicate a high capacity for detection of organic residues in the CO2 atmosphere, even reaching values as small as 3 wt% in the case of the low fluence regime or 1 wt% at high fluence.
| Species | Air | CO2 | ||||||
|---|---|---|---|---|---|---|---|---|
| Adenine | Glycine | Pyrene | Urea | Adenine | Glycine | Pyrene | Urea | |
| LOD in wt%, fluence 14.5 J cm −2 | ||||||||
| CN 388.3 nm | 4 | 10 | 3 | 9 | 6 | 14 | — | 10 |
| C2 473.7 nm | 30 | — | 5 | — | — | — | 3 | — |
| Hα 656.28 nm | — | — | — | — | — | — | — | — |
![[thin space (1/6-em)]](https://www.rsc.org/images/entities/char_2009.gif) |
||||||||
| LOD in wt%, fluence 72.4 J cm −2 | ||||||||
| CN 388.3 nm | 1 | 5 | 1 | 4 | 1 | 4 | — | 2 |
| C2 473.7 nm | 10 | — | 3 | — | 11 | — | 3 | — |
| Hα 656.28 nm | 5 | 4 | 2 | 3 | 1 | 1 | 1 | 1 |
3.2. Discriminant function analysis for organic compounds in doped matrices
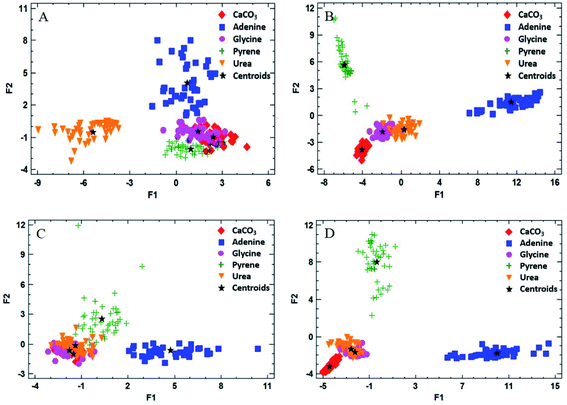
One of the aims of this work was to evaluate the ability of LIBS to discriminate between different organic materials of interest as possible biosignatures in the CO2 atmosphere. Discriminant function analysis (DFA) of the LIBS spectra of the doped matrices was used to examine the possible differentiation between the organic compounds present in the pellet sample. DFA consists of a mathematical method for information processing that allows the classification of a large number of measurements into two or more groups based on a set of experimental quantitative variables. The analysis is carried out by calculating linear combinations of the chosen variables in order to optimize the difference between the values of the function for the cases belonging to each group. The quantitative variables required for the evaluation are the intensities of the corresponding spectral lines and bands of interest. They are all expected to show changes in intensity for the different analyzed samples. In our case, the emission signals selected as quantitative variables were the same indicated above for LOD calculation. The number of total measurements was 45 pulses per sample, averaging 15 pulses at three different sampling points, and the number of groups to be discriminated was set to 5, or the number of different samples analyzed (the inorganic matrix mixed with each of the four organic dopants as well as the pure matrix sample). Finally, statistically significant discriminant functions were obtained as output data and 2D DFA plots were generated by displaying the resulting two main discriminant functions.Fig. 5 exhibits the results of the DFA applied for the classification into groups of measurements for both atmospheric conditions. In addition to the values of the discriminant function for each measurement, the location of the average discriminant function values for each group (or centroids) is also indicated in the chart (as “+” signs).
As shown, the groups were separated by DFA in the CO2 atmosphere using the 50 wt% doped matrix (Fig. 5A and B). As expected, glycine and urea groups appear fairly close to each other in a reduced area, according to their similar molecular structures. As for the air atmosphere (Fig. 5C and D), however, these groups are overlapped on the graph, due to the influence of air fragmentation on the formation of emitting species in the plasma, namely O(I), N(I) and CN, thus disguising the contribution corresponding to the native composition of the organic dopant. In the case of pyrene and adenine, points appear completely separated due to significant differences in the molecular emission response in both atmospheres by using a 50 wt% concentration of the organic compound.
Table 2 summarizes the grade of discrimination undergone by doped samples of different concentrations in organics. As observed, the percentage of correctly classified cases increases with the organic concentration, reaching total separation for pure compounds in both atmospheres.
| %wt | Percentage of correctly classified cases, % | |
|---|---|---|
| Air | CO2 | |
| 10 | 82.7 | 94.7 |
| 50 | 88.9 | 97.8 |
| 100 | 100 | 100 |
3.3. Pearson correlation coefficients for the detection of signal association
One of the aims of this study was to shed light on the relationships between different species existing in the plasma and how the plasma chemistry influences the LIBS spectral intensities. For this purpose, the Pearson correlation coefficients were calculated. Measurements were carried out for a variable content of organic material (0 to 100 wt%) using a CaCO3 matrix with a fluence level of 72.4 J cm−2 and in the presence of air or CO2.The Pearson correlation coefficient is defined as:
 | (1) |
![[x with combining macron]](https://www.rsc.org/images/entities/i_char_0078_0304.gif) is the mean of all xi-data and ȳ is the mean of all yi-data from two data sets; xi and yi are intensities of the emitting species measured at different concentration values.
is the mean of all xi-data and ȳ is the mean of all yi-data from two data sets; xi and yi are intensities of the emitting species measured at different concentration values.
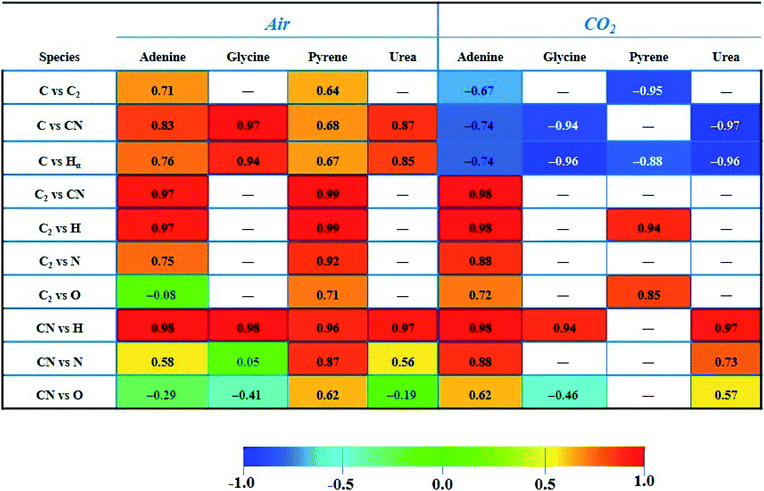
The paired Pearson coefficients obtained from normalized intensities of emission signals are summarized in Table 3. The values were calculated after averaging data from three sampling positions of 25 consecutive laser shots for each concentration level of the dopant. The values of these coefficients indicated the existence or absence of linear proportional associations between the different emission species including the effect of the variable content of organic material in the sample. Therefore, they could help in understanding the fragmentation and recombination pathways undergone by different emitting species in the plasma. In turn, these routes will depend on the interplay of multiple factors, namely the atomic composition and molecular structure of the sample, the distribution in the plasma plume of existing species (according to the size and temperature of the plasma), the influence of the nature and pressure of the surrounding gas, the ablation rate for each analyzed material, and the reaction enthalpies that come into play and that will determine the equilibria and preferential pathways of species formation.
Firstly, it is remarkable how the CO2 atmosphere contributes in a constant way to the atomic C emission intensity at each organic concentration tested. This species undergoes recombination reactions in the plasma leading to formation of molecular species, namely CN, C2, CO, CH, etc. In cases in which atomic C is involved, coefficients offered negative values, so these became inverse correlations. This fact is owing to the inverse relation between intensity of the C signal and the concentration of the dopant, previously observed in both Fig. 3A and 4. In contrast, as observed for analysis in air, the C intensity does not decrease with concentration as carbon is absent in air. As an example, in the CO2 atmosphere the coefficient calculated for C vs. C2 in adenine and pyrene presented values of −0.67 and −0.95, respectively. Likewise, in the case of C vs. CN, values of −0.74, −0.94 and −0.97 for adenine, glycine and urea, respectively, were found. Both findings suggest that the atomic C coming from dissociation of CO2 reacts to yield the molecular species C2 and CN, shifting the equilibria to the right according to:
| C + N ⇌ CN | (2) |
| C + C ⇌ C2 | (3) |
Similarly, C vs. H coefficients exhibited high negative values for all the dopants in the CO2 atmosphere, as a result of a larger abundance of free H atoms as the organic concentration increases in the analyzed sample.
It is likely that atmospheric oxygen reacts with some species in the plasma. For instance, atomic and molecular oxygen could tend to capture C according to the reactions:
| C + O + M → CO + M | (4) |
| C + O2 → O + CO | (5) |
In contrast, for combinations of C2, CN and H species, the coefficients are always positive, hinting at the possibility of these species following pathways in the plasma that do not involve competitive reactions.
The large correlation observed for C2 and CN in adenine and pyrene (0.97 and 0.99 in air, respectively) may similarly indicate that both species follow independent formation pathways, C2 deriving from the extensive fragmentation of the molecule and CN from reactions involving carbon, nitrogen and dissociation fragments of the original molecule. Pathways for the formation of such molecular species could coexist in parallel but are linked between both compounds. Along with direct fragmentation of the parent compound, one possible explanation could be the occurrence of the following displacement reactions in air:
| C + N2 ⇌ CN + N | (6) |
| C2 + N2 ⇌ 2CN | (7) |
| CHn + N ⇌ CN + CHn−1 | (8) |
On the other hand, the value reached for the C2vs. CN coefficient (0.98) in the case of adenine ablation in CO2 is again the result of the occurrence of a direct fragmentation of native bonds of the molecule in addition to reactions (2) and (3), that could also take place to a variable extent.
Likewise, the significant correlation of the C2vs. H intensities in pyrene and adenine could be due to the direct fragmentation of the organic compound that will lead to a proportional increase in the concentrations of C2 and H in the plume. These results are compatible with the data shown in Fig. 2, top panel, and Fig. 3A, where ratios between the slopes of linear adjustments from the curves of both signals, C2 and H, for both dopants, are very similar both in an air atmosphere (about 2.5) and in CO2 gas (about 1.5).
In the same way, a total correlation is found for the CN/H pair in all molecules both in air and in CO2. This fact is again based on the release of H atoms whose abundance in the plasma plume grows with the dopant concentration level, and the prompt recombination of C and N atoms in the plasma (2), which implies a marked increase of the intensity of CN emission with concentration. Clearly, CN and H are formed by independent paths, hence their high correlation.
Concerning the tabulated values for the combination of CN vs. N, coefficients corresponding to adenine (0.88) and urea (0.73) dopants are in good agreement with the respective emissions observed in the LIBS spectra (Fig. 3B). As expected, only these molecules offered atomic N emission in the presence of CO2, increasing the signal intensity as the concentration grows. On the other hand, the large coefficient for pyrene in air (0.87) may be related to the origin of the N source, only coming from the atomization of nitrogen molecules in air. In the same vein, a positive correspondence between CN and O in air is only achieved for pyrene, this being the only studied molecule in which O and N are absent in its structure.
For the case of pyrene in the CO2 atmosphere, other possible routes could explain the decrease in intensity of atomic carbon at 247.8 nm and the rise of atomic oxygen at 777.4 nm displayed in Fig. 3. They are summarized in the reactions below, assuming the intervention of the atmosphere itself in the plasma chemistry:
| CO2 + C ⇌ CO + CO | (9) |
| CO + C ⇌ C2 + O | (10) |
This behavior with opposite trends is in accordance with the Pearson coefficient found for pyrene in CO2 gas between C and O signals (−0.77); the value is not reported in Table 3.
4. Conclusions
Preferential routes for the formation of carbon emitting species from organic or inorganic origins in an atmosphere of CO2 have been investigated. This issue has been evaluated using the emission spectra acquired under the established working conditions based on Pearson correlation coefficients, taking into account the intervention of the surrounding gas in the plasma chemistry. Discrimination of organic dopants present in a carbonate matrix was possible by means of discriminant function analysis. As the results demonstrate, an in-depth analysis of CN and C2 molecular emissions constitutes a valuable approach in order to establish an identification system for organic molecules using LIBS.The emission intensity from the carbon atomic signal underwent a drop with the increase of the organic compound concentration in the ablated sample. This observation indicates the occurrence of pathways of fragmentation and recombination in the plasma not fully understood in the CO2 atmosphere. Indeed, a number of non-emitting molecules seem to exist that however take active part in the chemistry of the plasma.
The limit of detection for the compounds of interest was calculated in the carbonate matrix containing variable concentrations of organic material, resulting in LOD values better than 10 wt% in the CO2 atmosphere.
Conflicts of interest
There are no conflicts to declare.Acknowledgements
This work was partially supported by the Programa Estatal de Fomento de la Investigación Científica y Técnica de Excelencia, Ministerio de Economia, Industria y Competitividad of Spain, Reference CTQ2017-82137-P. Additional support from the Programa Operativo FEDER Andalucía 2014–2020, Consejeria de Economía y Conocimiento de la Junta de Andalucia, Reference UMA18-FEDERJA-272, is gratefully acknowledged. One of the authors, L. García, is grateful for the contract under the Sistema Nacional de Garantia Juvenil and the Programa Operativo de Empleo Juvenil. The authors would also like to acknowledge the support of the International Space Science Institute (ISSI) Bern and the International Space Science Institute (ISSI) Beijing.References
- F. J. Fortes, J. Moros, P. Lucena, L. M. Cabalín and J. J. Laserna, Anal. Chem., 2013, 85, 640–669 CrossRef CAS PubMed.
- J. Moros and J. Laserna, Appl. Spectrosc., 2019, 73, 963–1011 CrossRef CAS.
- J. Anzano, B. Bonilla, B. Montull-Ibor, R. J. Lasheras and J. Casas-González, J. Polym. Eng., 2010, 30, 177–188 CAS.
- S. Grégoire, M. Boudinet, F. Pelascini, F. Surma, V. Detalle and Y. Holl, Anal. Bioanal. Chem., 2011, 400, 3331–3340 CrossRef PubMed.
- Y. Yu, L. B. Guo, Z. Q. Hao, X. Y. Li, M. Shen, Q. D. Zeng, K. H. Li, X. Y. Zeng, Y. F. Lu and Z. Ren, Opt. Express, 2014, 22, 3895–3901 CrossRef CAS PubMed.
- P. Lucena, A. Doña, L. M. Tobaria and J. J. Laserna, Spectrochim. Acta, Part B, 2011, 66, 12–20 CrossRef.
- J. Serrano, J. Moros, C. Sánchez, J. Macías and J. J. Laserna, Anal. Chim. Acta, 2014, 806, 107–116 CrossRef CAS PubMed.
- I. Gaona, J. Serrano, J. Moros and J. J. Laserna, Anal. Chem., 2014, 86, 504–5052 CrossRef PubMed.
- R. A. Multari, D. A. Cremers, J. M. Dupre and J. E. Gustafson, Appl. Spectrosc., 2010, 64, 750–759 CrossRef CAS PubMed.
- S. J. Rehse, Q. I. Mohaidat and S. Palchaudhuri, Appl. Opt., 2010, 49, C27–C35 CrossRef CAS.
- S. J. Rehse, H. Salimnia and A. W. Miziolek, J. Med. Eng. Technol., 2012, 36, 77–89 CrossRef CAS.
- A. K. Knight, N. L. Scherbarth, D. A. Cremers and M. J. Ferris, Appl. Spectrosc., 2000, 54, 331–340 CrossRef CAS.
- P. J. Gasda, T. E. Acosta-Maeda, P. G. Lucey, A. K. Misra, S. K. Sharma and G. J. Taylor, Appl. Spectrosc., 2015, 69, 173–192 CrossRef CAS PubMed.
- C. Fabre, S. Maurice, A. Cousin, R. C. Wiens, O. Forni, V. Sautter and D. Guillaume, Spectrochim. Acta, Part B, 2011, 66, 280–289 CrossRef CAS.
- R. C. Wiens, S. Maurice and The ChemCam Team, Geochem. News, 2011, 145, 41–48 Search PubMed.
- R. Wiens, S. Maurice, B. Barraclough, M. Saccoccio, W. C. Barkley and The ChemCam Team, Space Sci. Rev., 2012, 170, 167–227 CrossRef.
- D. Vaniman, M. D. Dyar, R. Wiens, A. Ollila, N. Lanza, J. Lasue, J. M. Rhodes, S. Clegg and H. Newsom, Space Sci. Rev., 2012, 170, 229–255 CrossRef CAS.
- D. F. Blake, R. V. Morris, G. Kocurek, S. M. Morrison, R. T. Downs and The MSL Science Team, et al. , Science, 2013, 341, 1239505 CrossRef CAS PubMed.
- S. Le Mouelic, O. Gasnault, K. E. Herkenhoff, N. T. Bridges, Y. Langevin, N. Mangold and The MSL Science Team, et al. , Icarus, 2015, 249, 93–107 CrossRef CAS.
- S. Maurice, S. M. Clegg, R. C. Wiens, O. Gasnault, W. Rapin, O. Forni, A. Cousin, V. Sautter, N. Mangold, L. Le Deit, M. Nachon, R. B. Anderson, N. L. Lanza, C. Fabre, V. Payré, J. Lasue, P.-Y. Meslin, R. J. Léveillé, B. L. Barraclough, P. Beck, S. C. Bender, G. Berger, J. C. Bridges, N. T. Bridges, G. Dromart, M. D. Dyar, R. Francis, J. Frydenvang, B. Gondet, B. L. Ehlmann, K. E. Herkenhoff, J. R. Johnson, Y. Langevin, M. B. Madsen, N. Melikechi, J.-L. Lacour, S. Le Mouélic, E. Lewin, H. E. Newsom, A. M. Ollila, P. Pinet, S. Schröder, J.-B. Sirven, R. L. Tokar, M. J. Toplis, C. d'Uston, D. T. Vanimanj and A. R. Vasavadap, J. Anal. At. Spectrom., 2016, 31, 863–889 RSC.
- D. E. Anderson, B. L. Ehlmann, O. Forni and S. M. Clegg, et al. , J. Geophys. Res.: Planets, 2017, 122, 744–770 CAS.
- T. Dequaire, P. Y. Meslin, P. Beck, M. Jaber, A. Cousin, W. Rapin, J. Lasue, O. Gasnault, S. Maurice, A. Buch, C. Szopa, P. Coll and The MSL Science Team, Spectrochim. Acta, Part B, 2017, 131, 8–17 CrossRef CAS.
- S. Schröder, K. Rammelkamp, D. S. Vogt, O. Gasnault and H. W. Hübers, Icarus, 2019, 325, 1–15 CrossRef.
- R. Brennetot, J. L. Lacour, E. Vors, A. Rivoallan, D. Vailhen and S. Maurice, Appl. Spectrosc., 2003, 57, 744–752 CrossRef CAS PubMed.
- B. Sallé, D. A. Cremers, S. Maurice and R. C. Wiens, Spectrochim. Acta, Part B, 2005, 60, 479–490 CrossRef.
- T. Delgado, J. M. Vadillo and J. J. Laserna, Appl. Spectrosc., 2014, 68, 33–38 CrossRef CAS PubMed.
- T. Delgado, J. M. Vadillo and J. J. Laserna, Appl. Spectrosc., 2016, 70, 1364–1374 CrossRef CAS PubMed.
- F. Colao, R. Fantoni, V. Lazic and A. Paolini, Appl. Phys. A, 2004, 79, 143–152 CrossRef CAS.
- A. J. Effenberger Jr and J. R. Scott, Sensors, 2010, 10, 4907–4925 CrossRef PubMed.
- N. G. Glumac, W. K. Dong and W. M. Jarrell, Soil Sci. Soc. Am. J., 2010, 74, 1922–1928 CrossRef CAS.
- J. J. Wray, S. L. Murchie, J. L. Bishop, B. L. Ehlmann, R. E. Milliken, M. B. Wilhelm, K. D. Seelos and M. Chojnacki, J. Geophys. Res.: Planets, 2016, 121, 652–677 CAS.
- J. Panell, D. Cullen, M. R. Sims, S. Bowden, C. S. Cockell, R. Court, P. Ehrenfreund, F. Gaubert, W. Grant, V. Parro, M. Rohmer, M. Sephton, H. Stan-Lotter, A. Steele, J. Toporski and J. Vago, Astrobiology, 2007, 7, 578–604 CrossRef PubMed.
- T. Delgado, J. M. Vadillo and J. J. Laserna, J. Anal. At. Spectrom., 2014, 29, 1675–1685 RSC.
| This journal is © The Royal Society of Chemistry 2020 |

