 Open Access Article
Creative Commons Attribution 3.0 Unported Licence
Parameter optimisation for electrochemically activated MoTe2†
Jessica C.
McGlynn
*,
Matthew
Friskey
and
Alexey Y.
Ganin
 *
*
School of Chemistry, University of Glasgow, Glasgow, G12 8QQ, UK. E-mail: alexey.ganin@glasgow.ac.uk
First published on 14th July 2020
Abstract
MoTe2 has been shown to undergo an electrochemical activation in operando, which is evidenced by a dramatic reduction of the overpotential. This work identifies the optimum reaction conditions in which MoTe2 can be activated. The activation can be achieved by sweeping the potential between the optimal range of +0.2 V and −0.5 V (vs. NHE) for 100 cycles.
Transition metal dichalcogenides (TMDCs) have shown considerable promise as hydrogen evolution electrocatalysts owing to their diverse structures and properties.1–5 Most noticeably, the ability to electrochemically enhance their activity towards the hydrogen evolution reaction (HER) in operando has sparked a renewed interest.6–8 This ‘electrochemical activation’ could open up opportunities for the design of more efficient electrocatalysts with their performance being driven by physical stimuli rather than composition. However, in most cases, such electrochemical activation is due to irreversible structural, compositional and/or morphology changes. This therefore limits the application of the activation process as the original catalyst hardly resembles the activated version. On the other hand, nanocrystalline 1T′-MoTe2 undergoes electrochemical activation (as evident through a drastic improvement of the overpotential at j = −10 mA cm−2 from 320 mV to 178 mV) without apparent chemical or morphological changes to the catalyst.10 These findings were further evidenced by the reversibility of the activation suggesting that the process may be purely electronic in nature.9,10 From this perspective, understanding the activation process in 1T′-MoTe2 by varying the experimental parameters is important. Herein, this work aims to provide a comprehensive study with the aim to elucidate the activation mechanism seen in nanocrystalline 1T′-MoTe2, and describes the possibility for tuning the overpotential to the desired outcome by varying the experimental parameters. Further, experimental confirmation of the active sites at which the activation occurs is achieved.
Understanding the gradual activation mechanism
To delve deeper into the gradual activation procedure in nanocrystalline 1T′-MoTe2, the overpotential required for j = −10 mA cm−2 was monitored throughout the 100 cycles scan, with Fig. 1 illustrating the gradual improvement in activity. In this way, the gradual improvement can be visualised, and the need for 100 cycles becomes clear. Upon application of a reductive potential bias, the overpotential gradually improves from 320 mV at j = −10 mA cm−2 with increasing cycle number until the optimised overpotential of 178 mV is obtained after 100 cycles. The changes to morphology, composition and crystal structure post-cycling were ruled out using characterisation techniques including SEM, PXRD, ICP-OES and XPS (Fig. S1–S3†). It should also be noted that once this improved overpotential is reached, it remains stable at 178 mV for at least 1000 cycles and reverts back to its original value of 320 mV once the cathodic bias is removed (Fig. S4†). Additionally, the electrochemically active surface area (ECSA) before and after cycling was found to remain unchanged, thus reiterating no changes to catalyst morphology or surface area take place with cycling (Fig. S5†).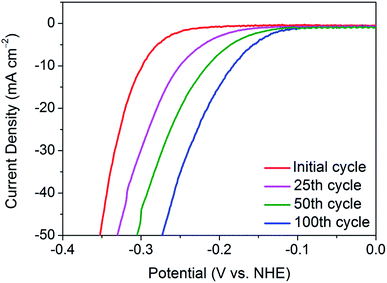 | ||
| Fig. 1 Comparison of the current densities achieved by nanocrystalline 1T′-MoTe2 after sweeping between the potential range of +0.2 V and −0.5 V (vs. NHE) for 25, 50 and 100 cycles in 1 M H2SO4. | ||
The activation of nanocrystalline 1T′-MoTe2 has been proposed to be due to electron doping on the basal plane surface.10 However, this raises concerns regarding the slow nature of the activation process. Indeed, due to the bulk nature of the material, limiting electrochemical processes such as diffusion limitation and double layer formation come into play. Thus, a sufficient ‘activation energy’ is required to overcome these processes. It is theorised that the sweeping nature of cyclic voltammetry allows for effective high-energy pulses to be applied to the working electrode, which results in a number of cycles being required. Hence, in order to determine if a similar activation process is possible in a shorter time-frame, chronoamperometry was employed.
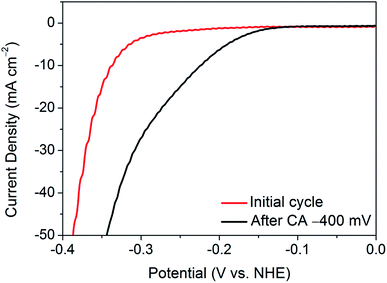
As such, a constant potential of −400 mV (vs. NHE) was applied for a period of one minute, and an LSV was taken immediately after the measurement. Fig. 2 shows the resulting LSV in comparison with that of the initial material. Thus, by application of a continuous reductive potential, the activation of nanocrystalline 1T′-MoTe2 can be achieved much more quickly. However, it should be noted that the application of potentials exceeding −400 mV (vs. NHE) produced an increasingly large volume of hydrogen bubbles at the electrode surface with time, and in most instances resulted in the catalyst losing contact with the glassy carbon surface. Thus, application of −400 mV (vs. NHE) for one minute to yield an overpotential of 220 mV at j = −10 mA cm−2 was the limit of the activation by chronoamperometry means.
To combat this, cyclic voltammetry can be strategically employed to reach a compromise between the speed of activation and the potential applied. Sweeping the voltage to sufficiently more reductive potentials enables high current densities to be reached in a pulsing manner, and hence diffusion limitations can be overcome all the while maintaining contact between the catalyst and the substrate. Thus, due to the sweeping nature of cyclic voltammetry, the slow cathodic response is unsurprising.
Tuning the catalytic activity by varying experimental parameters
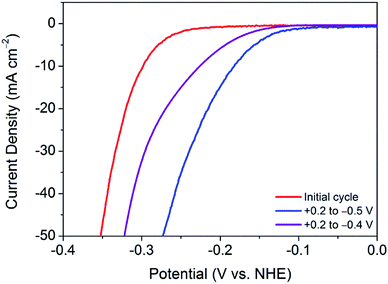
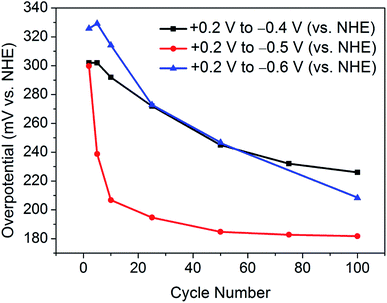
This finding leads on to the possibility of tuning the activation procedure by varying the experimental parameters. For example, by extending the sweeping range to more reductive potentials, it is possible that the activation procedure may be achieved in a shorter number of cycles. Accordingly, analogous experiments were performed with varying potential ranges. Narrowing the potential range at which the catalyst is swept to between +0.2 V and −0.4 V (vs. NHE) provides further evidence of a sufficient activation energy being required to overcome limiting electrochemical processes. As can be seen in Fig. 3, after 100 cycles between this narrow range, the material is only partially activated, with far more than 100 cycles being required to reach the fully activated overpotential of 178 mV.Contrastingly, one would expect extending the potential range to more reductive potentials would lessen the number of cycles required to observe the improved overpotential. However, broadening the range to +0.2 V and −0.6 V (vs. NHE), the current densities reached proved to remove the catalyst from the electrode surface as a result of excessive bubbles being produced. In tandem, Raman spectroscopy after cycling between +0.2 V and −0.6 V (vs. NHE) showed the remaining material on the electrode surface to have decomposed to elemental tellurium (Fig. S6†). This is in stark contrast to results achieved in prior reports, which show no structural degradation to take place.7,10 Thus, the degradation is attributed to the application of excessively reductive potentials. In light of these measurements, the optimum parameters were deemed to be 100 cycles in the potential range of +0.2 V and −0.5 V (vs. NHE). Fig. 3 shows a comparison of the polarisation curves obtained after 100 cycles for each of the investigated potential ranges.
Similarly, Fig. 4 illustrates the gradual improvement in overpotential at j = −10 mA cm−2 with increasing cycle number for each investigated potential range. It should be noted that, between the potential range of +0.2 V and −0.6 V (vs. NHE), the catalyst was seen to lose contact with the electrode surface, and hence the overpotential values are most plausibly underestimated.
Understanding the kinetics of the reaction
Further, as reported previously, the 1st CV cycle is attributed to the removal of the oxide layer on nanocrystalline 1T′-MoTe2, as is commonly the case for TMDC electrocatalysts.11,12 As a result of this, the Tafel slope of 68 ± 4 mV dec−1 may be overestimated as the activation may have already begun during this cycle. Since the initial cycle (between +0.2 V and −0.5 V (vs. NHE)) is disregarded, the original Tafel slope may have been concealed. To investigate this, the initial oxide layer removal cycle was swept between a narrower potential range of +0.2 V and −0.4 V (vs. NHE), i.e. between values at which no immediate activation would be observed. Subsequently, the range was then extended to −0.5 V (vs. NHE) for the remaining cycles. As a result, the initial Tafel slope was found to be more in line with the Volmer–Heyrovsky mechanism of hydrogen evolution (with the Heyrovsky step being rate limiting) with a Tafel slope of 46 ± 5 mV dec−1 being obtained. Fig. 5 shows a comparison of the Tafel slopes obtained before cycling, i.e. to an initial value of −0.4 V (vs. NHE) and after activation following 100 cycles between the potential range of +0.2 V and −0.5 V (vs. NHE). As the activation process proceeds the mechanism of hydrogen evolution reaction also changes. The Tafel slope of the non-activated material (46 ± 5 mV dec−1) suggests that the electrochemical desorption step (Heyrovsky) is rate-limiting (Table S1†). The Tafel slope of 116 ± 17 mV dec−1 obtained after 100 cycles on the activated material is more indicative of the discharge (Volmer) step becoming rate-limiting (Table S1†). Therefore, the adsorption of hydrogen on the basal plane surface becomes the limiting factor. The possible explanation for the significant change in H-adsorption rate could be based on DFT calculations by Seok et al.9 Their calculations have shown that 1T′-MoTe2 could exhibit Peierls-type lattice distortion on Mo-atoms upon electron doping (a probable scenario under reductive bias). The distortion leads to a change in H-adsorption compared to the non-activated (and undistorted) material.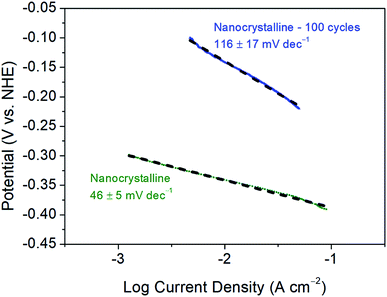 | ||
| Fig. 5 Tafel plots and corresponding Tafel slopes of nanocrystalline 1T′-MoTe2 before and after 100 CV cycles. Scans were taken with a scan rate of 2 mV s−1. | ||
The change in mechanism of hydrogen evolution on nanocrystalline 1T′-MoTe2 is particularly interesting, as it varies significantly to previous studies on the electrochemical activation of TMDCs. Liu et al. reported a substantial overpotential improvement in TaS2 to only 60 mV at j = −10 mA cm−2 after 5000 cycles, and a reduction in Tafel slope from 282 mV dec−1 to 37 mV dec−1.6 This change in Tafel slope is indicative of the mechanism changing from being Volmer-limited to the Heyrovsky step being rate limiting. This is in contrast to work on 1T′-MoTe2 reported here which shows the opposite effect. Additionally, the authors attribute their enhanced activity to be due to sample thinning as observed by SEM. This change in morphology therefore indicates the mechanism of activation is irreversible and the process is deemed a ‘self-optimizing’ behaviour.
Confirmation of the active sites
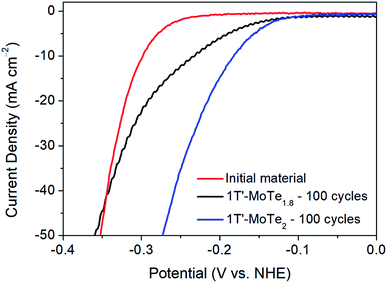
Further, DFT studies propose two potential active sites by which the mechanism of hydrogen evolution proceeds. Firstly, the Te α-site exhibits a hydrogen adsorption energy of ΔEH = +0.67 eV, and is also proposed by Seok et al. as being the primary active site.9 However, there exists the possibility of an η-site, which involves the formation of a tri-haptic metal hydride, meaning adsorption would occur on Mo active sites. The η-site shows the most favourable hydrogen adsorption energy, with ΔEH = +0.58 eV, thus implying that the η-site is the primary active site. Therefore, if the η-site were indeed the primary active site, one would expect an improvement in catalytic performance in a Te-deficient analogue of 1T′-MoTe2. To investigate this experimentally, 1T′-MoTe2 materials were prepared with both an excess and deficiency of tellurium. In this way, the catalytic activity of the non-stoichiometric materials could be compared with that of the stoichiometric, and the active site, i.e. Te or Mo, confirmed.Accordingly, the material with a nominal composition MoTe1.8 (10% Te-deficient) was initially investigated by sweeping the potential between +0.2 V and −0.5 V (vs. NHE). After 100 cycles, the Te deficient material was found to undergo a similar activation, albeit to a lesser extent. The overpotential at j = −10 mA cm−2 improved to 210 mV, thus indicating a poorer performance than that of the stoichiometric material. Therefore, despite the η-site showing the most favourable hydrogen adsorption energy, the adsorption of H on Mo active sites contradicts experimental evidence. Additionally, the initial cycle of the material with a nominal composition MoTe2.2 (10% excess Te) was found to reach considerably higher current densities than its stoichiometric counterpart. However, it should be noted that upon cycling 1T′-MoTe2.2, the material was found to lose contact with the electrode, hence the excess of Te was found to destabilise the material. Fig. 6 shows a comparison of the polarisation curves obtained for the non-stoichiometric materials.
Therefore, due to the considerably higher overpotential achieved after cycling 1T′-MoTe1.8 100 times, coupled with the much greater current densities achieved during the initial cycle of 1T′-MoTe2.2, we conclude that these findings are in line with prior computational studies which suggest H adsorption occurs on Te sites, rather than Mo.
Conclusions
In this work, we have sought to understand the reason behind the gradual activation process of nanocrystalline 1T′-MoTe2. Rather than being a result of irreversible structural, compositional and/or morphology changes, the activation mechanism is deemed to be electronic in nature. As a result of the bulk, freestanding nature of the nanocrystalline material, a sufficient activation energy is required to induce the overpotential improvement. This can be achieved by chronoamperometry, however, external parameters such as bubble formation and electrode preparation limits this application. Instead, cyclic voltammetry can strategically be used to effectively pulse the material at highly reductive potentials, all the while maintaining contact between the catalyst and the electrode substrate. Further, by tuning the potential range and number of cycles, we propose that the activation can be altered by the operator, thus allowing for a controlled activation procedure, provided that the contact between the catalyst and the electrode can be maintained. This then opens up a new route of accessing catalytically active materials, with a similar activation mechanism likely to exist in a variety of TMDC materials.Conflicts of interest
There are no conflicts to declare.Acknowledgements
We acknowledge the University of Glasgow, EPSRC (EP/N509668/1) and the Carnegie Trust for a Research Incentive Grant (RIG007428) for supporting this work.References
- B. Hinnemann, P. G. Moses, J. Bonde, K. P. Jørgensen, J. H. Nielsen, S. Horch, I. Chorkendorff and K. K. Nørskov, J. Am. Chem. Soc., 2005, 127, 5308–5309 CrossRef CAS PubMed.
- M. A. Lukowski, A. S. Daniel, F. Meng, A. Forticaux, L. Li and S. Jin, J. Am. Chem. Soc., 2013, 135, 10274–10277 CrossRef CAS PubMed.
- M. Chhowalla, H. S. Shin, G. Eda, L.-J. Li, K. P. Loh and H. Zhang, Nat. Chem., 2013, 5, 263–275 CrossRef PubMed.
- T. F. Jaramillo, K. P. Jørgensen, J. Bonde, J. H. Nielsen, S. Horch and I. Chorkendorff, Science, 2007, 317, 100–102 CrossRef CAS PubMed.
- J. C. McGlynn, I. Cascallana Matías, J. P. Fraser, I. Roger, J. McAllister, H. N. Miras, M. D. Symes and A. Y. Ganin, Energy Technol., 2018, 6, 345–350 CrossRef CAS.
- Y. Liu, J. Wu, K. P. Hackenberg, J. Zhang, Y. M. Wang, Y. Yang, K. Keyshar, J. Gu, T. Ogitsu, R. Vajtai, J. Lou, P. M. Ajayan, B. C. Wood and B. I. Yakobson, Nat. Energy, 2017, 2, 17127 CrossRef CAS.
- J. Seok, J.-H. Lee, D. Bae, B. Ji, Y.-W. Son, Y. H. Lee, H. Yang and S. Cho, APL Mater., 2019, 7, 071118 CrossRef.
- G. Li, D. Zhang, Y. Yu, S. Huang, W. Yang and L. Cao, J. Am. Chem. Soc., 2017, 139, 16194–16200 CrossRef CAS PubMed.
- J. Seok, J.-H. Lee, S. Cho, B. Ji, H. W. Kim, M. Kwon, D. Kim, T.-M. Kim, S. H. Oh, S. W. Kim, Y. H. Lee, Y.-W. Son and H. Yang, 2D Mater., 2017, 4, 25061 CrossRef.
- J. C. McGlynn, T. Dankwort, L. Kienle, N. A. G. Bandeira, J. P. Fraser, E. K. Gibson, I. Cascallana-Matías, M. D. Symes, H. N. Miras and A. Y. Ganin, Nat. Commun., 2019, 10, 4916 CrossRef PubMed.
- J. B. McManus, G. Cunningham, N. McEvoy, C. P. Cullen, F. Gity, M. Schmidt, D. McAteer, D. Mullarkey, I. V. Shvets, P. K. Hurley, T. Hallam and G. S. Duesberg, ACS Appl. Energy Mater., 2019, 2, 521–530 CrossRef CAS.
- K. Oshikawa, M. Nagai and S. Omi, J. Phys. Chem. B, 2001, 105, 9124–9131 CrossRef CAS.
Footnote |
| † Electronic supplementary information (ESI) available. See DOI: 10.1039/d0se00684j |
| This journal is © The Royal Society of Chemistry 2020 |

