Investigating the influence of block copolymer micelle length on cellular uptake and penetration in a multicellular tumor spheroid model†
Qing
Yu‡
 a,
Megan G.
Roberts‡
 a,
Loujin
Houdaihed
b,
Yang
Liu
 a,
Kuan
Ho
 a,
Gilbert
Walker
a,
Christine
Allen
a,
Gilbert
Walker
a,
Christine
Allen
 b,
Raymond M.
Reilly
 b,
Ian
Manners
 c and
Mitchell A.
Winnik
 *ad
*ad
aDepartment of Chemistry, University of Toronto, 80 St. George Street, Toronto, ON M5S 1H6, Canada. E-mail: m.winnik@utoronto.ca
bLeslie Dan Faculty of Pharmacy, University of Toronto, 144 College Street, Toronto, ON M5S 3M2, Canada
cDepartment of Chemistry, University of Victoria, Victoria, British Columbia V8W 3V6, Canada
dDepartment of Chemical Engineering and Applied Chemistry, University of Toronto, Toronto, ON M5S 3E2, Canada
First published on 18th December 2020
Abstract
The efficient penetration of drug nanocarriers into tumors is an important prerequisite for therapeutic and diagnostic success. The physicochemical properties of nanocarriers, including size, shape and surface chemistry have been shown to influence their transport in biological systems. Recent studies have shown that elongated nanoparticles (NPs) can exhibit advantageous properties in comparison to spherical NPs, but these experiments have involved a variety of different materials, many of which are characterized by a broad size distribution. Here we describe a series of rigid rod-like micelles of uniform width, with narrow length distributions, and common surface chemistry, and examine their cell uptake and penetration into multicellular tumor spheroids (MCTSs) formed from two human breast cancer cell lines (MDA-MB-436 and MDB-MB-231). These micelles were prepared from a polyferrocenylsilane (PFS) diblock copolymer (BCP) with a corona block consisting of a statistical polymer of aminopropyl methacrylamide and oligo(ethyleneglycol methacrylate) (PFS27-b-PAPMA3-stat-POEGMA48). The rigid rod micelles, with a common width (12 nm) and lengths ranging from 80 to 2000 nm, were prepared by seeded growth crystallization-driven self-assembly in ethanol and then transferred to water. To consider whether changing the shape of these micelles affects its uptake and penetration behavior, analogous spherical micelles were prepared by direct nanoprecipitation into water. Both micelle shape and length were found to influence cellular uptake and penetration into 500 μm MCTSs. Laser confocal fluorescence microscopy was used to examine penetration of these micelles into three-dimensional MCTS up to 90 μm depth. Micelles with an elongated shape and short length (80 nm) demonstrated the deepest penetration into the MCTSs formed by MDA-MB-436 cells. Micelles with lengths of 200 nm also showed substantial penetration into these MCTS, but the extent and depth of tumor penetration of the rod-like micelles decreased with increasing aspect ratio. MCTS of MDA-MB-231 cells had a less dense, more open structure than those formed by MDA-MB-436 cells. Here more extensive penetration was observed, particularly for the longer micelle samples.
Introduction
Nanomedicines in the form of colloidal nanoparticles (NPs) can serve as powerful vehicles for the delivery of cytotoxic agents to tumors.1,2 The rapid development and accumulated interest in these technologies has led to a large number of engineered NP designs exhibiting many different properties (i.e., varying materials, sizes, shapes and surface chemistries) all of which affect their overall performance.3 With growing interest in biomimetic design, NPs with elongated structures have been prepared to mimic filamentous or cylindrical bacteria and viruses found in nature, in the hope of obtaining unique benefits over spherical NPs of similar size. NPs exhibiting a rod or worm-like shape have demonstrated several promising properties as drug carriers, for instance prolonged circulation time in the bloodstream4–8 and preferred accumulation at solid tumor sites.8–11 A number of reviews have been published describing the influence of NP size and shape on cell uptake and biodistribution.12,13 We are particularly impressed by the in-depth 2018 review by Kinnear et al.14The most common anti-cancer therapy test platform employs cells in two-dimensional (2D) monolayers on adherent surfaces for investigating NP interactions with cells. These studies are beneficial since they can provide information on extent of cell uptake as well as cell uptake mechanisms and the ultimate subcellular location of the NPs within the cell. If these in vitro studies show promise, animal studies are then commonly used to assess NP pharmacokinetics and biodistribution, as well as penetration into tumor tissue; and thus, reveal the complexity and the many biological barriers that can interfere with NP drug delivery.15 These studies are important but limited by their cost and time consuming nature.
Over the past 15 years, in vitro 3D models have been developed as intermediary tools for understanding NP interactions at the nano-tumor interface.16 Among these 3D models, multicellular tumor spheroids (MCTS) have shown great promise as structures of intermediate complexity between 2D cell culture and real tumors for studying key features of NP delivery to tumors.
While there have been many studies that have examined the interaction of NPs with MCTS, very few studies examined the influence of NP shape. A question of particular interest to us is how the length and aspect ratio of an elongated NP affects its penetration into MCTS. One challenge in these sorts of studies is maintaining common surface chemistry across NP formulations. Block copolymer micelles help overcome this problem, since surface chemistry is solely determined by the polymer block that forms the micelle corona. Another challenge is to obtain samples with different aspect ratios and narrow length distributions. It is common to prepare block copolymer micelles that are uniform in width, but it is much more difficult to achieve narrow length distributions.
For example, Stenzel's group17,18 examined how changing the mean length of elongated block copolymer micelles affected their interaction with breast cancer cell lines MCF-7 and MDA-MB-231. These micelles consisted of a poly(methyl methacrylate) core and a fructose-based methacrylate corona [P(1-O-MAFru)31-b-PMMA166]. While the main focus of this work was on cell uptake experiments, the group also examined micelle penetration into MCF-7 tumor spheroids and found comparable micelle incorporation for 400 nm and 800 nm long micelles and less for micelles longer than 2000 nm. A complicating factor of this study however was that these micelle samples had broad contour length distributions.
Another interesting approach was reported by Steinmetz and coworkers, who are specialists in plant viruses. This group took advantage of the properties of tobacco mosaic virus (TMV), a rod-shaped nanoparticle (300 × 18 nm) assembled from 2130 identical coat proteins arranged helically around a single-strand, positive-sense RNA molecule. The length of the RNA dictates the length of the TMV analog. By manipulating the RNA, this group was able to prepare rods with median lengths of 56, 133, 279 nm (aspect ratios AR ≈ 3.5, 7, 16.5) with somewhat broad but distinct length distributions.19 The rod surfaces were functionalized with a heterobifunctional PEG (M = 5000, 25% of the coat proteins). Some samples also carried the tripeptide RGD as a targeting agent. The authors compared the tumor-homing properties of TMV formulations with different aspect ratios using a mouse model of colon cancer (NCr nu/nu nude mice with subcutaneous HT-29 xenografts). In subsequent work,20 they compared the cell uptake of the targeted and non-targeted nanorods in 2D cell culture, and also published a detailed mathematical model of how these types of rod-like species may diffuse into a MCTS.
Block copolymers with a crystallizable block can undergo a seeded growth process referred to as “living” crystallization driven self-assembly (CDSA) to generate rod-like micelles of uniform width and narrow length distribution. In this type of micelle, the core width is related to the degree of polymerization of the crystalline core-forming block, and the brush density is determined by the number of folds in the core. The dimensions of the solvent-swollen corona depend upon the degree of polymerization of the corona-forming block. Recently, Manners and coworkers published a report exploring the cellular uptake of tailored, low dispersity 1D NPs formed using CDSA from an amphiphilic block copolymer, poly(dihexylfluorene)-b-poly(ethylene glycol) (PDHF13-b-PEG227), with a crystallizable PDHF core-forming block and a ‘stealth’ PEG corona-forming block with different end-group functionalities.21 This design allowed both targeted and untargeted nanofibers to be compared. Overall, they found minimal uptake by HeLa cells over relatively short exposure times (1 h) for PEGylated micelles lacking an active targeting group but rapid uptake for micelles carrying-PEG-folate groups at both ends of the micelle.
We are interested in understanding how the length of rod-like micelles formed using CDSA affects uptake by cells and penetration into model tumors. As a first step in this direction, we examined the interaction of a series of rod-like block copolymer micelles of different lengths, ranging from 80 to 2000 nm, with two human breast cancer cell lines, MDA-MB-231 and MDA-MB-436. The micelles were generated from a diblock copolymer of a polyferrocenylsilane (PFS) core-forming block and a corona block consisting of a statistical copolymer of (aminopropyl)-methacrylamide and oligo(ethylene glycol methacrylate) (Mn = 500) (PFS27-b-PAPMA3-stat-OEGMA48).22 To consider whether changing the shape of these micelles affects its uptake and penetration behavior, analogous spherical micelles were also prepared. After attachment of the dye FITC to the corona amino groups, we used flow cytometry to examine cell uptake in two-dimensional (2D) cell culture and laser confocal fluorescence microscopy to examine penetration of these micelles into three-dimensional (3D) MCTS from both cell lines. Both the extent of cell uptake and the depth of tumor penetration decreased with increasing micelle length, but important differences were seen between the two cell lines.
Results and discussion
Preparation of PFS27-b-PAPMA3-stat-POEGMA48 micelles
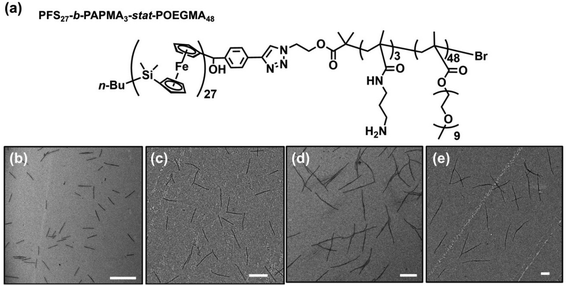
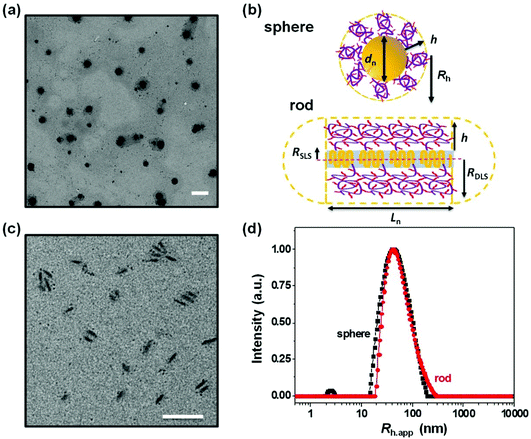
In the experiments described here, we employed five samples of rod-like PFS27-b-PAPMA3-stat-OEGMA48 micelles with a common core width (12 ± 2 nm) and lengths ranging from 80 to 2000 nm, with standard deviations of length distributions of ca. 15%. The structure of PFS27-b-PAPMA3-stat-OEGMA48 and TEM images of these micelle samples are presented in Fig. 1. These samples, including the polymer synthesis, the self-assembly conditions, the transfer to water and the stability in cell culture media were described in a previous publication.22 Even though it is now more than a year later, we would like to note that the experiments described in this paper were carried out in 2019 while the work described in that publication was under review. For simplicity we will denote the micelles with number average lengths Ln = 81, 197, 497, 978, and 1835 nm as L = 80, 200, 500, 1000, and 2000 nm. Multiangle static (SLS) and dynamic (DLS) light scattering experiments described in our previous publication22 showed that PFS27-b-PAPMA3-stat-POEGMA48 micelles formed in ethanol had a cross-section RSLS of 10 nm and a cross-section hydrodynamic radius RDLS of 14 nm. These two values, RSLS and RDLS remained constant for the micelle samples of different lengths. Therefore, the cross-sections of all the rod-like micelles share the same dimensions with a core width of 12 ± 2 nm and a cross-section hydrodynamic diameter of 28 nm. For rod-like micelles, the thickness of the POEGMA corona can be calculated as the difference between hydrodynamic cross-section radius (RDLS = 14 nm) and half the core diameter (hrod = RDLS − Wcoren/2 ≈ 8 nm). These dimensions are depicted in the drawing in Fig. 2. The common surface chemistry and the fixed cross-section dimension ensured that length was the key variable in these rod-like micelles, making them promising materials to investigate the size effects on cellular uptake and penetration into MCTSs.The DLS intensity distribution plot for this sample is presented in Fig. 2d and compared to that of the corresponding 90° DLS measurement of the 80 nm rod-like micelle sample. They are very similar and essentially overlap. Many authors have compared elongated and spherical NPs intended for drug delivery designed to have similar values of Rh as determined by DLS.24–26 This is an overly simplified description of NP size. A deeper analysis shows that the 80 nm rod-like micelles occupy a much smaller average volume than the spherical micelles.
![[thin space (1/6-em)]](https://www.rsc.org/images/entities/char_2009.gif) 000 nm3. For the rod-like micelles, the micelle volume combines the hydrodynamic cross-section radius (RDLS = 14 nm) of the micelle with the micelle length. In addition, there is a contribution to the micelle length and volume that is associated with the corona chains that extend beyond the ends of the core. We demonstrated the importance of this additional contribution in a previous study, where we found that for short rod-like micelles the weight-average micelle length determined by light scattering was slightly longer than the weight average core length measured in TEM images.27 We model this additional contribution to the micelle volume as two hemispherical end caps of radius hrod on each end of the micelle. In this way, the shortest rod-like micelle sample yields a micelle volume of 52
000 nm3. For the rod-like micelles, the micelle volume combines the hydrodynamic cross-section radius (RDLS = 14 nm) of the micelle with the micelle length. In addition, there is a contribution to the micelle length and volume that is associated with the corona chains that extend beyond the ends of the core. We demonstrated the importance of this additional contribution in a previous study, where we found that for short rod-like micelles the weight-average micelle length determined by light scattering was slightly longer than the weight average core length measured in TEM images.27 We model this additional contribution to the micelle volume as two hemispherical end caps of radius hrod on each end of the micelle. In this way, the shortest rod-like micelle sample yields a micelle volume of 52![[thin space (1/6-em)]](https://www.rsc.org/images/entities/char_2009.gif) 000 nm3. The two hemispherical end caps contributed by the corona chains contribute 2100 nm3 to this volume. This value is sufficiently small that it makes a negligible contribution to the micelle volume of the longer rod-like micelle samples. The micelle volumes calculated for all of the micelle samples are collected in Table 1.
000 nm3. The two hemispherical end caps contributed by the corona chains contribute 2100 nm3 to this volume. This value is sufficiently small that it makes a negligible contribution to the micelle volume of the longer rod-like micelle samples. The micelle volumes calculated for all of the micelle samples are collected in Table 1.
| Micelles |
L
n![[thin space (1/6-em)]](https://www.rsc.org/images/entities/char_2009.gif) a (nm) a (nm) |
Absb | μmol of FITC/mg of BCPc | FITC per chaind | Zeta potential (mV) | Core volumee (nm3) | Micelle volumef (nm3) |
|---|---|---|---|---|---|---|---|
a
L
n ± one standard deviation; for the spherical micelles, dn ± one standard deviation.
b FITC calibration curve yields: Abs490 = 0.146 + 101.8c (Fig. S2†).
c Fluorescein molar concentration in the micelles solution was calculated from MWFITC = 389.4 g mol−1. The molar concentration of polymers was calculated based on 1 mg mL−1 micelles in solution.
d
M
nPFS-b-PAPMA-stat-POEGMA = 31k Da, FITC per chain =  .
e Core volume: Vrodc = Ln × π × (Wn/2)2; Vspherec = 4/3π × (dn/2)3.
f
V
rodmic = Vcyl + Vends = Ln × π × RDLS2 + 4/3π × h3; note that Vends = 2100 nm3, and this makes a negligible contribution to Vrodmic for the 4 longest rod micelle samples.
g
V
spheremic = 4/3π × (Rh)3. .
e Core volume: Vrodc = Ln × π × (Wn/2)2; Vspherec = 4/3π × (dn/2)3.
f
V
rodmic = Vcyl + Vends = Ln × π × RDLS2 + 4/3π × h3; note that Vends = 2100 nm3, and this makes a negligible contribution to Vrodmic for the 4 longest rod micelle samples.
g
V
spheremic = 4/3π × (Rh)3.
|
|||||||
| 80 nm Rod | 81 ± 28 | 0.526 | 1.04 × 10⁻² | 0.32 | −22.7 ± 3.5 | 9000 | 52![[thin space (1/6-em)]](https://www.rsc.org/images/entities/char_2009.gif) 000 000 |
| 200 nm Rod | 197 ± 35 | 0.519 | 1.02 × 10⁻² | 0.32 | −19.1 ± 3.2 | 22![[thin space (1/6-em)]](https://www.rsc.org/images/entities/char_2009.gif) 000 000 |
123![[thin space (1/6-em)]](https://www.rsc.org/images/entities/char_2009.gif) 000 000 |
| 500 nm Rod | 497 ± 74 | 0.500 | 0.97 × 10⁻² | 0.30 | −18.2 ± 0.2 | 56![[thin space (1/6-em)]](https://www.rsc.org/images/entities/char_2009.gif) 000 000 |
308![[thin space (1/6-em)]](https://www.rsc.org/images/entities/char_2009.gif) 000 000 |
| 1000 nm Rod | 978 ± 146 | 0.517 | 1.01 × 10⁻² | 0.31 | −22.1 ± 3.0 | 111![[thin space (1/6-em)]](https://www.rsc.org/images/entities/char_2009.gif) 000 000 |
604![[thin space (1/6-em)]](https://www.rsc.org/images/entities/char_2009.gif) 000 000 |
| 2000 nm Rod | 1835 ± 239 | 0.489 | 0.94 × 10⁻² | 0.29 | −13.4 ± 1.1 | 207![[thin space (1/6-em)]](https://www.rsc.org/images/entities/char_2009.gif) 000 000 |
1![[thin space (1/6-em)]](https://www.rsc.org/images/entities/char_2009.gif) 131 131![[thin space (1/6-em)]](https://www.rsc.org/images/entities/char_2009.gif) 000 000 |
| Sphere | 72 ± 11 | 0.505 | 0.98 × 10⁻² | 0.30 | −11.8 ± 3.3 | 195![[thin space (1/6-em)]](https://www.rsc.org/images/entities/char_2009.gif) 000 000 |
293![[thin space (1/6-em)]](https://www.rsc.org/images/entities/char_2009.gif) 000g 000g |
Note that the micelle volume of the 80 nm rod-like micelle is 5.6 times smaller than that of the spherical micelle sample with a similar CONTIN plot. The core volumes (Vc) of this pair of spherical and rod-like micelles differ even more significantly. As shown in Table 1, the core volume of the spherical micelles is 195![[thin space (1/6-em)]](https://www.rsc.org/images/entities/char_2009.gif) 000 nm3, which is almost 22 times that of the 80 nm rod-like micelles with a core volume of 9000 nm3. It is important to recognize that the micelle volume of the short rod-like micelle is very different than its apparent hydrodynamic volume, calculated as (4/3)πRh,app3, even though short rod-like micelles have a small aspect ratio. The apparent hydrodynamic volume as determined at fixed angle by DLS is very similar in magnitude to what one calculates for the volume swept out by end-over-end rotation of a micelle with its corona end cap as depicted in the drawing in Fig. 2b. As this micelle diffuses in solution, rotation occurs around each of the micelle axes.
000 nm3, which is almost 22 times that of the 80 nm rod-like micelles with a core volume of 9000 nm3. It is important to recognize that the micelle volume of the short rod-like micelle is very different than its apparent hydrodynamic volume, calculated as (4/3)πRh,app3, even though short rod-like micelles have a small aspect ratio. The apparent hydrodynamic volume as determined at fixed angle by DLS is very similar in magnitude to what one calculates for the volume swept out by end-over-end rotation of a micelle with its corona end cap as depicted in the drawing in Fig. 2b. As this micelle diffuses in solution, rotation occurs around each of the micelle axes.
Effect of micelle shape and size on cellular uptake
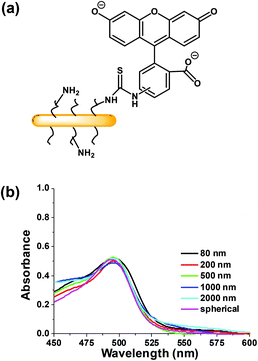
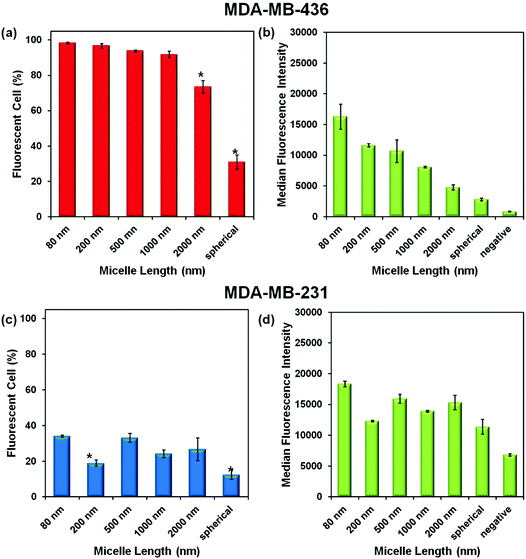
Experiments were carried out with two breast cancer cell lines MDA-MB-436 and MDA-MB-231. In the ESI,† we show that the micelles after attachment of FITC at a concentration of 0.1 mg mL−1 are non-toxic to both cell lines (Fig. S3†). To test cell uptake, monolayers of both cell lines were incubated separately with six different micelle solutions at 0.1 mg mL−1 for 24 h. The unincorporated micelles were removed by washing, and the cells were suspended in PBS buffer for flow cytometry measurement. The efficiency of cellular uptake of the micelles was then expressed quantitatively as the fraction of fluorescent cells, and the data were analyzed by FlowJo® (raw data are shown in the ESI Fig. S4–5 and Tables S1–2†). From the flow cytometry data obtained for both cell lines, shown in Fig. 4, we can conclude that each of the micelle types were taken up by the cells.Comparison of Fig. 4a and c show that a much higher percentage of MDA-MB-436 cells take up NPs of all sizes compared to the MDA-MB-231 cell line. For the MDA-MB-436 cells, a very high fraction (>90%) of the cells take up the 80, 200, 500, and 1000 nm NPs, but the longest rods (2000 nm) and the spherical NPs show statistically significant lower levels of uptake. In contrast, the uptake levels appear to be more scattered with no particular trend relating size and uptake being observable for the MDA-MB-231 cells. The median fluorescence intensity (MFI) levels shown in Fig. 4b and d are also interesting to compare. For the MDA-MB-436 cells, there appears to be a clear decrease in intensity per cell as rod length increases, with the smallest intensity associated with the spherical NPs. In our design, each of the micelles were labeled with one dye molecule for every three corona chains. Thus the number of dye molecules per mass concentration of micelles is constant. Rather different results are seen for the MDA-MB-231 cells. Here, the MFI is much less dependent on micelle size and shape.
These crystalline-core PFS micelle samples have a protein-repellant POEGMA corona and lack a bioaffinity agent that would target a cell surface receptor. Targeting agents play an important role in accelerating cell uptake. For example, the Steinmetz group compared PEGylated rod-like tobacco mosaic virus NPs (TMV-PEG) with similarly sized NPs targeted with RGD peptide sequences on the surface (TMV-RGD) and examined uptake by MBA-MD-231 cells at 37 °C for times up to 3 h. They found very low levels of uptake for the PEGylate virus samples of all three lengths (L = 300, 159, and 59 nm). For the targeted samples however, the uptake rates were 30 to 40 times faster, with a statistically significant increase in uptake for the smallest sample (L = 59 nm) when compared to the two longer NPs.20 Another example comes from the Manners group who examined uptake of their 95 nm long PDHF13-b-PEG227 micelles by HeLa cells, limiting exposure to 1 h. They compared micelles with only PEG on the surface to micelles with a targeting folate group at the end of the PEG. Under their conditions, they observed rapid uptake of the targeted NPs, but negligible uptake of the rod with only PEG (of M = 10![[thin space (1/6-em)]](https://www.rsc.org/images/entities/char_2009.gif) 000 Da) on the surface.21 In our experiments, we carried out 24 h exposure at 37 °C, allowing substantially more time for cell uptake. In the future, we will look more closely at the kinetics and mechanism of cell uptake, the location of the micelles within the cells, and the effect of introducing a targeting ligand at the ends of the POEGMA corona chains.
000 Da) on the surface.21 In our experiments, we carried out 24 h exposure at 37 °C, allowing substantially more time for cell uptake. In the future, we will look more closely at the kinetics and mechanism of cell uptake, the location of the micelles within the cells, and the effect of introducing a targeting ligand at the ends of the POEGMA corona chains.
Penetration of nanorods into multicellular tumor spheroids
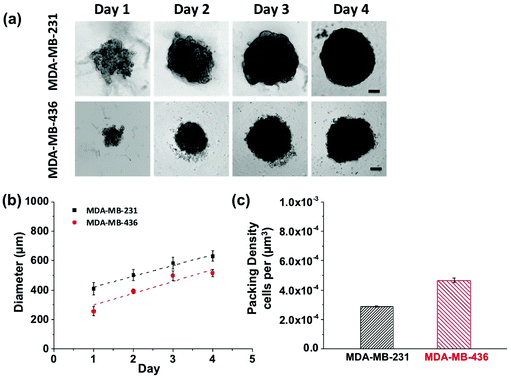
Growth profiles for MDA-MB-231 and MDA-MB-436 MCTSs are shown in Fig. 5. The MCTSs were allowed to grow until they reached an average diameter of about 500 μm (Fig. 5a and b), a size commonly used in penetration studies.29–32 The cells were given sufficient growth time to enable the formation of tight and compact spheroids rather than loosely packed cell aggregates. The cell packing density in the MCTSs was also examined to better characterize the spheroid structure (Fig. 5c). Cells were dissociated from the spheroids and counted to calculate the number of cells per unit volume of spheroid. The MDA-MB-231 spheroids grew rapidly and reached a volume of 1.3 × 108 μm3 at day 4, with a packing density of 2.89 ± 0.03 × 10⁻⁴ cells per μm3. In contrast, MDA-MB-436 spheroids grew slowly to 7.2 × 107 μm3 at day 4, and cells were packed much more densely with a packing density of 4.67 ± 0.17 × 10⁻⁴ cells per μm3.
MCTSs mirror the 3D cellular context and therapeutically relevant gradients of tumors in vivo.33 For these proof-of-concept studies into probing the NP-tumor environment, we considered using MCTS as a good first-step. They mimic well some key aspects of real tumors by having different cell proliferation rates, specific gene expression, deposition of extracellular matrix (ECM), and accurately represent certain cell–cell as well as cell-environment interactions. Larger spheroids, with diameters on the order of 500 μm, experience mass transport limitations that interfere with the diffusion of oxygen, nutrients and metabolic wastes, leading to a layered structure analogous to that observed in solid tumors. The shortage of nutrients and hypoxia in the spheroid core can lead to cell necrosis (just beginning to be visible on day 4 in Fig. 5).34
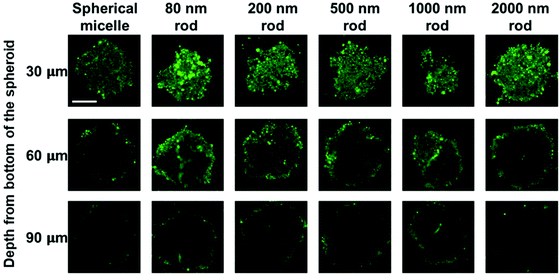
MCTS cross-sections taken at a distance of 30 μm from the spheroid surface show bright fluorescence for all of the micelle samples. At this depth, the fluorescence intensity is strongly influenced by micelles in the region of the spheroid surface. At a depth of 60 μm, there are differences in the fluorescence intensity distribution across the cross section. The greatest intensity within the interior is observed for the 80 nm and 200 nm rod micelles, and the weakest intensity, largely confined to the periphery is seen for the spherical micelles and the 2000 nm rod micelles. The fluorescence intensity is weaker for images taken a depth of 90 μm, and a greater fraction of the intensity is localized near the periphery of the spheroid. Nevertheless, it is clear that the least penetration is seen for the spherical micelles and the longest rod-like micelle sample.
It is a challenge to quantify fluorescence emission at different depths in a 3D object. For example, optical effects attenuate the extent of light penetration. The Allen group has developed a protocol to provide semi-quantitative insights into the extent of penetration at a given depth. As shown in Fig. S6,† the penetration at each depth in the MCTS is assessed by dividing the cross-section into three equally spaced concentric regions (periphery (P), intermediate (I) and central (C)). Each region is then analyzed by ImageJ to measure the fluorescence intensity. While this approach is useful to compare different regions of an image at a given depth, we can take this analysis one step further and use it to compare the extent of penetration of different micelle samples. At each depth, we can compare the fluorescence intensities among micelles of different sizes, because the dye content per unit mass is constant for all of the micelle samples.
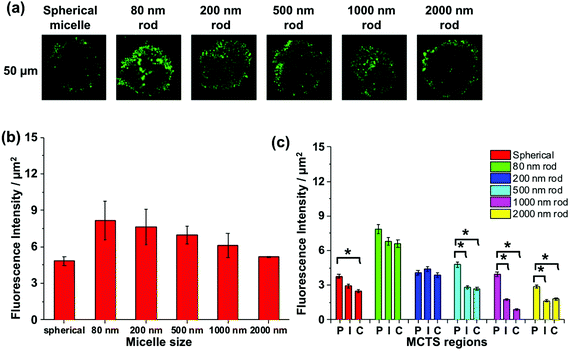
We apply this analysis to a series of confocal images taken at a depth of 50 μm as shown in Fig. 7a. The total fluorescence intensity for each cross section is plotted in Fig. 7b, where we see that the strongest fluorescence signal is from the 80, 200, and 500 nm rod-like micelle samples, and the weakest signal is from the spherical and 2000 nm long micelle samples. Differences among the micelle samples become more apparent when we examine separately the P, I, and C regions of each image. For the 80 and 200 nm rod-like micelles, the emission intensity is relatively uniform across all three regions. For the 500, 1000 and 2000 nm rods, there is a significantly greater (n = 3) extent of fluorescence form the peripheral region, compared to the I and C regions. And for the 500 nm rod micelles, the extent of penetration into the I and C regions is substantially greater than that for the two longer rod micelle samples. Note that the spherical micelles are largely confined to the periphery of the spheroids.
We also applied this analysis to the 18 confocal fluorescence images presented in Fig. 6. These results are presented in Fig. S7 and Table S3.† The main conclusions are that the optical slices taken at a depth of 30 μm are dominated by micelles at the periphery of the spheroid, and at 60 μm and 90 μm, the 80 and 200 nm micelles show the greatest extent of penetration, similar to what we learned from Fig. 7 and the spherical micelles showed the least extent of penetration.
In summary, MDA-MB-436 MCTSs treated with spherical micelles (Rh = 41 nm) showed the lowest fluorescence intensity and the smallest extent of MCTS penetration, whereas those treated with the 80 nm rod-like micelles exhibited the highest overall fluorescence intensity and the greatest extent of penetration into MCTS. Both micelle samples have PFS cores that are much more rigid than the flexible POEGMA corona. The most reasonable explanation for this difference is that the smallest dimension (Wn = 12 nm) of the cylindrical micelle core allowed the micelles to penetrate more easily into the MCTS compared to the spherical micelles with a much larger core (dn = 72 nm). The length of the rod-like micelles also affected their penetration into these MCTSs. Although all five rod-like micelle samples had thin rigid cores with Wn = 12 nm, the micelles with longer length were found to penetrate less into the MCTSs.
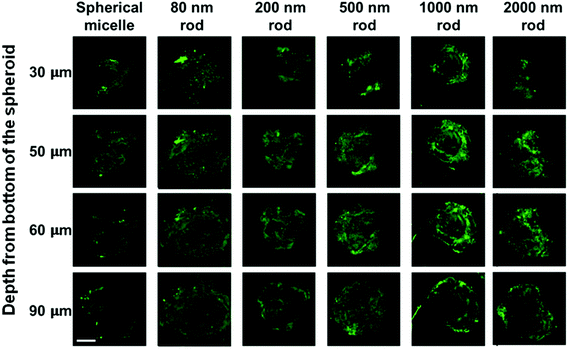
The MDA-MB-231 MCTSs treated with longer rod-like micelles are shown from the third to the sixth columns in Fig. 8. In addition to the 80 nm rod-like micelles, medium length micelles (L = 200 and 500 nm) also penetrated to the 90 μm depth in MDA-MB-231 MCTSs. Experiments with the longest micelles (L = 1000 and 2000 nm) showed little fluorescence intensity detected at the central region of the MCTS cross-sections, indicating a limited penetration at 90 μm depth. The penetration into MDA-MB-231 MCTSs was found to decrease with increasing micelle length, indicating that the transport of micelles in these MCTSs is length dependent.
Interestingly, the same micelle samples always penetrated deeper into MDA-MB-231 MCTS than into MDA-MB-436 MCTS. The formation of MDA-MB-231 MCTS requires assistance from an extracellular matrix (ECM) Geltrex®, a basement membrane product that provides extra physical support for the cultured cells. This cell line has been shown to exhibit very weak cell–cell contact and only yields loosely packed aggregates if seeded without ECM.35 The MCTSs grown from MDA-MB-231 cells appeared as very uniform spheroids with a near perfect spherical shape under the optical microscope, as shown in Fig. 5a. However, when examined by confocal microscopy, optical slices of MCTSs displayed a very heterogeneous distribution of the cells inside the spheroid. In Fig. 8, many optical slices showed irregularly structured spheroid cross-sections and some gaps or holes inside the spheroids caused by the uneven arrangement of cells. These defects in MDA-MB-231 MCTSs created large intercellular spaces for micelles to diffuse and could potentially facilitate micelle penetration. But at the same time, the irregular spheroid cross-sections also made the images very difficult to analyze, and we could only obtain qualitative results with this cell line.
Potential tumor penetration pathways
As models of intermediate complexity, MCTS differ from in vivo tumors in important ways. They lack vasculature, so they are only suitable to model the avascular regions of tumors. Tumours are also much larger and more complex physiologically than spheroids. The vasculature exposes tumors to the immune system and fluid dynamics resulting in layers of added complexity.36,37 Tumors also consist of multiple cell types in vivo (including healthy cells), have draining lymphatics and high interstitial pressures, all which can affect drug delivery.Nevertheless, one of the attractive features of MCTS as a model system is the presence of an ECM network. This matrix contains both structural proteins (collagen, elastin) as well as adhesive proteins (fibronectin, laminin) typically embedded in a gel of glycosaminoglycans and proteoglycans. MCTS therefore can mimic in vitro some physical barriers found in solid tumors that obstruct the penetration of NPs and drug delivery, making them useful models for examining the role of this barrier on entry and penetration of NPs into tumors.
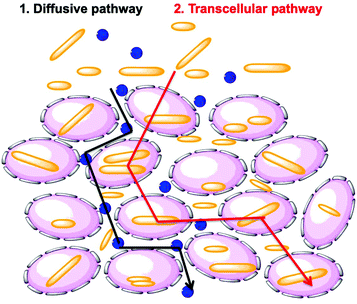
Researchers have hypothesized that there are two global pathways for NPs to penetrate into tumor spheroids, namely the diffusive pathway and the transcellular pathway (Fig. 9).38,39 In the first pathway, NPs diffuse though the intercellular space to reach the tumor core. In the second pathway, NPs must travel through the cells by a transcellular transport process in order to penetrate into the MCTS. Penetration governed by the transcellular pathway is dependent on the internalization rate of the NP, as the NPs have to be taken up by the peripheral cells via endocytosis and then released by exocytosis, with subsequent entry and exit steps through cells inside the tumor.40 These are limiting pathways. Recent experiments have shown that cells themselves can migrate within the MCTS. This may open a pathway in which NP entry and diffusion is coupled to cell migration.41
Bugno et al.42 argued that the interstitial pathway was favored only for very small NPs. They examined the penetration of a series of dye-labeled poly(amidoamine) (PAMAM) dendrimers into MCF-7 spheroids. They compared the G2 (2 nm), G4 (4 nm) and G7 (8 nm) dendrimers with three surface functionalities to give cationic, neutral, and anionic surfaces. Only the cationic dendrimers, after 24 h at 37 °C, were able to penetrate into the spheroids. The G7 dendrimer showed the largest accumulation in the spheroid, largely confined to the periphery, whereas the tiny G2 dendrimer permeated to the core of the spheroid. The authors argued that interaction of the cationic dendrimers with the MCF-7 cells was an essential step in the penetration process. The strongly cationic G7 dendrimer was internalized into the cells, limiting its penetration. Only the G2 dendrimer had a weak enough interaction to pass through the interstitial spaces of the spheroid. This work followed an earlier study by Huang et al.43 who examined penetration into MCF-7 spheroids by a series of gold NPs with diameters of 2, 6 and 15 nm. These NPs were coated with the thiol drug tiopronin, which imparts a negative surface charge. After 24 h exposure, the 2 and 6 nm NPs had penetrated deeply into the spheroid, while the 15 nm NPs were localized in a few cell layers near the surface.
The Stenzel group reported strong evidence for the transcellular pathway with a series of experiments involving 350 μm diameter MCTS formed from an AsPC-1 pancreatic cancer cell line and 30 nm diameter spherical block copolymer micelles consisting of a PMMA core and a poly(N-(2-hydroxypropyl) methacrylamide-co-methacrylic acid) corona that were subsequently cross-linked by reaction with a diamine and labelled with fluorescein.44 The MCTS were incubated with the micelles (75 μg mL−1) for 2 h at 37 °C. Confocal fluorescence microscopy images at a depth of 90 μm from the surface show relatively uniform penetration to a depth of 30 to 40 μm accompanied by a less intense texture of fluorescence that penetrated to the center of the image. The key experiments that were used here to support a transcellular penetration pathway involved treatment of the spheroids with either Filipin to inhibit caveolae-mediated endocytosis or Exo1 to inhibit exocytosis. Both treatments decreased penetration of the micelles into the MCTS. The authors also modeled the penetration of the micelles through the collagen-rich extracellular matrix that makes up the interstitial spaces within the MCTS by constructing 400 μm collagen spheroids from type 1 collagen and showing by confocal microscopy that the micelles penetrated to a smaller extent than in the MCTS.
From a different perspective, the Steinmetz group developed a mathematical model for a diffusive pathway through interstitial spaces for rod-like NPs, modeling TMV nanorods of length L and cross section diameter d.20 The diffusion coefficient for random diffusion of an elongated cylinder is reduced by the presence of proteins, mostly collagen, within the tumor spheroid space. The immobilized cells of cell density ϕ serve as obstacles, further reducing the diffusion rate. The NP concentration in the surrounding medium is high enough that it does not change during the experiment. A key assumption of this model is that uptake of a NP by a cell in the MCTS captures that NP and prevents further penetration into the tumor. The uptake rate is described in terms of a parameter k (NPs/h/cell). As described in the section on cell uptake above, these authors carried out model studies on MBA-MD-231 cells to determine k values for TMV-PEG and TMV-RGD NPs of different aspect ratios. Based on their model and a cell density ϕ = 0.5, they calculate that their TMV-PEG sample with the highest aspect ratio (L/d = 300/18) and a very low rate of cell uptake would penetrate to a depth of about 140 μm over 24 h. These are the results of simulations and need to be tested experimentally.
For the more dense MCTS of MDA-MB-436 cells (4.7 × 10⁻⁴ cells per μm3), we saw in Fig. 7 above that our (L/d = 200/12) nanorod micelles penetrated to a depth of only about 90 μm over 24 h. We note that this cell line was very effective at taking up these nanorod micelles over 24 h at 37 °C. Here too, more experiments are needed to identify the penetration mechanism. In contrast, we observed very deep penetration of this and longer nanorod micelle samples in the less dense MCTS of MDA-MB-231 cells (2.9 × 10⁻⁴ cells per μm3). We also observed a rather open structure by confocal microscopy for these MCTS. These observations make it likely that diffusion through interstitial spaces is the dominant penetration pathway for rod-like FITCPFS27-b-PAPMA3-stat-POEGMA48 micelles into MCTS of MDA-MB-231 cells.
Conclusions
We describe a family of rod-like micelles of defined length and narrow size distribution prepared from a PFS27-b-PAPMA3-stat-POEGMA48 BCP and examined how the shape and size of these micelles affect cellular uptake and MCTS penetration. Using rod-like micelles with lengths ranging from 80 to 2000 nm, we tested the effect of rod length while keeping the surface chemistry constant. These results were compared to those obtained with a spherical micelle sample prepared from the same block copolymer, in which the spherical micelles had a core diameter of 72 nm and a hydrodynamic radius of 41 nm.These BCP micelles were found to be non-toxic to both MDA-MB-231 and MDA-MB-436 cells up to a concentration of 0.1 mg mL−1. However, the results from cellular uptake and tumor penetration were cell line dependent. Experiments on the MDA-MB-436 cell line showed that increasing the length of rod-like micelles reduced their uptake by monolayer cells and penetration into MCTSs. In contrast, no length-dependent uptake or penetration was observed with MDA-MB-231 cells. The MDA-MB-231 cells formed MCTSs that were less dense than those formed by the MDA-MB-436 cells, and had a porous internal structure. The rod-like micelles were able to penetrate deeper into these MCTSs, presumably as a consequence of their porous structure.
The CONTIN plots in Fig. 2d show that the hydrodynamic volume of the spherical micelles and the hydrodynamic volume calculated from the apparent hydrodynamic radius (Rh,app) of the 80 nm rod-like micelle sample are similar. But this result is misleading. A more careful analysis of the micelle volumes that takes into account the rod length and the corona thickness shows that the spherical micelles are much larger in size. An even stronger statement is that the core volumes of these two types of micelle samples are very different. This size effect may play a dominant role in the observation that the rod-like micelles were taken up by MDA-MB-436 cells and penetrated deeper into the MCTSs in comparison to the spherical micelles. The thinner cross-section of the rod-like micelles may be the most important feature of their structure. In order to compare fluorescence intensities of different micelle samples, each was prepared to have a similar dye content per unit mass, and all of these experiments were carried out at constant weight concentration of micelles. Concentration effects on cell and MCTS uptake are important to consider in future experiments. It will also be interesting to introduce targeting moieties onto the surface of the micelles. And, because real tumors are more complex than the in vitro model we examined, it will be important in the future to examine the behavior of these materials in animal models.
The study described here is the first to look at a series of carefully characterized rod-like nanocarriers with common surface chemistry and narrow length distributions. Thus, we consider this PFS-based block copolymer system to provide us with a platform for probing the transport and potential drug delivery behavior of elongated nanocarriers.
Conflicts of interest
There are no conflicts to declare.Acknowledgements
The Toronto authors thank NSERC Canada for their support of this research. The authors also thank the CSB and the Centre for Pharmaceutical Oncology at the University of Toronto for the use of their imaging facilities. IM thanks the Canadian Government for a Canada 150 Research Chair and the University of Bristol for support.References
- D. Peer, J. M. Karp, S. Hong, O. C. Farokhzad, R. Margalit and R. Langer, Nat. Nanotechnol., 2007, 2, 751–760 CrossRef CAS PubMed
.
- O. C. Farokhzad and R. Langer, ACS Nano, 2009, 3, 16–20 CrossRef CAS PubMed
.
- S. Wilhelm, A. J. Tavares, Q. Dai, S. Ohta, J. Audet, H. F. Dvorak and W. C. W. Chan, Nat. Rev. Mater., 2016, 1, 16014 CrossRef CAS
.
- M. A. Bruckman, L. N. Randolph, A. VanMeter, S. Hern, A. J. Shoffstall, R. E. Taurog and N. F. Steinmetz, Virology, 2014, 449, 163–173 CrossRef CAS
.
- K. C. Black, Y. Wang, H. P. Luehmann, X. Cai, W. Xing, B. Pang, Y. Zhao, C. S. Cutler, L. V. Wang, Y. Liu and Y. Xia, ACS Nano, 2014, 8, 4385–4394 CrossRef CAS PubMed
.
- X. Huang, L. Li, T. Liu, N. Hao, H. Liu, D. Chen and F. Tang, ACS Nano, 2011, 5, 5390–5399 CrossRef CAS PubMed
.
- Y. Geng, P. Dalhaimer, S. Cai, R. Tsai, M. Tewari, T. Minko and D. E. Discher, Nat. Nanotechnol., 2007, 2, 249–255 CrossRef CAS PubMed
.
- J. H. Park, G. von Maltzahn, L. Zhang, A. M. Derfus, D. Simberg, T. J. Harris, E. Ruoslahti, S. N. Bhatia and M. J. Sailor, Small, 2009, 5, 694–700 CrossRef CAS PubMed
.
- K. S. Chu, W. Hasan, S. Rawal, M. D. Walsh, E. M. Enlow, J. C. Luft, A. S. Bridges, J. L. Kuijer, M. E. Napier, W. C. Zamboni and J. M. DeSimone, Nanomedicine, 2013, 9, 686–693 CrossRef CAS PubMed
.
- D. A. Christian, S. Cai, O. B. Garbuzenko, T. Harada, A. L. Zajac, T. Minko and D. E. Discher, Mol. Pharm., 2009, 6, 1343–1352 CrossRef CAS PubMed
.
- Z. Zhou, X. Ma, E. Jin, J. Tang, M. Sui, Y. Shen, E. A. Van Kirk, W. J. Murdoch and M. Radosz, Biomaterials, 2013, 34, 5722–5735 CrossRef CAS PubMed
.
- R. Toy, P. M. Peiris, K. B. Ghaghada and E. Karathanasis, Nanomedicine, 2014, 9, 121–134 CrossRef CAS PubMed
.
- A. Banerjee, J. Qi, R. Gogoi, J. Wong and S. Mitragotri, J. Controlled Release, 2016, 238, 176–185 CrossRef CAS PubMed
.
- C. Kinnear, T. L. Moore, L. Rodriguez-Lorenzo, B. Rothen-Rutishauser and A. Petri-Fink, Chem. Rev., 2017, 117, 11476–11521 CrossRef CAS PubMed
.
- W. Poon, B. R. Kingston, B. Ouyang, W. Ngo and W. C. W. Chan, Nat. Nanotechnol., 2020, 15, 819–829 CrossRef CAS PubMed
.
- L. C. Kimlin, G. Casagrande and V. M. Virador, Mol. Carcinog., 2013, 52, 167–182 CrossRef PubMed
.
- J. Zhao, H. Lu, P. Xiao and M. H. Stenzel, ACS Appl. Mater. Interfaces, 2016, 8, 16622–16630 CrossRef CAS PubMed
.
- J. Zhao, H. Lu, Y. Yao, S. Ganda and M. H. Stenzel, J. Mater. Chem. B, 2018, 6, 4223–4231 RSC
.
- S. Shukla, F. J. Eber, A. S. Nagarajan, N. A. DiFranco, N. Schmidt, A. M. Wen, S. Eiben, R. M. Twyman, C. Wege and N. F. Steinmetz, Adv. Healthcare Mater., 2015, 4, 874–882 CrossRef CAS PubMed
.
- P. L. Chariou, K. L. Lee, J. K. Pokorski, G. M. Saidel and N. F. Steinmetz, J. Phys. Chem. B, 2016, 120, 6120–6129 CrossRef CAS PubMed
.
- S. T. G. Street, Y. He, X.-H. Jin, L. Hodgson, P. Verkade and I. Manners, Chem. Sci., 2020, 11, 8394–8408 RSC
.
- Q. Yu, M. G. Roberts, S. Pearce, A. M. Oliver, H. Zhou, C. Allen, I. Manners and M. A. Winnik, Macromolecules, 2019, 52, 5231–5244 CrossRef CAS
.
- R. G. H. Lammertink, M. A. Hempenius, I. Manners and G. J. Vancso, Macromolecules, 1998, 31, 795–800 CrossRef CAS
.
- Y. Zhao, Y. Wang, F. Ran, Y. Cui, C. Liu, Q. Zhao, Y. Gao, D. Wang and S. Wang, Sci. Rep., 2017, 7, 4131 CrossRef PubMed
.
- V. P. Chauhan, Z. Popovic, O. Chen, J. Cui, D. Fukumura, M. G. Bawendi and R. K. Jain, Angew. Chem., Int. Ed., 2011, 50, 11417–11420 CrossRef CAS PubMed
.
- X. Huang, X. Teng, D. Chen, F. Tang and J. He, Biomaterials, 2010, 31, 438–448 CrossRef CAS PubMed
.
- G. Guerin, P. Rupar, G. Molev, I. Manners, H. Jinnai and M. A. Winnik, Macromolecules, 2016, 49, 7004–7014 CrossRef CAS
.
- C. Dubois, R. Dufour, P. Daumar, C. Aubel, C. Szczepaniak, C. Blavignac, E. Mounetou, F. Penault-Llorca and M. Bamdad, Oncotarget, 2017, 8, 95316–95331 CrossRef PubMed
.
- M. Dunne, Y. N. Dou, D. M. Drake, T. Spence, S. M. L. Gontijo, P. G. Wells and C. Allen, J. Controlled Release, 2018, 282, 35–45 CrossRef CAS PubMed
.
- S. Eetezadi, R. De Souza, M. Vythilingam, R. Lessa Cataldi and C. Allen, Mol. Pharm., 2015, 12, 3973–3985 CrossRef CAS PubMed
.
- A. S. Mikhail, S. Eetezadi, S. N. Ekdawi, J. Stewart and C. Allen, Int. J. Pharm., 2014, 464, 168–177 CrossRef CAS PubMed
.
- A. S. Mikhail, S. Eetezadi and C. Allen, PLoS One, 2013, 8, e62630 CrossRef CAS
.
- F. Hirschhaeuser, H. Menne, C. Dittfeld, J. West, W. Mueller-Klieser and L. A. Kunz-Schughart, J. Biotechnol., 2010, 148, 3–15 CrossRef CAS
.
- G. Lazzari, P. Couvreur and S. Mura, Polym. Chem., 2017, 8, 4947–4969 RSC
.
- A. Ivascu and M. Kubbies, J. Biomol. Screening, 2006, 11, 922–932 CrossRef CAS PubMed
.
- S. Breslin and L. O'Driscoll, Drug Discovery Today, 2013, 18, 240–249 CrossRef CAS PubMed
.
- E. Fennema, N. Rivron, J. Rouwkema, C. van Blitterswijk and J. de Boer, Trends Biotechnol., 2013, 31, 108–115 CrossRef CAS
.
- H. Lu and M. H. Stenzel, Small, 2018, 14, e1702858 CrossRef PubMed
.
- B. Kim, G. Han, B. J. Toley, C. K. Kim, V. M. Rotello and N. S. Forbes, Nat. Nanotechnol., 2010, 5, 465–472 CrossRef CAS PubMed
.
- H. Lu, R. H. Utama, U. Kitiyotsawat, K. Babiuch, Y. Jiang and M. H. Stenzel, Biomater. Sci., 2015, 3, 1085–1095 RSC
.
- R. Richards, D. Mason, R. Lévy, R. Bearon and V. Sée, bioRxiv, 2018, 443648, DOI:10.1101/443648
.
- J. Bugno, H. J. Hsu, R. M. Pearson, H. Noh and S. Hong, Mol. Pharm., 2016, 13, 2155–2163 CrossRef CAS PubMed
.
- K. Huang, H. Ma, J. Liu, S. Huo, A. Kumar, T. Wei, X. Zhang, S. Jin, Y. Gan, P. C. Wang, S. He, X. Zhang and X.-J. Liang, ACS Nano, 2012, 6, 4483–4493 CrossRef CAS PubMed
.
- H. Lu, R. H. Utama, U. Kitiyotsawat, K. Babiuch, Y. Jiang and M. H. Stenzel, Biomater. Sci., 2015, 3, 1085–1095 RSC
.
Footnotes |
| † Electronic supplementary information (ESI) available: Experimental details, supporting tables, supporting figures. See DOI: 10.1039/d0nr08076d |
| ‡ These authors worked together on this publication and contributed equally. |
| This journal is © The Royal Society of Chemistry 2021 |

