 Open Access Article
The solid-state physicochemical properties and biogas production of the anaerobic digestion of corn straw pretreated by microwave irradiation
Chao Wangab,
Zhijiang Shaoab,
Ling Qiu *ab,
Wei Haoab,
Qiang Quab and
Guotao Sunabc
aCollege of Mechanical and Electronic Engineering, Northwest A&F University, Yangling, Shaanxi 712100, China. E-mail: QL28710@163.com
bWestern Scientific Observing and Research Station for Development and Utilization of Rural Renewable Energy, Ministry of Agriculture and Rural Affairs, P. R. China
cKey Laboratory of Technologies and Models for Cyclic Utilization from Agricultural Resources, Ministry of Agriculture and Rural Affairs, P. R. China
First published on 18th January 2021
Abstract
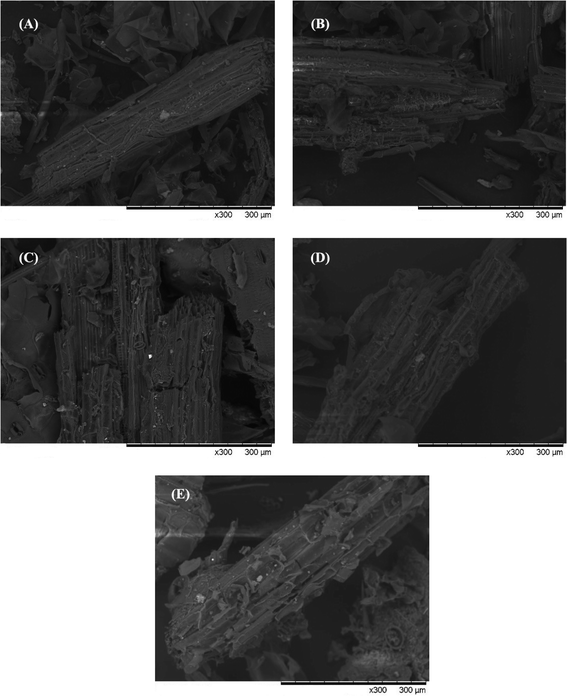
The effect of different temperatures used in microwave pretreatment on enhancing methane production of corn straw was comparatively studied in this paper through the analysis of the physicochemical properties of the pretreated materials and the methane yield during anaerobic digestion. Analytic methods such as scanning electron microscopy, Fourier transform infrared spectroscopy, and X-ray diffraction were performed to detect the surface chemistry of the pretreated corn straw. The results indicated that microwave pretreatment could effectively disrupt the lignocellulosic structure to release cellulose, hemicellulose, and related derivatives and make them available for the process of anaerobic digestion. The outcome of the methanogenic assay demonstrated that methane production could be significantly improved by 73.08% concerning the variation of the temperatures in microwave pretreatment. This study provides technical support for pretreatment methods of lignocellulose materials and deems that microwave pretreatment boosts methane yield efficiently during the process of anaerobic digestion of lignocellulosic materials.
1. Introduction
It is well known that the exorbitant and inappropriate use of fossil resources and the continuing increase in energy security concerns have driven researchers to seek renewable and environmentally friendly energy resources that could play a crucial role in the replacement of fossil fuels.1,2 As a promising means of production for second-generation biofuels from lower-value and abundant substrates such as lignocellulosic materials, there are high hopes resting on biogas to not only mitigate the undesirable impacts of fossil fuels and solve the challenge of replacing them, but also to significantly enhance ecological effects on a global scale.3 Anaerobic digestion technology is one of the most efficient and environmentally friendly approaches to obtain biogas with a rich content of methane produced by lignocellulosic substrates, which will be widely employed to take the place of fossil fuels.4 280 million tons of corn straw (CS), an agricultural residue, are produced in China yearly.5 Due to its high availability, CS is the most abundant biomass energy resource of lignocellulosic waste that can be used as a substrate for bioenergy production via anaerobic digestion.6It is generally accepted that four major steps based on the differences in the microorganism are used to describe the sequential process in the anaerobic digestion of particulate materials and macromolecules, which include hydrolysis, acidogenesis, acetogenesis, and methanogenesis.7 Hydrolytic bacteria decompose complex organic matter into soluble monomers through their secreted extracellular enzymes. Acidogenic and acetogenic bacteria take advantage of monomers to generate acetic acid, hydrogen, and carbon dioxide, which are then used as substrates for methanogenic bacteria to yield biogas.8 On the other hand, hydrolysis is the most critical and rate-limiting of these different steps.9
Typically, CS is mainly composed of cellulose, hemicellulose, and lignin, shaping a complicated organic polymer crystal structure.10 Unlike starch and sucrose, which can be easily broken down into carbohydrates, the lignin and hemicellulose in CS are tightly embedded in the cellulose, resulting in crystallization and lignification, which expresses the low accessibility of cellulose to microorganisms and makes the cell wall more recalcitrant towards hydrolysis in the anaerobic digestion process. Meanwhile, the wax layer on the surface of CS is not beneficial to the adhesion of microorganisms, which leads to it being difficult for the microorganisms to utilize CS to produce biogas. According to a previous report, only a 20% maximum sugar yield, in theory, could be gained from hydrolysis of lignocellulosic biomass without any of the pretreated approaches.11,12 Therefore, appropriate pretreatment methods should be introduced to disrupt the heterogeneous matrix and then partially remove the lignin to increase the specific surface area and porosity of the cellulosic materials, which favors the degradation and conversion of lignocellulose materials.13
As a rule, there are numerous kinds of pretreatment methods that can enhance biogas production from lignocellulosic biomass, which have been classified into several categories: physical (i.e., microwave irradiation, extrusion, and hot water), chemical (i.e., alkaline and acidic), and biological (i.e., a fungal thermophilic microbial consortium) or a combination of two or more of these methods.14,15 Among these technologies, the microwave pretreatment method is an efficient heating treatment which can shorten the processing time and consume less energy because of the thermal and non-thermal effects elicited by the radiation in the presence of water.16 Thermal effects embody the generation of internal heat by radiation due to the local temperature rise, which results in so-called rapid local heating.17 Conversely, non-thermal effects include the oscillation of polar bonds, which further leads to the fracture of bonds and the acceleration of chemical and physical processes.18 Microwave pretreatment can change the biomass structure, increase the specific surface area, and reduce the polymerization crystallinity of lignocellulose. It was reported previously in the literature that the lignin removal rate could reach 6% in microwave pretreatment of 700 W (30 min), which meant that the hydrolysis rate of the enzyme during the anaerobic digestion process was improved.19 Beszédes et al. observed that microwave pretreatment enhances the COD solubilization of dairy-industry and meat-processing sludge. Besides, the total biogas yield considerably improved and the initial lag-phase of anaerobic digestion decreased.20 A 28% increase in methane yield compared with the control group after microwave pretreatment of CS was found by Jackowiak.21 Accordingly, the physicochemical properties of lignocellulosic biomass after pretreatment were analyzed by SEM, FTIR, XRD, etc. Kupryaniuk et al. found that during the degradation process, the selection of appropriate agents could significantly accelerate the degradation of the main structures of lignocellulose through FTIR.22 Similarly, SEM and FTIR results revealed the surface disruption and lignin removal impacts of pretreatment.23 Nevertheless, there are few reports in the literature on the solid-state characteristics of CS pretreated by different microwave temperatures and the biogas production of the pretreated solid-phase as a substrate in anaerobic fermentation.
In this paper, the microwave pretreatment method was introduced for the sake of considerable methane production. The physicochemical properties of CS pretreated at different temperatures of microwave pretreatment and the methane yield produced in the subsequent anaerobic digestion were investigated. Moreover, the optimal temperature was selected by comparing methane yield in the anaerobic fermentation of the CS solid-phase under various temperature of microwave pretreatment, which offers efficient technical support for the pretreatment techniques to enhance anaerobic fermentation from CS.
2. Materials and methods
2.1. Substrate
The CS used in this study was collected from an experimental field of the Northwest Agriculture and Forestry University in Yangling in the Shaanxi Province. After drying at 65 °C to a constant weight, it was milled to pieces in an 18 mesh using a laboratory-scale grinder. The ground CS was sealed in a plastic bag and stored at 4 °C before use. The total solid (TS) content, volatile solid (VS) content, and carbon/nitrogen ratio (C/N) of CS in this paper were 96.15%, 88.26% (based on the dry matter), and 42.35, respectively.The inocula for anaerobic digestion were derived from domestication in the laboratory at 35 °C, a substrate with a TS of 1% (pig manure![[thin space (1/6-em)]](https://www.rsc.org/images/entities/char_2009.gif) :
:![[thin space (1/6-em)]](https://www.rsc.org/images/entities/char_2009.gif) bovine powder = 1
bovine powder = 1![[thin space (1/6-em)]](https://www.rsc.org/images/entities/char_2009.gif) :
:![[thin space (1/6-em)]](https://www.rsc.org/images/entities/char_2009.gif) 1) and 5 g L−1 sodium acetate was added. The domestication was considered to be finished when the daily gas production was lower than 1% of the cumulative gas production. The pH value, TS content, and VS content of the inocula were 7.6, 6.53%, and 3.47% (based on the dry matter), respectively.
1) and 5 g L−1 sodium acetate was added. The domestication was considered to be finished when the daily gas production was lower than 1% of the cumulative gas production. The pH value, TS content, and VS content of the inocula were 7.6, 6.53%, and 3.47% (based on the dry matter), respectively.
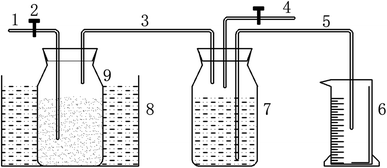
2.2. Experimental setup
![[thin space (1/6-em)]](https://www.rsc.org/images/entities/char_2009.gif) :
:![[thin space (1/6-em)]](https://www.rsc.org/images/entities/char_2009.gif) 10) were thoroughly stirred and then poured into the vessel for microwave heating. The slurry in this vessel started cooling down to ambient temperature after 10 minutes of heating and then the solid and fluid fractions were separated by filtration with a funnel. The pretreated particles were washed repeatedly with deionized water and dried in a constant temperature oven at 105 °C for 24 hours. Then the resultant solid fraction was further subjected to analysis of the physicochemical properties and the anaerobic digestion experiment was carried out.
10) were thoroughly stirred and then poured into the vessel for microwave heating. The slurry in this vessel started cooling down to ambient temperature after 10 minutes of heating and then the solid and fluid fractions were separated by filtration with a funnel. The pretreated particles were washed repeatedly with deionized water and dried in a constant temperature oven at 105 °C for 24 hours. Then the resultant solid fraction was further subjected to analysis of the physicochemical properties and the anaerobic digestion experiment was carried out.2.3. Analysis and calculations
![[thin space (1/6-em)]](https://www.rsc.org/images/entities/char_2009.gif) :
:![[thin space (1/6-em)]](https://www.rsc.org/images/entities/char_2009.gif) 100, which were pressed at approximately 10 MPa pressure to form a uniform 13 mm diameter sample disc for further analysis. The spectra were detected in the wavelength ranging from 4000 cm−1 to 400 cm−1 at the resolution of 0.5 cm−1. The background spectrum of pure potassium bromide was subtracted from the sample spectrum. All the spectra were measured at ambient temperature.29 The crystallinity index (CrI) of the untreated and pretreated CS samples was determined by X-ray diffraction (XRD) analysis (D8 ADVANCE A25; Bruker, Germany) operated at 40 kV and a tube current of 40 mA. Samples were recorded over the range of 2θ = 10–50° at a scan speed of 5° min−1 with a step size of 0.02°. The CrI was calculated according to the following eqn (1)30
100, which were pressed at approximately 10 MPa pressure to form a uniform 13 mm diameter sample disc for further analysis. The spectra were detected in the wavelength ranging from 4000 cm−1 to 400 cm−1 at the resolution of 0.5 cm−1. The background spectrum of pure potassium bromide was subtracted from the sample spectrum. All the spectra were measured at ambient temperature.29 The crystallinity index (CrI) of the untreated and pretreated CS samples was determined by X-ray diffraction (XRD) analysis (D8 ADVANCE A25; Bruker, Germany) operated at 40 kV and a tube current of 40 mA. Samples were recorded over the range of 2θ = 10–50° at a scan speed of 5° min−1 with a step size of 0.02°. The CrI was calculated according to the following eqn (1)30| CrI = [(I002 − Iam)/I002] × 100 | (1) |
D = KL/(β![[thin space (1/6-em)]](https://www.rsc.org/images/entities/char_2009.gif) cos cos![[thin space (1/6-em)]](https://www.rsc.org/images/entities/char_2009.gif) θ) θ)
| (2) |
| Hemicellulose (%) = NDF (%) − ADF (%) | (3) |
| Lignin (%) = ADL (%) | (4) |
| Cellulose (%) = ADF (%) − residue after 72% H2SO4 (%) | (5) |
The modified Gompertzian model34 was employed to fit the cumulative methane yield curves for each pretreatment group during batch anaerobic digestion to obtain the maximum CH4 production potential (P), CH4 production rate (R), and lag phase (λ) as shown in eqn (5)
| M = P × exp{−exp[(R × e)/P × (λ − t) + 1]} | (6) |
All the data in this paper were analyzed by SPSS 22.0, and the corresponding figures were drawn by Origin 2021 for Windows.
3. Result and discussion
3.1. Effects of microwave pretreatment on the chemical properties of corn straw
Table 1 displays the change of the chemical components of lignocellulose before and after pretreatment at different temperatures for CS. An ideal pretreatment method not only makes substrates biodegradable but also retains the maximum available carbohydrates for further production of biofuels.36 It can be seen from Table 1 that the cellulose and hemicellulose contents based on dry matter increased, accompanied by a reduction in lignin content. This is due to the fact that lignin became adjoined to the carbohydrate structures (cellulose and hemicellulose) through certain chemical bonds such as α-ether bonds, phenyl glycosidic bonds, acetal bonds, and ester bonds.37 The remaining cellulose and hemicellulose were released and hydrolyzed into small molecules, which are then available for hydrolytic enzymes to improve the quality of biogas during anaerobic digestion. In contrast to the lignin removal rate of 40.53–81.20%, the percentage of cellulose and hemicellulose removed was 3.48–15.27% and 3.2–70.82% compared with CK, respectively. The maximum cellulose content of 45.44% was obtained in the M210-10 group, this comes at the expense of a lot of cellulose and hemicellulose. Conversely, the M120-10 group retained most of the cellulose and hemicellulose content, but the lignin removal percentage was very low. According to the analysis of the significant difference, all pretreatment groups expressed significant or extremely significant differences. There was an extremely significant difference between the M180-10 group and M210-10 group for components of hemicellulose and cellulose (p < 0.01).
| Temperature | Composition (%) | Removal percentage | ||||
|---|---|---|---|---|---|---|
| Cellulose | Hemicellulose | Lignin | Cellulose | Hemicellulose | Lignin | |
| a Different capital and small letters in the same line show a significant difference in p < 0.01 and p < 0.05, respectively. | ||||||
| CK | 29.57 ± 0.18 | 22.15 ± 0.99 | 13.73 ± 3.20 | — | — | — |
| M120-10 | 37.71 ± 0.46C | 28.33 ± 0.34Aa | 10.79 ± 2.13Aa | 3.48 ± 0.13 | 3.20 ± 0.04 | 40.53 ± 0.18 |
| M150-10 | 38.07 ± 0.32C | 26.79 ± 0.97Ab | 7.69 ± 2.00Ab | 6.20 ± 0.01 | 11.87 ± 0.05 | 59.19 ± 0.14 |
| M180-10 | 41.03 ± 0.29B | 16.59 ± 0.92B | 6.84 ± 0.00Abc | 11.23 ± 0.01 | 49.61 ± 0.04 | 66.48 ± 0.08 |
| M210-10 | 45.44 ± 0.56A | 11.72 ± 0.67C | 4.68 ± 0.62Ac | 15.27 ± 0.01 | 70.82 ± 0.01 | 81.20 ± 0.05 |
All in all, this pretreatment method has satisfied the requirement to remove lignin and preserve cellulose and hemicellulose and can be proposed as a promising method for pretreatment in the anaerobic digestion process.
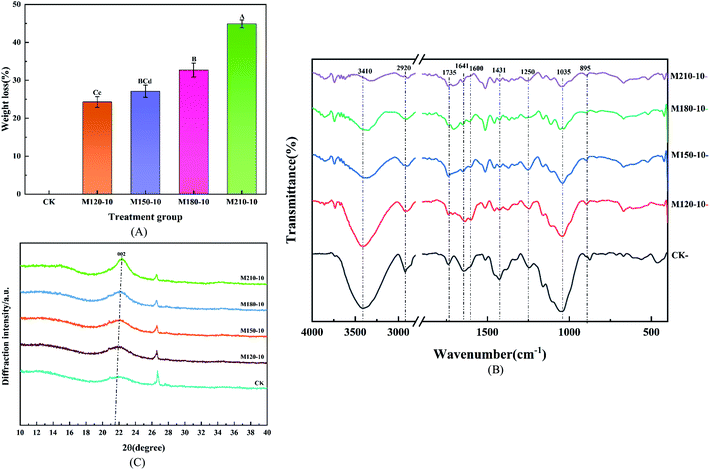
![[double bond, length as m-dash]](https://www.rsc.org/images/entities/char_e001.gif) O stretching vibration, which belonged to the ester functional groups with the function of linking celluloses and hemicelluloses related to carboxylic compounds and ketones.43 This feature was easy to observe in raw CS, but it gradually vanished in all the pretreated samples, which proved that the removal of a large portion of lignin was ascribed to the destruction of the carbonyl. The intensity of the vibrations at 1641 cm−1 and 1600 cm−1 is ascribed to C
O stretching vibration, which belonged to the ester functional groups with the function of linking celluloses and hemicelluloses related to carboxylic compounds and ketones.43 This feature was easy to observe in raw CS, but it gradually vanished in all the pretreated samples, which proved that the removal of a large portion of lignin was ascribed to the destruction of the carbonyl. The intensity of the vibrations at 1641 cm−1 and 1600 cm−1 is ascribed to C![[double bond, length as m-dash]](https://www.rsc.org/images/entities/char_e001.gif) C stretching of the aromatic ring and the C
C stretching of the aromatic ring and the C![[double bond, length as m-dash]](https://www.rsc.org/images/entities/char_e001.gif) C aromatic skeleton vibration from lignin. The intensity decreased at different levels among those samples after microwave pretreatment. Similarly, the intensity at 1431 cm−1 could be detected in treated samples, which also implied the effective removal of lignin. The intensity of the vibration at 1250 cm−1, representing the C–O–C stretching vibration, appeared evidently in raw samples and correspondingly decreased as pretreatment temperature increased, which corroborated the removal of lignin. However, the intensity of the vibration at 1035 cm−1 is representative of the C–O stretching vibration in cellulose and hemicellulose. The intensity was slowly reduced, which implied that the contents of cellulose and hemicellulose were degraded by microwave pretreatment. There was no significant difference to observe in the intensity of the peak at 895 cm−1 which represents the C–H bending vibration in the plane of cellulose.
C aromatic skeleton vibration from lignin. The intensity decreased at different levels among those samples after microwave pretreatment. Similarly, the intensity at 1431 cm−1 could be detected in treated samples, which also implied the effective removal of lignin. The intensity of the vibration at 1250 cm−1, representing the C–O–C stretching vibration, appeared evidently in raw samples and correspondingly decreased as pretreatment temperature increased, which corroborated the removal of lignin. However, the intensity of the vibration at 1035 cm−1 is representative of the C–O stretching vibration in cellulose and hemicellulose. The intensity was slowly reduced, which implied that the contents of cellulose and hemicellulose were degraded by microwave pretreatment. There was no significant difference to observe in the intensity of the peak at 895 cm−1 which represents the C–H bending vibration in the plane of cellulose.
| Number | Wavenumber (cm−1) | Functional group | Assignment |
|---|---|---|---|
| 1 | 3410 | –OH stretching vibration | — |
| 2 | 2920 | –CH and –CH2 up stretching vibration | Cellulose |
| 3 | 1735 | C![[double bond, length as m-dash]](https://www.rsc.org/images/entities/char_e001.gif) O asymmetric bending vibration of xylan O asymmetric bending vibration of xylan |
Hemicellulose and lignin |
| 4 | 1641 | C![[double bond, length as m-dash]](https://www.rsc.org/images/entities/char_e001.gif) C stretching vibration of the aromatic ring C stretching vibration of the aromatic ring |
Lignin |
| 5 | 1600 | C![[double bond, length as m-dash]](https://www.rsc.org/images/entities/char_e001.gif) C vibrating of the aromatic skeleton C vibrating of the aromatic skeleton |
Lignin |
| 6 | 1431 | –CH2 bending vibration | Lignin |
| 7 | 1250 | C–O–C stretching vibration | Lignin |
| 8 | 1035 | C–O stretching vibration | Cellulose and hemicellulose |
| 9 | 895 | –CH bending vibration in the plane | Cellulose |
Besides, the lateral order index (LOI) based on the absorbance ratios at wavenumbers 1431 cm−1 and 900 cm−1 was used to semi-quantitatively analyze the changes in the physicochemical character of lignocellulosic biomass after pretreatment. The LOI values of the 5 experimental groups were 4.78, 1.82, 1.70, 2.17, and 1.89, respectively, whereas they significantly decreased after microwave pretreatment, which indicated that the highly ordered cellulosic network was transformed into a more amorphous state.44
Table 3 lists all the CrI results of all the samples. The CrI values of the pretreatment groups M120-10, M150-10, M180-10, and M210-10 were 30.17%, 27.59%, 36.01% and 43.25%, respectively, which implied a 17–83.42% increase compared with 23.58% of the untreated samples. The maximum CrI value of the M210-10 group was 43.25% which is 1.83 times as much as the CK group. The increasing CrI values indicated an increase in cellulose content, which confirmed the similar development observed in the chemical composition of CS. The phenomenon whereby the crystallinity index of the raw materials was improved by pretreatment has also been reported previously in the literature.46 This is because the reduction of lignin cladding exposes the complete crystal structure of the defective crystal region, which makes the crystal region clearer and thus increases the crystallinity index. Furthermore, the decrease of diffraction intensity in the amorphous region and the increase of diffraction intensity in the crystalline region may also be attributed to the recrystallization in the cellulose crystalline region.47 Table 3 also shows the crystallite size and the position of the 002 planes in the CS after microwave pretreatment. As can be seen from Table 3, the position of the 002 plane microcrystal in cellulose remained unchanged, but the size (D) of the vertical 002 plane microcrystal increased, which indicated that microwave pretreatment did not change the original crystal shape of cellulose, but only affected the microcrystalline size. Therefore, the X-ray diffraction analysis also confirmed the partial removal of amorphous structures such as hemicellulose and lignin via microwave pretreatment.
| Treatment | CrI (%) | 2θ (°) | β (°) | D (nm) |
|---|---|---|---|---|
| CK | 23.58 | 21.71 | 2.94 | 2.74 |
| M120-10 | 30.17 | 21.83 | 2.14 | 3.76 |
| M150-10 | 27.59 | 22.02 | 1.98 | 4.06 |
| M180-10 | 36.01 | 21.83 | 2.47 | 3.27 |
| M210-10 | 43.25 | 22.39 | 1.51 | 5.35 |
3.2. Effect of microwave pretreatment on anaerobic digestibility
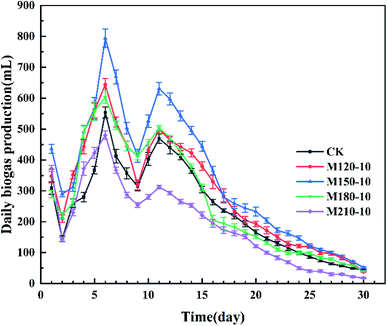 | ||
| Fig. 4 Daily biogas production from untreated and microwave pretreated corn straw under diverse temperatures. | ||
Finally, one-way ANOVA showed that there were extremely significant differences among all the experimental groups except for the significant differences among the CK, M180-10, and M120-10 groups for the maximum production of daily biogas.
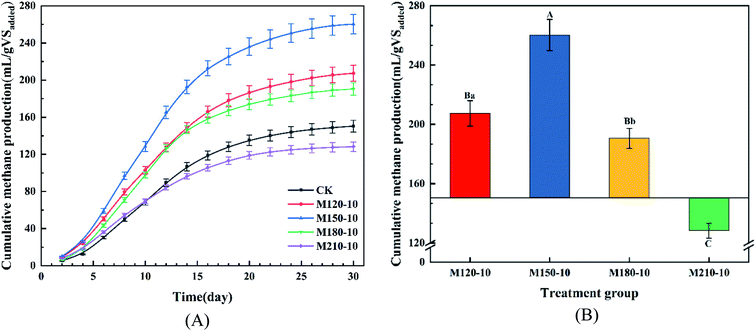 | ||
| Fig. 5 The yield of cumulative methane production (A) and total methane production (B) from untreated and microwave pretreated corn straw with various temperatures. | ||
There was an extremely significant difference (p < 0.01) between the M150-10 group and other groups determined through the analysis of significant difference, while the M180-10 group and M120-10 group showed a significant difference (p < 0.05). It was concluded that microwave pretreatment could enhance the cumulative methane yield from the anaerobic digestion of CS. Additionally, the degree of improvement was closely related to the temperature of microwave pretreatment.
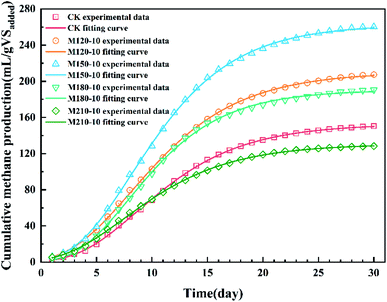 | ||
| Fig. 6 Curve fitting of the Gompertz model to the methane production data of corn straw before and after microwave pretreatment under different temperatures. | ||
| Parameter | CK | M120-10 | M150-10 | M180-10 | M210-10 |
|---|---|---|---|---|---|
| P (mL per gVSadded) | 152.78 | 210.25 | 262.78 | 190.32 | 130.61 |
| R (mL per gVSadded per d) | 10.51 | 14.02 | 18.83 | 14.84 | 8.90 |
| λ (day) | 3.33 | 2.56 | 2.99 | 3.22 | 2.06 |
| Adj-R2 | 0.999 | 0.999 | 0.999 | 0.999 | 0.999 |
| RMSE (%) | 0.862 | 1.28 | 1.75 | 1.59 | 0.786 |
4. Conclusions
Microwave pretreatment in a certain temperature range was beneficial to the decomposition of the lignocellulose structure, improving coarseness and defibrillation in the surface morphology, reducing the mass fraction of lignin, and increasing cellulose and hemicellulose contents. Besides, the specific degradation of the chemical composition of corn straw was detected at marker bands in the performed FTIR studies. An augmentation of the cellulose crystallinity and crystallite size for corn straw was observed in the XRD studies. The above analysis showed that microwave pretreatment enhanced the degradation degree of corn straw, which was beneficial to boosting utilization during anaerobic digestion. By comparing it to the CK group, the best results based on the methanogenic tests were obtained in the M150-10 group for a methane production yield with a 73.08% improvement. The values of λ from the fitting parameters in the modified Gompertz equation were reduced, which also helped to prove that microwave pretreatment is an effective way of improving the efficiency of the anaerobic digestion of biomass.Conflicts of interest
There are no conflicts to declare.Acknowledgements
This research was supported by the Open Project (2020) founded by the Western Scientific Observing and Research Station for Development and Utilization of Rural Renewable Energy, Ministry of Agriculture and Rural Affairs, P. R. China (XBZ2020-01 and XBZ2020-02), the Open Project (2017) Key Laboratory of Technologies and Models for Cyclic Utilization from Agricultural Resources, Ministry of Agriculture and Rural Affairs, P. R. China and the Post-doctoral Foundation of the Shaanxi Province.References
- S. A. Jambo, R. Abdulla, S. H. Mohd Azhar, H. Marbawi, J. A. Gansau and P. Ravindra, Renewable Sustainable Energy Rev., 2016, 65, 756–769 CrossRef CAS.
- B. Sen, Y.-P. Chou, S.-Y. Wu and C.-M. Liu, Int. J. Hydrogen Energy, 2016, 41, 4421–4428 CrossRef CAS.
- D. S. Ganesh, Afr. J. Biotechnol., 2012, 11(5), 1002–1013 Search PubMed.
- W. M. Budzianowski, Renewable Sustainable Energy Rev., 2016, 54, 1148–1171 CrossRef.
- X. Wang, S. Cheng, Z. Li, Y. Men and J. Wu, Sustainability, 2020, 12, 5453 CrossRef CAS.
- K. Li, R. Liu and C. Sun, Renewable Sustainable Energy Rev., 2016, 54, 857–865 CrossRef CAS.
- Y. Wu, S. Wang, D. Liang and N. Li, Bioresour. Technol., 2020, 298, 122403 CrossRef CAS.
- R. Chandra, H. Takeuchi and T. Hasegawa, Renewable Sustainable Energy Rev., 2012, 16, 1462–1476 CrossRef CAS.
- M. Elsayed, E. F. Abomohra, P. Ai, K. Jin, Q. Fan and Y. Zhang, Energy Convers. Manage., 2019, 195, 447–456 CrossRef CAS.
- C. Sawatdeenarunat, K. C. Surendra, D. Takara, H. Oechsner and S. K. Khanal, Bioresour. Technol., 2015, 178, 178–186 CrossRef CAS.
- L. Zhao, G. L. Cao, A. J. Wang, H. Y. Ren, D. Dong, Z. N. Liu, X. Y. Guan, C. J. Xu and N. Q. Ren, Bioresour. Technol., 2012, 114, 365–369 CrossRef CAS.
- L. Dong, G. Cao, J. Wu, B. Liu, D. Xing, L. Zhao, C. Zhou, L. Feng and N. Ren, Bioresour. Technol., 2019, 287, 121399 CrossRef CAS.
- D. N. Barman, M. A. Haque, T. H. Kang, G. H. Kim, T. Y. Kim, K. K. Min and D. Y. Han, Environ. Technol., 2014, 35, 232–241 CrossRef.
- S. Croce, Q. Wei, G. D'Imporzano, R. Dong and F. Adani, Biotechnol. Adv., 2016, 34, 1289–1304 CrossRef CAS.
- Q. Yu, R. Liu, K. Li and R. Ma, Renewable Sustainable Energy Rev., 2019, 107, 51–58 CrossRef CAS.
- A. Bichot, M. Lerosty, M. Radoiu, V. Mechin and D. Garcia-Bernet, Energy Convers. Manage., 2020, 203, 112220 CrossRef CAS.
- X. Kan, J. Zhang, Y. W. Tong and C. H. Wang, Energy Convers. Manage., 2018, 158, 315–326 CrossRef CAS.
- L. Peng, L. Appels and H. Su, J. Environ. Manage., 2018, 213, 271–278 CrossRef CAS.
- J. Kainthola, A. S. Kalamdhad and V. V. Goud, Process Biochem., 2019, 84, 81–90 CrossRef CAS.
- B. Sándor, L. Zsuzsanna, K. Szabolcs, S. G. György and H. Cecilia, Hung. Agric. Eng., 2008, 21, 27–29 Search PubMed.
- D. Jackowiak, D. Bassard, A. Pauss and T. Ribeiro, Bioresour. Technol., 2011, 102, 6750–6756 CrossRef CAS.
- K. Kupryaniuk, T. Oniszczuk, M. Combrzynski, W. Czekala and A. Matwijczuk, Materials, 2020, 13, 3003 CrossRef CAS.
- F. Yilmaz, E. K. Unsar and N. A. Perendeci, Waste Biomass Valorization, 2019, 10, 3071–3087 CrossRef CAS.
- Y. Deng, L. Qiu, Y. Yao and M. Qin, RSC Adv., 2018, 8, 22643–22651 RSC.
- C. Sun, W. Cao, C. J. Banks, S. Heaven and R. Liu, Bioresour. Technol., 2016, 218, 1215–1223 CrossRef CAS.
- L. Dong, G. Cao, L. Zhao, B. Liu and N. Ren, Bioresour. Technol., 2018, 267, 71–76 CrossRef CAS.
- W. Cao, C. Sun, X. Li, J. Qiu and R. Liu, RSC Adv., 2017, 7, 5701–5707 RSC.
- A. M. Mustafa, H. Li, A. A. Radwan, K. Sheng and X. Chen, Bioresour. Technol., 2018, 259, 54–60 CrossRef CAS.
- Y. Gu, Y. Zhang and X. Zhou, Bioresour. Technol., 2015, 196, 116–122 CrossRef CAS.
- T. Liu, X. Zhou, Z. Li, X. Wang and J. Sun, Bioresour. Technol., 2019, 280, 345–351 CrossRef CAS.
- S. Kim and M. T. Holtzapple, Bioresour. Technol., 2006, 97, 583–591 CrossRef CAS.
- X. Liu, S. M. Zicari, G. Liu, Y. Li and R. Zhang, Bioresour. Technol., 2015, 185, 150–157 CrossRef CAS.
- A. Nowicka, M. Zielinski, M. Debowski, M. Dudek and P. Rusanowska, Biomass Bioenergy, 2019, 126, 174–180 CrossRef CAS.
- H. Wang, Z. Li, X. Zhou, X. Wang and S. Zuo, Water, 2020, 12, 2556 CrossRef.
- M. Watanabe, H. Inomata, M. Osada, T. Sato, T. Adschiri and K. Arai, Fuel, 2003, 82, 545–552 CrossRef CAS.
- H. Lou, Q. Hu, X. Qiu, X. Li and X. Lin, BioEnergy Res., 2015, 9, 335–343 CrossRef.
- A. T. Hendriks and G. Zeeman, Bioresour. Technol., 2009, 100, 10–18 CrossRef CAS.
- K. Kaur and U. G. Phutela, Renewable Energy, 2016, 92, 178–184 CrossRef CAS.
- D. N. Barman, M. A. Haque, M. M. Hossain, S. K. Paul and H. D. Yun, Waste Biomass Valorization, 2020, 11, 1755–1764 CrossRef CAS.
- N. Poornejad, K. Karimi and T. Behzad, J. Biomass Biofuel, 2014, 1, 8–15 Search PubMed.
- T. Raj, M. Kapoor, R. Gaur, J. Christopher, B. Lamba, D. K. Tuli and R. Kumar, Energy Fuels, 2015, 29, 3111–3118 CrossRef CAS.
- M. Taherdanak and H. Zilouei, Fuel, 2014, 115, 714–719 CrossRef CAS.
- J. A. Heredia-Guerrero, J. J. Benitez, E. Dominguez, I. S. Bayer, R. Cingolani, A. Athanassiou and A. Heredia, Front. Plant Sci., 2014, 5, 305 Search PubMed.
- S. Sarbishei, A. Goshadrou and M. S. Hatamipour, Biomass Convers. Biorefin., 2020, In press Search PubMed.
- T. Jeoh, C. I. Ishizawa, M. F. Davis, M. E. Himmel, W. S. Adney and D. K. Johnson, Biotechnol. Bioeng., 2007, 98, 112–122 CrossRef CAS.
- W. Zhang, N. Sathitsuksanoh, J. R. Barone and S. Renneckar, Bioresour. Technol., 2016, 199, 148–154 CrossRef CAS.
- S. Wang, G. Dai, B. Ru, Y. Zhao, X. Wang, G. Xiao and Z. Luo, Energy, 2017, 120, 864–871 CrossRef CAS.
- B. Deepanraj, V. Sivasubramanian and S. Jayaraj, Ecotoxicol. Environ. Saf., 2015, 121, 100–104 CrossRef CAS.
- J. Kainthola, A. S. Kalamdhad, V. V. Goud and R. Goel, Bioresour. Technol., 2019, 286, 121368 CrossRef CAS.
| This journal is © The Royal Society of Chemistry 2021 |

