 Open Access Article
Creative Commons Attribution 3.0 Unported Licence
Unravelling the alkali transport properties in nanocrystalline A3OX (A = Li, Na, X = Cl, Br) solid state electrolytes. A theoretical prediction
Long Van Duong ab,
Minh Tho Nguyen
 c and
Yohandys A. Zulueta
 *d
*d
aLaboratory for Computational Molecular and Materials Sciences, Science and Technology Advanced Institute, Van Lang University, Ho Chi Minh City, Vietnam. E-mail: duongvanlong@vlu.edu.vn
bFaculty of Applied Technology, School of Engineering and Technology, Van Lang University, Ho Chi Minh City, Vietnam
cInstitute for Computational Science and Technology (ICST), Ho Chi Minh City, Vietnam
dDepartamento de Física, Facultad de Ciencias Naturales y Exactas, Universidad de Oriente, Santiago de Cuba, CP- 90500, Cuba. E-mail: yzulueta@uo.edu.cu
First published on 11th July 2022
Abstract
Transport properties of the halogeno-alkali oxides A3OX (A = Li, Na, X = Cl, Br) nanocrystalline samples with the presence of ∑3(111) grain boundaries were computed using large-scale molecular dynamic simulations. Results on the diffusion/conduction process show that these nanocrystalline samples are characterized with higher activation energies as compared to previous theoretical studies, but closer to experiment. Such a performance can be attributed to the larger atomic density at the ∑3(111) grain boundary regions within the nanocrystals. Despite a minor deterioration of transport properties of the mixed cation Li2NaOX and Na2LiOX samples, these halogeno-alkali oxides can also be considered as good inorganic solid electrolytes in both Li- and Na-ion batteries.
1. Introduction
The search for affordable inorganic electrolytes for future all solid state alkali-ion batteries is one of the current hot topics due to the urgent need for high energy density materials and relevant safety issues.1–5 Exploration and prediction of the properties of electrolytes are crucial for the improvement of performance and durability of the battery.1–7 Of particular interest, the development of inorganic solid electrolyte faces critical issues, such as the lower electrical conductivity as compared to conventional liquid electrolytes, interfacial resistance with the electrodes, narrow electrochemical window that constrain its practical applications.4–7Of the compounds with special interest for inorganic solid electrolyte, the Li-rich anti-perovskite Li3OX (X = Cl−, Br−) has attracted large scientific interest due to the high Li ionic conductivity (≈1 mS cm−1) and stability with the electrode, and low Li activation energy (≈0.2 eV).8–12 Nevertheless, a higher activation energy (≈0.6 eV) and a lower ionic conductivity for Li3OX have recently been reported experimentally.12–14 Further studies concerning the composition screening of Li and Na anti-perovskite structure were performed disclosing the defect chemistry and ionic transport in pristine, Li3OCl1−yBry and Li3−xNaxOCl1−yBry compositions.15–18 For instance, in mixed anionic samples the Cl/Br mixing have small contribution to the conducting properties as compared to the pristine samples, but this doping strategies can be used for fine tuning the transport properties in such anti-perovskite structures.16
Dawson et al.15 reported the ionic transport at stable grain boundaries of Li3OCl as a model polycrystalline electrolyte. These authors predicted high concentrations of grain boundaries and disclosed that the Li-ion conductivity is lower through the grain boundaries with higher activation energies for Li-ion conduction than that of the bulk crystal, thereby confirming the high grain boundary resistance in this material.15,17 The vast contribution of the grain boundary to the overall conducting properties of Na3OBr and Li3OCl was reported,12,15 and further confirmed by theoretical studies taking the grain boundaries into account.15,17,19
In a solid polycrystal, a grain boundary is a planar defect dividing two grains with different crystallographic orientation. According to the coincidence lattice site theory, two independent grains are tilted by an angle until the individual surface plane coincides, resulting in the desired grain boundary ∑(a,b,c) where ∑ denotes the coincidence index and (a,b,c) the grain boundary plane.15,17 Despite earlier studies concerning the transport properties of individual grain boundaries and bulk A3OX materials,15,17 the explicit influence of the grain boundaries in polycrystalline samples has not been reported yet. Besides, the ∑3 grain boundary type has the lowest segregation energy in compounds such as inverted perovskite structures.15,19 The ∑3 grain boundary type is thus expected to appear with high density in real nanocrystalline samples due to their low energy, but the role of this grain boundary remains almost unexplored.
Motivated by the above considerations, we set out to investigate in the present study the influence of the ∑3(111) grain boundary type on the transport properties in A3OX (A = Li+, Na+, X = Cl−, Br−) by using large-scale molecular dynamics computations. Alkali diffusion in nanocrystalline A3OX samples, which is of vital importance for understanding of the role of grain boundary, is investigated. This study also includes the case of intercalated samples such as Li2NaOX and Na2LiOX with the aim to elucidate their capabilities as inorganic solid electrolytes for future Li and Na solid state batteries. The main difference of the present results with respect to the previous studies consists in that we are disclosing the Li and Na transport properties of pristine A3OX and Li2NaOX and Na2LiOX nanocrystals, with the presence of the ∑3(111) grain boundaries, to simulate the insertion/disinsertion process in the polycrystalline A3OX solid state electrolytes.
2. Computational protocols
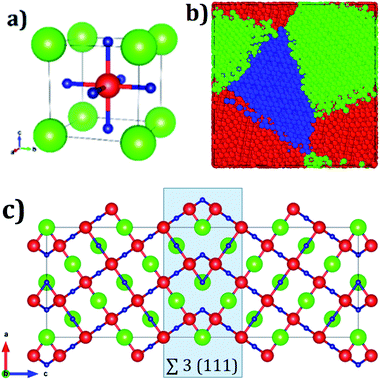
Fig. 1a displays the conventional representation of the A3OX (A = Li+, Na+, X = Cl−, Br−). In this particular anti-perovskite structure with space group Pm-3m No. 221, the body center is occupied by oxygen, whereas the eight vertexes by the X− anions and the six face centers are occupied by the A+ alkali ions.15,17,18 The lattice parameters a for Li3OBr and Na3OBr are 3.981 and 4.541 Å, respectively, whereas values for Li3OBr and Na3OBr amount to 3.991 and 4.613 Å, respectively.15,17–20 Following the coincidence site theory, the symmetric tilt ∑3(111) grain boundary,15,19 depicted in Fig. 1c, is construed from the A3OX (A = Li+, Na+, X = Cl−, Br− in an ionic form) lattice structures.Nanocrystalline A3OX samples are constructed employing the Voronoi tessellation method implemented in the Atoms code.21 In this method, samples with three grains with average grain volume of 17.20 nm3 are built by filling in a cubic box with randomly distributing seeds. We use the ∑3(111) grain boundary as the seed for generating the samples, considering the fact that the resulting nanocrystals are constituted by three grains connected with a ∑3(111) grain boundary.
The simulation cubic box has a size of 80 × 80 × 80 Å3, containing 42![[thin space (1/6-em)]](https://www.rsc.org/images/entities/char_2009.gif) 945 atoms with ionic compositions of 25
945 atoms with ionic compositions of 25![[thin space (1/6-em)]](https://www.rsc.org/images/entities/char_2009.gif) 780 A+, 8615 O2− and 8550 X−. In order to eliminate free surface effects, the periodic boundary conditions are imposed in all directions. Therefore, the overlapped atoms within 1.5 Å distances are separated in 0.2 Å and double atoms are deleted to eliminate the initial unwanted artificial defects which may arise from the tessellation process. The extra net charge introduced by the tessellation process is compensated by the A+ and X− vacancies generated randomly. Inclusion of A+ and X− vacancies is in line with the predicted alkali halide partial Schottky defects, leading to an A+ vacancy migration mechanism, which is the most favorable scheme with low formation energy.11,16 These pair defects can be expressed according to Kröger–Vink notation by eqn (1):
780 A+, 8615 O2− and 8550 X−. In order to eliminate free surface effects, the periodic boundary conditions are imposed in all directions. Therefore, the overlapped atoms within 1.5 Å distances are separated in 0.2 Å and double atoms are deleted to eliminate the initial unwanted artificial defects which may arise from the tessellation process. The extra net charge introduced by the tessellation process is compensated by the A+ and X− vacancies generated randomly. Inclusion of A+ and X− vacancies is in line with the predicted alkali halide partial Schottky defects, leading to an A+ vacancy migration mechanism, which is the most favorable scheme with low formation energy.11,16 These pair defects can be expressed according to Kröger–Vink notation by eqn (1):
 | (1) |
 and
and  denote the A+ and X− ion in their lattice position, whereas
  and
and  represent a A+ and X− vacancy, respectively, and AX the alkali halide. In eqn (1), for each A-vacancy, one X-vacancy is generated for charge compensation resulting in a stoichiometric A3−yOX1−y formula. As mentioned above, eqn (1) is used during the construction of the simulation boxes, resulting in a representative defect concentration of y = 0.118. Note that the nanocrystalline A3OX structures inherently exhibit a conduction mechanism via an alkali vacancy (
 ) as described in eqn (1).
The resulting polycrystalline samples A3OX with A = Li+, Na+, X = Cl−, Br− are depicted in Fig. 1b. For large-scale molecular dynamics simulations (MD) the LAMMPS code is used to determine the Li+ and Na+ diffusion data of nanocrystalline A3OX as each can be split in terms of ions A = Li+, Na+ and X = Cl−, Br− samples.22 The potential parameters reported in ref. 16 are adopted to model the particle interactions. These potential parameters consider the pure electrostatic interactions for long-range together with a Buckingham-type potential for the short–range pair ion interactions. Further details concerning the potential parameters can be found in ref. 16. In addition, formal valence charge is used for all the species in each nanocrystal. The simulations are performed in a temperature (T) range of 500–1200 K each step of 100 K. The simulation boxes are first relaxed using an isothermal-isobaric ensemble (NTP) for reaching the thermodynamic equilibrium; the production runs are carried out with an isothermal-isochoric ensemble (NVT) recording the mean square displacement (MSD) for the A+ ions. The diffusion coefficients (D) are obtained from the MSD plots by eqn (2):
| MSD = 6Dt | (2) |
The ionic conductivity or direct current conductivity (σDC) can be obtained employing the Nernst–Einstein formulation (3):
| σ(T) = HVNq2D(T)/kBT | (3) |
| D(T) = D0 exp(−Ea/kBT); σ(T) = σ0 exp(−Ea/kBT) | (4) |
3. Results and discussion
3.1 Alkali ion migration in A3OX (A = Li+, Na+, X = Cl−, Br−) nanocrystals
The temporal evolution of the MSD values of each A3OX nanocrystal is illustrated in Fig. 2. In all cases, the MSD dependence is clearly linear, and the slope increases upon increasing temperature, indicating a long-range alkali atom migration within the respective nanocrystalline structure. It is noteworthy that the Li3OX samples have higher values of MSDs as compared with Na3OX counterparts. Therefore, the order of MSDs in Li3OCl is similar to that for Li3OBr. On the contrary, a difference of the first-order of MSDs is observed in Na3OCl and Na3OBr samples. This is attributable to the difference between the ionic radius and atomic mass of the Li+/Na+ ions. In addition, the lattice parameters of Na3OX lattice structure are larger than those of Li3OX,16,20 and consequently the jump distance is larger in Na3OX structures as compared with Li3OX limiting the ease of Na-ion migration in Na3OX structures via a Na+ vacancy mechanism.Alkali diffusion coefficient and conductivity at each temperature for each A3OX nanocrystal are obtained from eqn (2) and (3), respectively. The Arrhenius-type dependence of both diffusion coefficient and conductivity is depicted in Fig. 3. Table 1 compiles the results of activation energy for diffusion and conduction, including the interpolated values at 300 and 500 K of conductivity of A3OX nanocrystals (σ(300 K) and σ(500 K), respectively). The Li3OCl samples have the largest value of conductivity, followed by Li3OBr, Na3OCl and Na3OBr in a decreasing order. This behavior was previously reported by Dawson et al. in monocrystalline samples (i.e. without grain boundaries).16 The activation energy for diffusion is consistently lower as compared to that for the conduction, indicating the existence of non-efficient jumps contributing to the conductivity, despite the difference between mass and charge transport phenomenon.
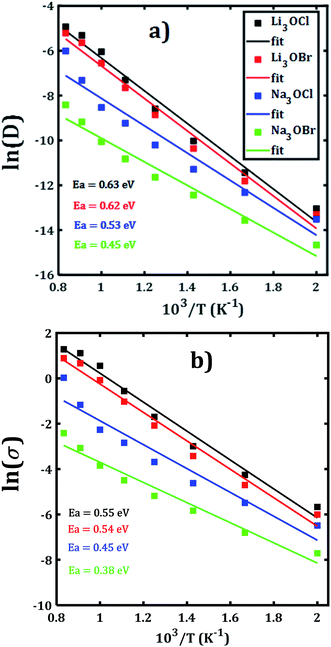 | ||
| Fig. 3 Arrhenius dependence of (a) diffusion coefficient and (b) DC conductivity of each A3OX nanocrystalline samples. | ||
| Structure | Specie | EaD | Eaσ | σ(300 K) | σ(500 K) |
|---|---|---|---|---|---|
| Li3OCl | Li | 0.63 | 0.55 | 4.35 × 10⁻⁷ | 2.13 × 10⁻³ |
| Na3OCl | Na | 0.53 | 0.45 | 7.12 × 10⁻⁷ | 7.90 × 10⁻⁴ |
| Li3OBr | Li | 0.62 | 0.54 | 3.44 × 10⁻⁷ | 1.47 × 10⁻³ |
| Na3OBr | Na | 0.45 | 0.38 | 7.77 × 10⁻⁷ | 2.9 × 10⁻⁴ |
Hereafter, the results are discussed on the basis of activation energy for conduction; a similar discussion can be followed for the diffusion process. The lowest values of activation energy are obtained for Na3OCl and Na3OBr, being 0.45 and 0.38 eV, respectively, whereas the activation energy amounts to 0.54 eV for Li3OCl and Li3OBr. These values are larger as compared to those reported in ref. 16 for monocrystalline samples. The conductivity at 500 K reaches the value of 1.47 and 2.13 × 10⁻³ Scm−1, for Li3OBr and Li3OCl, while 2.9 and 7.9 × 10⁻⁴ Scm−1 for Na3OBr and Na3OCl, respectively.
With respect to the activation energies and conductivity at 500 K reported in early studies, clearly our present calculated values are quite different, with larger activation energies and slightly lower conductivities. Considering the reported underestimation of calculated values for transport properties (i.e. activation energy, diffusion coefficient and conductivity) for these compounds,15–17 the inclusion of the polycrystalline nature with presence of ∑3(111) grain boundary makes the results more credible. In general, the present trend and magnitude of the conductivity are more consistent with available experimental data. For instance, the bulk Li3OCl is characterized with an activation energy of 0.54–0.59 eV and a conductivity of 5.8 × 10⁻⁷ Scm−1.12,17,25,26 A recent theoretical study of the Na+ migration in Na3OBr which was based on a combined deep potential MD, ab initio MD and static simulations, revealed a diffusion activation energy of 0.41–0.43 eV and a conductivity at ambient temperature up to 2 × 10⁻⁷ Scm−1,27 even a static simulation study reported an activation energy as low as 0.34 eV.17 Earlier study of transport properties of Na3OCl obtained a conductivity at 500 K of 2 × 10⁻⁴ Scm−1.16,27 From the results listed in Table 1 we can conclude on a consistency between the reported findings15,16 and our present results. In particular, the transport properties reported in the present paper are more realistic considering the presence of ∑3(111) grain boundaries and polycrystalline nature in such A3OX structures. Our results explicitly confirm the fact that the presence of grain boundary in the computations, particularly the ∑3(111) entails the high grain boundary resistance in these compounds.15,17
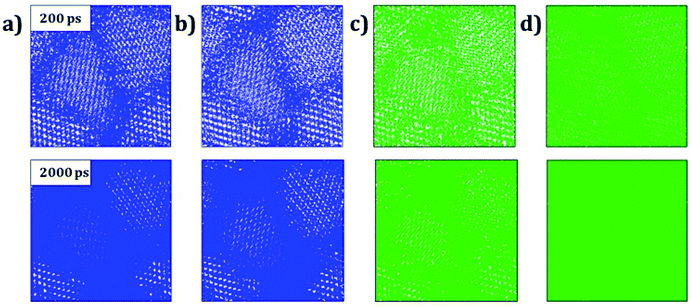
Trajectory density plot is a powerful tool to visualize the ion mobility, especially in polycrystalline materials.15,24 Fig. 4 depicts the Li and Na trajectory plot at 200 ps of A3OX nanocrystals. In all cases the trajectory maps confirm the 3D characteristic of alkali migration. At 200 ps, the granulated samples are clearly visible except for Na3OBr sample having a higher density trajectory map, which implies that the Li and Na mobility is constrained when they are close to the grain boundaries.
The Li and Na mobility through the grain boundaries is not restricted because these conducting regions contain more migration paths, where the alkali-ion diffuses without the need of alkali vacancy as a conduction mechanism which is required for bulk A3OX and monocrystalline samples. With the temporal evolution, alkali ions can migrate to the grain via interstitial or Li/Na vacancy conduction mechanism. At 2 ns, the trajectory plots are getting denser, in particular for Li3OCl, Li3OBr and Na3OCl the granulated structure is still visible showing a higher density near of the grain boundary regions. The Na3OBr shows the highest density map covering the entire simulation box, implying that this compound has better Na transport properties as compared to the other cases considered. In addition, the trajectory plot becomes similar to that of a monocrystalline Na3OBr sample.
3.2 Li and Na transport properties in mixed cation systems
An earlier study reported the transport properties of monocrystalline samples of mixed cation Li3−yNayOX and Na3−yLiyOX, predicting no significant improvements on transport properties as compared to those of the A3OX structures.16 Exploration of transport properties of these systems is of interest to further elucidate the capability of pristine Li3OX/Na3OX as inorganic solid electrolyte for lithium/sodium ion batteries. In this context, this section is aimed to a study on transport properties of the mixed nanocrystals of Li3−xNaxOX and Na3−xLixOX. Nanocrystals are constructed by random substitution of Li/Na in Li3OX and Na3OX structures discussed in Section 3.1, leading a composition of 17![[thin space (1/6-em)]](https://www.rsc.org/images/entities/char_2009.gif) 187 Li+, 8593 Na+, 8615 O2− and 8550 X−, resulting in a stoichiometric formula Li2NaOX maintaining the defect concentration of A+ and X− (y = 0.118). For the sodium counterpart Na2LiOX, the alkali composition is 17
187 Li+, 8593 Na+, 8615 O2− and 8550 X−, resulting in a stoichiometric formula Li2NaOX maintaining the defect concentration of A+ and X− (y = 0.118). For the sodium counterpart Na2LiOX, the alkali composition is 17![[thin space (1/6-em)]](https://www.rsc.org/images/entities/char_2009.gif) 187 Na+ and 8593 Li+, maintaining the same number of O2− and X− species. Both Li2NaOX and Na2LiOX preserve the ∑3(111) grain boundary as well as the amount and size of grain and the simulation box. Eqn (1) is also considered for the construction of the simulation boxes, leading
187 Na+ and 8593 Li+, maintaining the same number of O2− and X− species. Both Li2NaOX and Na2LiOX preserve the ∑3(111) grain boundary as well as the amount and size of grain and the simulation box. Eqn (1) is also considered for the construction of the simulation boxes, leading  . The same setup described in Section 3.1 for large scale MD is adopted, recording the MSD for Li+ and Na+ in Li2NaOX and Na2LiOX structures.
Fig. 5 depicts the temporal evolution of the mean square displacement of Li+ and Na+ ions in Li2NaOX and Na2LiOX nanocrystals. At shown in Fig. 5, all MSDs tend to increase the linearly with the evolution of the simulation time, and the slope increases upon the temperature change. This is an indicator for the existence of long-range diffusion.
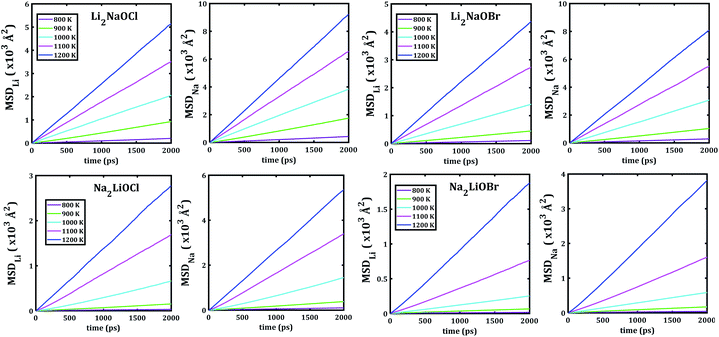 | ||
| Fig. 5 Li− and Na−mean square displacement (MSD) versus simulation time of Li2NaOX and Na2LiOX structures. | ||
Note that in all mixed cation samples, the order of magnitude of Na-MSD is greater than that of the Li-MSD in the entire temperature range studied, which implies better migration properties for Na+ ion in all samples considered.
In order to disclose the migration properties, the diffusion coefficients are obtained by fitting the MSDs data using eqn (2). Fig. 6 shows the Arrhenius-type dependence of diffusion with the temperature of each mixed cation system. The straight lines in Fig. 6a and b are almost parallel, which implies similar activation energies (being ≈ 0.65 eV) for both Li+ and Na+ migrations in Li2NaOX systems. These activation energies for diffusion in Li2NaOX are similar as compared to their pristine Li3OX counterpart (≈0.63 eV). Surprisingly, the diffusion coefficient of Na+ is higher by one order of magnitude with respect to the Li+ diffusivity in all cases, suggesting that these systems have some potential in application as inorganic solid-state electrolyte for future Na-ion batteries. Analogously, the diffusion data are converted to the dc conductivity with the aid of eqn (4).
 | ||
| Fig. 6 Arrhenius dependence of Li− and Na−diffusion coefficient (D) of Li2NaOX and Na2LiOX structures. | ||
Fig. 7 depicts the Arrhenius-type dependence of the Li+ and Na+ dc-conductivity for Li2NaOX and Na2LiOX structures. While Fig. 7a shows the case of conductivity dependence in Li2NaOX, Fig. 7b is related to Na2LiOX structures. The alkali conductivities for Li2NaOCl and Li2NaOBr structures are similar to each other (Fig. 7a). At lower temperature (<900 K) the conductivity values are higher by two, even three orders of magnitude in Li2NaOX with respect to the Na2LiOX compound, except for the Na conduction in Na2LiOCl structure with similar values upon temperature change.
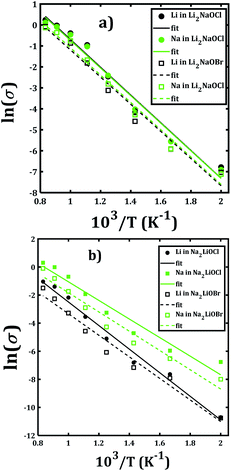 | ||
| Fig. 7 Arrhenius-type dependence of Li and Na dc-conductivity of (a) Li2NaOX and (b) Na2LiOX nanocrystalline sample. | ||
Table 2 summarizes the activation energies for Li and Na diffusion and conduction, including the conductivity at 300 and 500 K in Li2NaOX and Na2LiOX structures. As in the case of the pristine A3OX compounds, the activation energy for both alkali ions diffusion is larger than that for conduction, due to non-effective jumps contributing to the long-range conductivity. Li2NaOX have smaller activation energies, being between 0.65/0.56 eV for diffusion/conduction, respectively. Our calculated results of conductivity at 300 K reach to the values of 1.02 × 10⁻⁷ and 6.62 × 10⁻⁴ Scm−1 at 500 K for Na+ conduction in Li2NaOCl nanocrystalline sample; both quantities lie well in a range for those obtained for the pristine Na3OCl.16 Our results are also consistent with the reported Li conductivity of ≈ 10−4 Scm−1 which was reported for Li2NaOX at 500 K.16 In the case of Li2NaOBr, the Li+ and Na+ conductivities at 300 K and 500 K are in the order of 8 × 10⁻⁸ and 5 × 10⁻⁴ Scm−1, respectively. For Na2LiOX structures, again the Na+ conduction suggests its better transport properties in view of their lower activation energy and higher diffusion coefficient and conductivity at 300 and 500 K. Among the Na2LiOX structures, Na2LiOCl presents us with some better Na transport properties.
| Structure | Specie | EaD | Eaσ | σ(300 K) | σ (500 K) |
|---|---|---|---|---|---|
| Li2NaOCl | Li | 0.65(4) | 0.57(0) | 9.86 × 10⁻⁸ | 6.68 × 10⁻⁴ |
| Na | 0.65(2) | 0.56(7) | 1.02 × 10⁻⁷ | 6.62 × 10⁻⁴ | |
| Li2NaOBr | Li | 0.64 | 0.55(8) | 8.34 × 10⁻⁸ | 4.68 × 10⁻⁴ |
| Na | 0.65 | 0.56(1) | 8.38 × 10⁻⁸ | 4.97 × 10⁻⁴ | |
| Na2LiOCl | Li | 0.80 | 0.72 | 2.57 × 10⁻¹⁰ | 1.87 × 10⁻⁵ |
| Na | 0.64 | 0.57 | 6.84 × 10⁻⁸ | 4.64 × 10⁻⁴ | |
| Na2LiOBr | Li | 0.74 | 0.66 | 5.90 × 10⁻¹⁰ | 1.66 × 10⁻⁵ |
| Na | 0.67 | 0.59 | 1.77 × 10⁻⁸ | 1.67 × 10⁻⁴ |
The origin of the higher diffusion coefficient and conductivity in mixed Li2NaOX and Na2LiOX structures can be rationalized by the defect formation energy of Li/Na halide partial Schottky defects. For instance, the formation energy of Na-halide Schottky defect in Na2LiOCl and Na2LiOBr is lower as compared to their Li-halide counterparts.16 For Li2NaOX compounds, the Li/Na-X formation energy is similar, in accordance with the results on diffusion/conduction data depicted in Fig. 6 and 7. On the other hand, reports concerning the contradiction of conventional typecast are based on the ionic radius difference between Li (0.59 Å) and Na (0.99 Å).28–30 Considering the A+ ionic size as indicated by the mean ionic radius of Li and Na (i.e. r(A) = 0.79 Å), one can conclude that a substitution of Na occupying the A-site results as a consequence in a strong local strain/stress in the Li2NaOX and Na2LiOX structures, reducing the Na -VA distance and the diffusion length. Besides, a Li occupancy of an A-site enlarges the Li- VA distance. An A-halide Schottky defect leads to A-vacancies together with the competition between Li and Na atoms to reach the vacancies of A, and thereby constitutes the origin of the conductive behaviour in Li2NaOX and Na2LiOX structures.
Fig. 8 displays the trajectory density plots of Li2NaOX and Na2LiOX structures at 2 ns. The density map profiles are similar to those discussed in the case of A3OX materials. The main difference consists in the fact that both Li and Na ion transports are favoured with marginally higher activation energies and lower conductivity at operative temperatures. Similar findings of individual alkali ion migration were discussed,16 where it was concluded that these mixed cation systems (i.e. Li2NaOX and Na2LiOX structures) are unfavourable to be used as inorganic electrolytes on the basis of the activation energy and diffusion/conduction at operative temperatures.
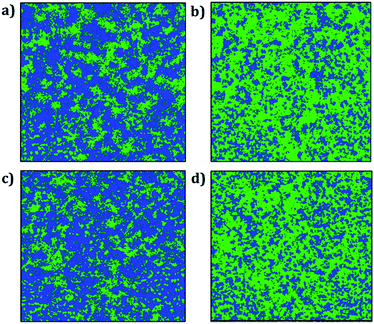 | ||
| Fig. 8 Trajectory plots of Li and Na in (a) Li2NaOCl, (b) Na2LiOCl, (c) Li2NaOBr and (d) Na2LiOBr compounds after 2 ns. Blue and green lines represent the Li and Na trajectory lines, respectively. | ||
4. Conclusions
The influence of the presence of ∑3(111) grain boundaries on the transport properties of A3OX nanocrystalline samples was disclosed. Large scale molecular dynamic simulations showed that these nanocrystalline samples have higher activation energies as compared to values reported in previous theoretical studies, but much closer to the experimental data. This is attributed to the higher atomic density at the ∑3(111) grain boundaries. The pristine Na3OBr sample is characterized by the lower activation energies for Na-ion diffusion and conduction, making this compound promising for future solid state electrolyte in Na-ion batteries technologies. Despite some lowering of transport properties of the mixed samples Li2NaOX and Na2LiOX, they can also be considered as inorganic solid electrolytes in both Li- and Na-Ion batteries.Conflicts of interest
There are no conflicts to declare.Acknowledgements
LVD is thankful to the Van Lang University.Notes and references
- A. Ahniyaz, I. de Meatza, A. Kvasha, O. Garcia-Calvo, I. Ahmed, M. F. Sgroi, M. Giuliano, M. Dotoli, M. A. Dumitrescu, M. Jahn and N. Zhang, Adv. Appl. Energy, 2021, 4, 100070 CrossRef.
- J. Zheng, Y. Wu, Y. Sun, J. Rong, H. Li and L. Niu, Nano-Micro Lett., 2021, 13, 1–37 CrossRef CAS PubMed.
- T. F. Yi, T. T. Wei, Y. Li, Y. B. He and Z. B. Wang, Energy Storage Mater., 2020, 26, 165–197 CrossRef.
- Z. Fu, X. Chen and Q. Zhang, Wiley Interdiscip. Rev.: Comput. Mol. Sci., 2022, e1621 Search PubMed.
- W. Xia, Y. Zhao, F. Zhao, K. Adair, R. Zhao, S. Li, R. Zou, Y. Zhao and X. Sun, Chem. Rev., 2022, 122, 3763–3819 CrossRef CAS PubMed.
- A. A. Franco, A. Rucci, D. Brandell, C. Frayret, M. Gaberscek, P. Jankowski and P. Johansson, Chem. Rev., 2019, 119, 4569–4627 CrossRef CAS PubMed.
- X.-X. Ma, X. Shen, X. Chen, Z.-H. Fu, N. Yao, R. Zhang and Q. Zhang, Small Struct., 2022, 2200071 CrossRef.
- A. K. Sagotra and C. Cazorla, ACS Appl. Mater. Interfaces, 2017, 9, 38773–38783 CrossRef CAS PubMed.
- X. Lü, G. Wu, J. W. Howard, A. Chen, Y. Zhao, L. L. Daemen and Q. Jia, Chem. Commun., 2014, 50, 11520–11522 RSC.
- H. Nguyen, S. Hy, E. Wu, Z. Deng, M. Samiee, T. Yersak, J. Luo, S. P. Ong and Y. S. Meng, J. Electrochem. Soc., 2016, 163, A2165–A2171 CrossRef CAS.
- M. Wu, B. Xu, X. Lei, K. Huang and C. Ouyang, J. Mater. Chem. A, 2018, 6, 1150–1160 RSC.
- X. Lü, J. W. Howard, A. Chen, J. Zhu, S. Li, G. Wu, P. Dowden, H. Xu, Y. Zhao and Q. Jia, Adv. Sci., 2016, 3, 1500359 CrossRef PubMed.
- R. Mouta, M. Á. B. Melo, E. M. Diniz and C. W. A. Paschoal, Chem. Mater., 2014, 26, 7137–7144 CrossRef CAS.
- J. Zhu, S. Li, Y. Zhang, J. W. Howard, X. Lü, Y. Li, Y. Wang, R. S. Kumar, L. Wang and Y. Zhao, Appl. Phys. Lett., 2016, 109, 101904 CrossRef.
- J. A. Dawson, P. Canepa, T. Famprikis, C. Masquelier and M. S. Islam, J. Am. Chem. Soc., 2018, 140, 362–368 CrossRef CAS PubMed.
- J. A. Dawson, H. Chen and M. Saiful Islam, J. Phys. Chem. C, 2018, 122, 23978–23984 CrossRef CAS.
- J. Zhu, Y. Wang, S. Li, J. W. Howard, J. Neuefeind, Y. Ren, H. Wang, C. Liang, W. Yang, R. Zou, C. Jin and Y. Zhao, Inorg. Chem., 2016, 55, 5993–5998 CrossRef CAS PubMed.
- Y. Zhao and L. L. Daemen, J. Am. Chem. Soc., 2012, 134, 15042–15047 CrossRef CAS PubMed.
- B. Chen, C. Xu and J. Zhou, J. Electrochem. Soc., 2018, 165, A3946–A3951 CrossRef CAS.
- M. A. Sattar, M. Javed, M. Benkraouda and N. Amrane, Int. J. Energy Res., 2021, 45, 4793–4810 CrossRef CAS.
- P. Hirel, Comput. Phys. Commun., 2015, 197, 212–219 CrossRef CAS.
- S. Plimpton, J. Comput. Phys., 1995, 117, 1–19 CrossRef CAS.
- T. Famprikis, P. Canepa, J. A. Dawson, M. S. Islam and C. Masquelier, Nat. Mater., 2019, 18, 1278–1291 CrossRef CAS PubMed.
- Y. A. Zulueta and M. T. Nguyen, Dalton Trans., 2021, 50, 3020–3026 RSC.
- J. A. Dawson, T. Famprikis and K. E. Johnston, J. Mater. Chem. A, 2021, 9, 18746–18772 RSC.
- H. H. Heenen, J. Voss, C. Scheurer, K. Reuter and A. C. Luntz, J. Phys. Chem. Lett., 2019, 10, 2264–2269 CrossRef CAS PubMed.
- H. X. Li, X. Y. Zhou, Y. C. Wang and H. Jiang, Inorg. Chem. Front., 2021, 8, 425–432 RSC.
- S. C. Jung, H. J. Kim, J. W. Choi and Y. K. Han, Nano Lett., 2014, 14, 6559–6563 CrossRef CAS PubMed.
- C. Ling and R. Zhang, Phys. Chem. Chem. Phys., 2017, 19, 10036–10041 RSC.
- Y. A. Zulueta, P. Geerlings, F. Tielens and M. T. Nguyen, J. Solid State Chem., 2019, 279, 120930 CrossRef CAS.
| This journal is © The Royal Society of Chemistry 2022 |

