 Open Access Article
Propane dehydrogenation over extra-framework In(I) in chabazite zeolites†
Yong
Yuan
and
Raul F.
Lobo
 *
*
Center for Catalytic Science and Technology, Department of Chemical and Biomolecular Engineering, University of Delaware, Newark, Delaware 19716, USA. E-mail: lobo@udel.edu
First published on 4th February 2022
Abstract
Indium on silica, alumina and zeolite chabazite (CHA), with a range of In/Al ratios and Si/Al ratios, have been investigated to understand the effect of the support on indium speciation and its corresponding influence on propane dehydrogenation (PDH). It is found that In2O3 is formed on the external surface of the zeolite crystal after the addition of In(NO3)3 to H-CHA by incipient wetness impregnation and calcination. Upon reduction in H2 gas (550 °C), indium displaces the proton in Brønsted acid sites (BASs), forming extra-framework In+ species (In-CHA). A stoichiometric ratio of 1.5 of formed H2O to consumed H2 during H2 pulsed reduction experiments confirms the indium oxidation state of +1. The reduced indium is different from the indium species observed on samples of 10In/SiO2, 10In/Al2O3 (i.e., 10 wt% indium) and bulk In2O3, in which In2O3 was reduced to In(0), as determined from the X-ray diffraction patterns of the product, H2 temperature-programmed reduction (H2-TPR) profiles, pulse reactor investigations and in situ transmission FTIR spectroscopy. The BASs in H-CHA facilitate the formation and stabilization of In+ cations in extra-framework positions, and prevent the deep reduction of In2O3 to In(0). In+ cations in the CHA zeolite can be oxidized with O2 to form indium oxide species and can be reduced again with H2 quantitatively. At comparable conversion, In-CHA shows better stability and C3H6 selectivity (∼85%) than In2O3, 10In/SiO2 and 10In/Al2O3, consistent with a low C3H8 dehydrogenation activation energy (94.3 kJ mol−1) and high C3H8 cracking activation energy (206 kJ mol−1) in the In-CHA catalyst. A high Si/Al ratio in CHA seems beneficial for PDH by decreasing the fraction of CHA cages containing multiple In+ cations. Other small-pore zeolite-stabilized metal cation sites could form highly stable and selective catalysts for this and facilitate other alkane dehydrogenation reactions.
Introduction
The increasing world demand for propylene and the current low cost of propane derived from shale gas have renewed interest in the propane dehydrogenation reaction (PDH).1 PDH technologies, i.e., the Catofin process using a CrOx/Al2O3 catalyst, and the Oleflex process using a supported Pt–Sn catalyst, have drawbacks, such as the high cost and rapid deactivation of Pt and the potential environmental impact caused by Cr. Many other catalysts for PDH have been investigated including Ga-,2–10 Zn-,11,12 Co-,13–15 Fe-,16–18 V-,19–22 Zr-based materials,23–25 and nanocarbon catalysts.26,27 Metal cations (Ga+, Zn2+, Co2+, etc.) exchanged in zeolite H-ZSM-5![[thin space (1/6-em)]](https://www.rsc.org/images/entities/char_2009.gif) 28–32 have shown promising alkane dehydrogenation properties as well: among them, Ga/H-ZSM-5 exhibits high stability and high propylene selectivity (∼90%) for propane dehydrogenation.31,32
28–32 have shown promising alkane dehydrogenation properties as well: among them, Ga/H-ZSM-5 exhibits high stability and high propylene selectivity (∼90%) for propane dehydrogenation.31,32
Shimizu and coworkers33,34 recently reported that In-CHA is a stable and selective catalyst for ethane dehydrogenation. They have also shown that the CHA zeolite is superior to other zeolite frameworks for this reaction (BEA, MFI, and MOR) and that an Al-rich In-CHA zeolite (Si/Al = 6.85) provided higher dehydrogenation rates. They showed that In2O3, initially present on the external surface of CHA, can be reduced and then reacts with the Brønsted acid sites (BASs) of the zeolite to form an indium-exchanged (In+) CHA catalyst through the so-called reductive solid-state-ion exchange (RSSIE) process. Isolated [InH2]+ sites were put forward as the active center in these catalysts based on Fourier transform infrared (FTIR) spectroscopy and X-ray absorption fine structure (XAFS) measurements.
The identification of [InH2]+ as the active site for ethane dehydrogenation was primarily based on ex situ FTIR spectroscopy and DFT calculations;33,34 however, the spectra used in support of the presence of [InH2]+ were collected at low temperature (below 153 K, after treating with H2 at 773 K), and therefore whether the indium hydride is stable at the reaction temperature (600 °C) remains to be determined. Furthermore, Andrews et al.35 have found that indium hydride is unstable at temperatures above 200 K (indium hydride forms at 3.5 K but disappears above 200–210 K). It is thus uncertain whether [InH2]+ is an intermediate at catalytic reaction temperatures. This point has also been debated in Ga/H-ZSM-5 catalysts with respect to propane dehydrogenation. Bell and coworkers32 believe that single [GaH]2+ sites are the active species; however, Schreiber et al.31 reported that Ga+–H+ pair sites are the stable active sites, a model supported by results from our laboratory.36 Phadke et al.32,37 have pointed out that Ga-exchanged species associated with Al-pairs in Ga/H-MFI catalyze both propane and butane dehydrogenation while isolated Ga species did not. They found, however, that both Ga species exhibited similar properties for ethane dehydrogenation. It is thus possible that the reaction mechanism of propane dehydrogenation with the In-CHA catalyst is different from that of ethane dehydrogenation.
Hart et al.38 reported that MFI-supported catalysts containing high indium loadings (In/Al ratio close to 1 to minimize the presence of BASs) selectively catalyze the propane dehydrogenation reaction, but the reduction of indium species to In(0) during the reaction resulted in catalyst deactivation. Jones and coworkers39,40 investigated In2O3–Ga2O3 and ternary In–Ga–Al mixed oxides as catalysts for propane dehydrogenation and found that reducing In2O3 domains to In(0) was detrimental to catalytic performance, and that once In(0) is formed from In2O3, it cannot be reactivated, indicating that In(0) was inactive for propane activation. These reports show that indium speciation at high temperature is highly dependent on the catalyst support: CHA-supported indium was stable for ethane dehydrogenation for 90 h time-on-stream (TOS), while the Al2O3 supported indium catalyst deactivated with time on stream.33,39 Understanding the support impact on indium speciation and the corresponding influence on catalytic performance is thus important to advance In-based catalyst understanding for alkane dehydrogenation reactions.
In this work, samples of indium on silica, on alumina and exchanged into CHA zeolites with varying In/Al ratios and Si/Al ratios have been used to investigate the effect of the support on the indium speciation and the corresponding impact on propane dehydrogenation rates. On In-CHA, In2O3 initially located on the external surface of the H-CHA zeolite is reduced in the presence of dihydrogen displacing the protons of the BAS. Isolated In+ in the CHA zeolite was formed upon reduction. The reduced indium species were different on In/SiO2, In/Al2O3 and bulk In2O3, where a portion of In2O3 was reduced to In(0) species. At comparable conversion, the propane dehydrogenation reaction over In-CHA shows better stability and C3H6 selectivity (∼85%) than In/SiO2, In/Al2O3 and bulk In2O3. The examination of Si/Al ratios suggests that higher Si/Al ratios are beneficial to propane dehydrogenation. These results all point to the conclusion that the dehydrogenation properties of isolated In+ in CHA are superior to those of In(0) on other supports.
Results and discussion
Reduction of In-based catalysts
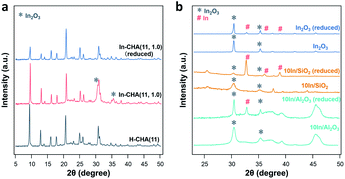
Indium supported on the CHA zeolite with varying In/Al ratios and Si/Al ratios, SiO2, and Al2O3 are prepared as follows: H-CHA(11) samples were obtained via calcination of commercial NH4-CHA (Si/Al = 11) samples obtained from ACS Material. H-CHA(x) (x = 5, 12 or 25, is the Si/Al ratio) were synthesized based on previous reports41,42 (details are included in the ESI†). The physical properties of H-CHA samples are summarized in Table S1.† The micropore volume of H-CHA samples is in the range of 0.25–0.30 cm3 g−1, consistent with typical CHA zeolites' properties.43,44 For the sample H-CHA(11), the 27Al solid-state nuclear magnetic resonance (SS-NMR) spectrum was dominated by a strong sharp signal at 54 ppm, which is assigned to tetrahedrally coordinated framework Al in the zeolite, and a weak feature at ∼0 ppm in the 27Al MAS NMR spectrum (Fig. S2†) is assigned to a small amount of extra-framework Al (AlEF), as octahedral aluminum (around 15%). Similarly, tetrahedrally coordinated Al is predominant in the spectra of the synthesized H-CHA with varying Si/Al ratios, and almost no AlEF was observed at Si/Al ratios of 12 and 25.44 The SEM images (Fig. S3†) of the CHA sample show approximately 300 nm, 300 nm, 1 μm, and 1.5 μm sized zeolite crystals for H-CHA(11), H-CHA(5), H-CHA(12), and H-CHA(25), respectively. The surface area of SiO2 and γ-Al2O3 investigated was 285 and 79 m2 g−1 (Table S2†). The composition of In-based catalysts including In-CHA with varying In/Al and Si/Al ratios and 10In/SiO2 and 10In/Al2O3 is summarized in Table S3.†The XRD patterns of the In-based catalyst before and after reduction confirm that the indium phase formed after reduction is highly dependent on the support. The expected diffraction peaks of the CHA zeolite (Fig. 1 and S4†) are observed for all H-CHA samples investigated,43 verifying that all zeolite samples are pure in phase and highly crystalline. The peaks of the In2O3 phase (JCPDS 06-0416) are clearly observed on the In-CHA(11, 1.0), 10In/Al2O3 and 10In/SiO2 samples, prepared via the incipient wetness impregnation method, followed by calcination at 600 °C (the x and y in In-CHA(x, y) represent the Si/Al ratio and In/Al ratio, respectively). Upon reduction at 600 °C, the In2O3 peaks on the impregnated + calcined H-CHA sample disappear (Fig. 1) without another indium-related phase detected by XRD. This shows that In2O3 supported on the CHA zeolite is reduced to form highly dispersed species. The decrease in the relative intensity between the diffraction peaks at ∼9° and ∼21° on reduced In-CHA(11, 1.0) was interpreted as the introduction of extra-framework indium cations when exchanged with BASs (results below support the formation of In+). Similar observations were made on In-CHA(x, 1.0) (x = 5, 12 and 25, as shown in Fig. S4†). The micropore volumes of In-CHA(11, 1.0), calcined and reduced, are 0.21 and 0.20 cm3 g−1, respectively (Table S1†). Considering the presence of indium species inside the micropores when calculating the micropore volume, by subtracting the mass of indium in In-CHA(11, 1.0) and assuming that In2O3 and In+ sites were formed in the calcined and reduced samples, the micropore volumes (without the In mass in them) were recalculated to be 0.26 and 0.23 cm3 g−1, respectively. The similar micropore volume of In-CHA(11, 1.0) and H-CHA(11) suggests that In2O3 is largely located on the external surface of the H-CHA(11) zeolite particles, rather than inside the micropores, before reduction. The lower micropore volume of reduced In-CHA(11, 1.0) compared to H-CHA(11) suggests that indium species moved into the micropores of the zeolite upon reduction. A significant fraction of micropores were occupied by indium species on reduced In-CHA(5, 1.0) compared with H-CHA(5) (0.27 versus 0.16 cm3 g−1, shown in Table S1†), which is due to a large amount of In2O3 that diffused into the micropores of the zeolite, while the void fraction occupation of micropores was low on reduced In-CHA(25, 1.0) samples. The diffusion of In2O3 into the zeolite micropores is also supported by the SEM and TEM images of calcined and reduced In-CHA (see Fig. S3 and S5†). The In2O3 particles observed on the external surface of the CHA particles (bright spots in SEM images and dark spots in TEM images) nearly disappear after reduction (Fig. S3 and S5†). Note that In2O3 particles are larger than 2 nm and thus cannot enter the small micropores of CHA. The exchange process was assisted by H2 reduction, usually referred to as the RSSIE process.33,34 The In2O3 phase could have been reduced to In2O, which is volatile and can diffuse into the micropores of CHA where it reacts with BASs forming In+ sites. A similar process was also reported by Ga oxide in Ga/H-ZSM-5 systems.45,46 The 27Al NMR spectrum of reduced In-CHA with different Si/Al ratios showed a broadened peak at 54 ppm (tetrahedrally coordinated Al), assigned to a distorted tetrahedral aluminum environment.47,48
It follows that upon reduction of In-CHA, the indium species enter the pores of the zeolite and interact with tetrahedrally coordinated Al. When indium is impregnated on SiO2 and Al2O3 supports, In(0) was formed upon reduction (Fig. 1). But note that not all In2O3 is reduced since both In2O3 and In(0) are detected (Fig. 1). The pristine In2O3 sample initially displays only the In2O3 phase, and upon reduction In(0) is formed despite the remaining presence of a large amount of In2O3. In(0) is the species observed on bulk In2O3 and indium supported on silica and alumina although not all In2O3 could be reduced under the conditions investigated (10 vol% H2/N2 at 600 °C for 30 min), which is very different from the case of CHA. As the In/Al ratio of In-CHA (Si/Al = 12) rises from 0.3 to 1.7, the In2O3 diffraction peaks on calcined samples become gradually more clear (Fig. S6†). Upon reduction, In2O3 diffraction peaks disappear when the In/Al ratio is at or below 1.0. Both In2O3 and In(0) diffraction peaks, however, are detected upon reducing In-CHA(12, 1.7); that is, In2O3 is partially reduced to form In(0) when the BASs become scarce, as observed in bulk In2O3 and indium loaded on SiO2 and Al2O3.
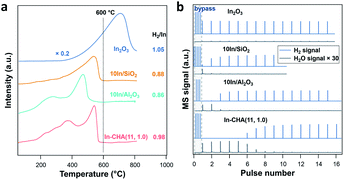
H2-TPR measurements were conducted to monitor the reduction process of the In-based catalyst (Fig. 2a). For In-CHA(11, 1.0), the resulting profile shows several peaks with increasing temperature from 200 °C to 600 °C. This complex signal may result from two factors: (1) the distribution of In2O3 particle sizes at a high In loading (∼14%) had a variety of reduction temperatures;40 (2) an elevated temperature was needed to drive the reaction of In2O3 with BASs when the sites had been consumed mainly at lower temperatures. On 10In/SiO2 and 10In/Al2O3 catalysts, the reduction profile shows complete reduction below 600 °C. Bulk In2O3, however, shows a much higher reduction temperature with the reduction peak centered at around 700 °C; that is, bulk In2O3 is harder to reduce (consistent with the observation of Jones and coworkers).39 The higher reduction temperature explains the large amount of In2O3 observed by XRD after reducing the In2O3 catalyst (Fig. 1).
The quantification of the H2/In ratio during the H2-TPR experiments provides information about the reaction stoichiometry and composition of the reduced indium species (Table 1). The consumed H2/In ratio on the In-CHA(11, 1.0) catalyst was 0.98; almost all In2O3 species were reduced to In+. However, the H2/In ratio on 10In/SiO2 and 10In/Al2O3 was 0.88 and 0.86, respectively. The fact that the H2/In ratio is less than unity shows that not all In2O3 was reduced. Combined with the XRD measurements, it is concluded that only a fraction of In2O3 on 10In/SiO2 and 10In/Al2O3 was reduced to form In(0), which appears to hinder the further reduction of the remaining In2O3 and results in the low H2/In ratios observed. A higher H2/In ratio is observed on In2O3 than on 10In/SiO2 and 10In/Al2O3 although the major consumption of H2 occurs at elevated temperature (>600 °C).
| Sample | H2/In (H2-TPR) | H2/In (H2-pulse) | O/In (O2 pulse) |
|---|---|---|---|
| In2O3 | 1.05 | — | — |
| 10In/SiO2 | 0.88 | 0.25 ± 0.02 | 0.12 ± 0.01 |
| 10In/Al2O3 | 0.86 | 0.46 ± 0.01 | 0.44 ± 0.02 |
| In-CHA(11, 1.0) | 0.98 | 0.86 ± 0.02 | 0.86 ± 0.02 |
| In-CHA(11, 1.0), (H2-O2 treated) | — | 0.92 ± 0.02 | 0.92 ± 0.02 |
H2 pulse experiments provide additional details about the reduction process. As shown in Fig. 2b, the initial 5 H2 pulses were completely consumed on In-CHA(11, 1.0), and occurred in parallel with the formation of H2O, confirming that the reduction process consumes H2 and forms H2O. The quantified H2 to In content ratio was 0.86, slightly lower than 1. The slightly smaller H2/In ratio in the H2-pulse experiments versus the H2 consumed in the H2-TPR profiles is probably due to a small fraction of In2O3 that was not reduced via H2 pulses. To test this hypothesis, we reduced In-CHA(11, 1.0) using a 10 vol% H2 flow for 30 min, followed by O2 pulses (Fig. S7†) and found that the O/In ratio was 1.01, consistent with the analysis of the H2-TPR profiles. On the 10In/Al2O3, 10In/SiO2 and In2O3 samples, the H2 consumption in the H2 pulses decreases gradually with the pulse number (Fig. 2b and Table 1). The H2/In ratios are lower than the values obtained from H2-TPR, suggesting that H2 pulses cannot completely reduce the sample (possibly due to the dilution by the carrier gas) compared with experiments under a constant H2 flow. The O/In ratio of In-CHA(11, 1.0) was consistent with H2/In ratios (Table 1), demonstrating the quantitative reduction/oxidation of the In+3/In+ cations in the In-CHA samples.
On 10In/SiO2 and 10In/Al2O3 catalysts, the lower O/In ratio versus the H2/In ratio may result from the slow oxidation kinetics during O2 pulses (Table 1 and Fig. S8†). These experiments demonstrate that over CHA zeolites, the reduction of In2O3 to In+ prevents the deep reduction of In2O3 to In(0). Once In+ is formed in the extra-framework positions of the CHA zeolite, it can be oxidized quantitatively to In3+ through oxygen pulses consuming 1 oxygen atom per In cation (denoted as H2-O2 treated, shown in Table 1 and Fig. S7†), and then reduced quantitatively, consuming one dihydrogen molecule per In cation.
Identification of isolated In+ sites
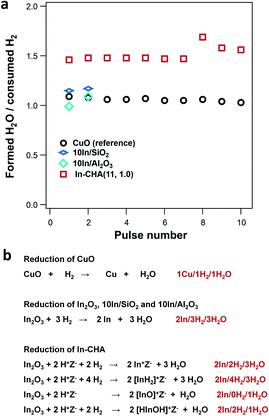
We have employed a pulse-reactor and in situ FTIR spectroscopy to determine that isolated In+ sites are the stable species formed upon reduction of the In-CHA catalyst with H2. In fact, the ratio between the formed H2O and consumed H2 at the reaction temperature is consistent with isolated In+ sites as the stable indium species: as shown in Fig. 3a, the ratio of formed H2O/consumed H2 was 1.5 for the impregnated/calcined In2O3/CHA. As a control experiment, the formed H2O/consumed H2 ratio on CuO was determined to be ∼1.0, which is consistent with the stoichiometry during reduction (Fig. 3b and S9†). The higher ratio of formed H2O/consumed H2 means that another H source contributes to the H2O formation during the reduction process on In-CHA. It follows that In2O3 is reduced to In(I) and then exchanged for protons in CHA. Based on the list of possible reactions (Fig. 3b), it is concluded that In+ sites were the product of In2O3 reduction, rather than [InH2]+, [InO]+ or [HInOH]+ (Fig. 3b).On 10In/SiO2 and 10In/Al2O3, the formed H2O/consumed H2 ratio in the initial H2 pulse experiment was 1.0, which means that In2O3 reacted with H2 to form In(0) and H2O (Fig. 3b). These results are consistent with the identification of In(0) crystals in the XRD patterns of the reduced samples. Schreiber et al.31 applied the same technique to determine that Ga+ is the dominant species formed after reducing Ga/ZSM-5. Our results provide another example of the application of a pulse reactor to identify the structure and oxidation state of the metal-exchanged zeolite.
The determination of consumed H2 on In-CHA with varying Si/Al ratios and In/Al ratios demonstrates that In2O3 could be completely reduced to In+ species when the In/Al ratios ≤ 1.0, independent of Si/Al ratios. For In-CHA (Si/Al = 12) with varying In/Al ratios (Fig. 4a and S10†), the H2 consumption determined from H2 pulses and H2-TPR profiles versus In loading falls on a straight line with a slope of 1.0 when the In/Al ratio is at or below 0.7. This slope suggests that In2O3 was chiefly reduced to In+.
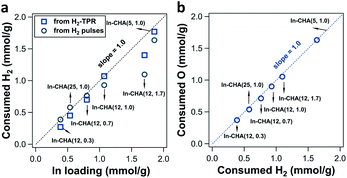 | ||
| Fig. 4 (a) Quantification of consumed H2 from H2 pulses (black circle point) and H2-TPR (blue square point) over In-CHA(x, y) (as indicated in the figure). The black dotted line represents the ratio of consumed H2 to In loading of 1. (b) Quantification of consumed O atoms from O2 pulses as a function of consumed H2 from H2 pulses over In-CHA(x, y) (as indicated in the figure). The blue dotted line represents a ratio of consumed O to consumed H2 of 1. The corresponding H2-TPR profiles and H2 pulse and O2 pulse curves are shown in Fig. S10 and S11.† | ||
As the In/Al ratio rises to 1.0, the H2/In ratio determined from H2-TPR profiles reached 1.0, consistent with the result of the In-CHA(11, 1.0) catalyst. A H2/In ratio slightly lower than 1.0 from the H2 pulses is due to the dilution by the carrier gas when using H2 pulses as the reducing agent. Further increase of the In/Al ratio to 1.7 results in a lower H2/In ratio as determined from both H2-TPR profiles and H2 pulses; that is, the excess of In2O3 cannot be reduced completely, a result that is consistent with the detection of In(0) and In2O3 on the reduced In-CHA(12, 1.7) in XRD patterns (Fig. S6†). On In-CHA with different Si/Al ratios (Fig. 4a and S11†), the H2/In ratios are close to 1.0, confirming that In2O3 in the CHA zeolite can be reduced to replace BASs and form isolated In+ when In/Al ratios ≤ 1.0 (independently of the Si/Al ratio). A ratio between the formed H2O and consumed H2 close to 1.5 for these In-CHA samples evidences the stoichiometry of the reaction during reduction (Fig. S12†).
Note that the small increase in the ratio of the formed H2O to consumed H2 on In-CHA(12, 1.0) and In-CHA(12, 1.7) may result from the exchange of In2O3 with BASs in the presence of H2, forming [InO]+ and H2O. This process does not consume H2, but forms H2O. The exchange of In2O3 with BASs is minor at high temperature (600 °C) since the formed [InO]+ can be easily reduced to In+. Control experiments were conducted introducing H2 pulses at different temperatures (200 °C to 600 °C, in Fig. S13†). No significant H2 was consumed at or below 300 °C, but when the temperature was increased to 400 °C, the ratio of formed H2O to consumed H2 reached 5.9, much higher than 1.5. This suggests that a significant fraction of In2O3 was ion-exchanged with BASs to form [InO]+, accompanied by the formation of H2O without consuming H2 (third possible reaction of the reduction of In-CHA in Fig. 3b). As the temperature rises to 500 °C, the ratio decreased to 1.39 in the initial H2 pulses; this is an effect due to two reactions: In2O3 + 2H+ + 2H2 → 2In+ + 3H2O and [InO]+ + H2 → In+ + H2O. Further increase in temperature leads to a ratio between 1.0 and 1.5. It is concluded that different indium species were formed at different reduction temperatures. At 600 °C, In+ is the stable species upon reduction of the In-CHA catalysts. The subsequent O2 pulses on reduced In-CHA(x, y) also confirmed that In+ is easy to oxidize (Fig. S10 and S11†). The ratio of O/H2 was 1.0, showing that In3+ was reduced to In+ and then oxidized to In3+ (Fig. 4b).
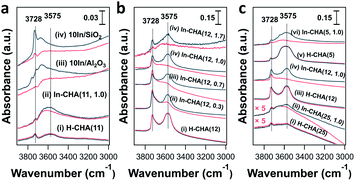
In situ FTIR spectroscopy reveals the consumption of BASs upon reduction of the In-CHA sample and clarifies the redox cycle of In-CHA catalysts in the presence of H2 or O2. For the H-CHA sample (without indium, Fig. 5a(i)), two peaks at 3728 cm−1 and 3575 cm−1 are assigned to the external silanol group (Si–OH) and bridge-OH groups (BAS), respectively. As expected, there is no significant change before and after H2 treatment (Fig. 5a(i) red and black traces). For In-CHA(11, 1.0), the spectrum of the dehydrated sample shows the same two peaks at 3728 cm−1 and 3575 cm−1, but upon reduction at 550 °C, there is a clear reduction of the intensity of the peak at 3575 cm−1, evidence of the consumption of BASs after reducing In-CHA(11, 1.0). Additionally, there is a significant increase in the intensity of the zeolite structure Si–O–Si band at 1900–2100 cm−1 (Fig. S14†), which might be due to the diffusion of a large amount of In2O3 located initially on the outer surface into the micropores and strong bonding of In(I) to the zeolite oxygen atoms.
Interestingly, the peak at 3575 cm−1 of the In-CHA(11, 1.0) catalyst did not disappear after reduction, and D2 was used to determine if this peak is associated with OH groups. We found that the silanol group and the extra-framework Al–OH groups were converted to the corresponding –OD groups after coming into contact with D2; however, the peak at 3575 cm−1 remains unmodified after D2 treatment at 550 °C (Fig. S15†); that is, this peak after reducing In-CHA(11, 1.0) is not from bridged-OH groups (i.e., BAS). Even for H-CHA(11), the peak at 3575 cm−1 still exists upon D2 treatment (Fig. S16†), suggesting that the observed peak may be unrelated to –OH groups. In the –OD region, there is no effect of D2versus H2 treatment between 1600 cm−1 and 2000 cm−1 (Fig. S15c†). The lack of indium hydride vibrations also suggests that the isolated In+ site—rather than [InH2]+—was the dominant species formed upon reducing In-CHA at 550 °C (Fig. S15c†). This is different from Ga/H-ZSM-5, where a significant GaHx band is formed upon reduction at 550 °C.45
In the samples of 10In/SiO2 and 10In/Al2O3, the hydroxyl group observed before reduction is largely consumed after reduction at 550 °C, a consequence of the replacement of the proton in these sites by In species. The examination of reduced In-CHA with varying In/Al ratios and Si/Al ratios by FTIR spectroscopy also supported the consumption of BASs by the indium species (Fig. 5b, c and S17†). Meanwhile, no InHx bands were observed on In-CHA(x, y) with varying Si/Al and In/Al ratios (x = 5, 12, and 25 and y = 0.3, 0.7 and 1.0, shown in Fig. S18–S22†), confirming that the only isolated In+ species were the stable In species in all In-CHA samples investigated.
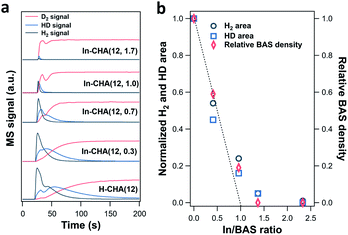
The lower H+ concentration in reduced In-CHA samples compared with H-CHA is additional evidence showing that In+ species rather than InHx were formed at 550 °C. Note that the sample was first reduced in a 10 vol% H2/N2 flow, followed by the purge of a pure N2 flow. Afterward, a 10 vol% D2/N2 flow was introduced to measure the H concentration of the sample (including H2 and HD, 2 amu and 3 amu, respectively). For H-CHA(12) (Fig. 6a), significant H2 (2 amu) and HD (3 amu) MS signals were observed upon switching to 10 vol% D2/N2, due to the H–D exchange of the surface H species when introducing D2 into H2-reduced H-CHA (see FTIR spectra in Fig. S15–S22†). Thus, the peak area of H2 (2 amu) and HD (3 amu) could be regarded as an indicator of the total H species on the samples.
The magnitude of the H2 and HD MS signals decreases gradually as the In/BAS ratio increases and almost disappears when the In/BAS ratio is 2.3 (corresponding to an In/Al ratio of 1.7, in Fig. S23†); that is, the addition of In to the CHA zeolite replaces the –OH group associated with BASs without forming indium hydrides (such as [InH2]+) since more H species should be observed if one mol BAS was converted to one mol [InH2]+. The subsequent switching from 10 vol% D2/N2 to 10 vol% H2/N2 shows consistent results: the D concentration decreases as the In/Al ratio rises (Fig. S23†). We measured the BAS density via ethylamine-TPD of In-CHA(12, y) (details are included in the ESI†). The relative BAS density vs. In/BAS ratio shows that one indium atom replaces one BAS, as concluded in the above discussions. The decreased H2/HD concentration is similar to the relative BAS concentration with the increase of the In/BAS ratio, suggesting that the former may be used as an estimate for the relative BAS concentration on the In-CHA system.
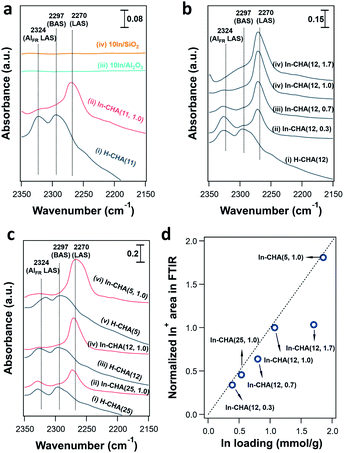
FTIR spectroscopy of d3-acetonitrile (CD3CN) adsorption provides information about the indium speciation of the reduced samples. In these experiments, the catalyst was reduced at 550 °C for 30 min in pure H2 and cooled down to 50 °C under vacuum, followed by the dosing of CD3CN. As shown in Fig. 7a, two peaks, at 2324 and 2297 cm−1, were observed on H-CHA(11), which were assigned to CD3CN adsorbed on extra-framework Al and BASs, respectively.49 This is consistent with the aluminum speciation determined from the 27Al MAS NMR spectra of the samples (Fig. S2†). Upon the introduction of H2 into In-CHA(11, 1.0), the peaks at 2324 and 2297 cm−1 almost disappeared, confirming the consumption of BASs after reduction. Instead, a peak at 2270 cm−1 appears, a signal attributed to the interactions of the nitrile group with Lewis acid sites (LASs). In the case of reduced In-CHA(11, 1.0), the LAS should be isolated In+ sites. For 10In/SiO2 and 10In/Al2O3, no well-defined peaks were observed upon CD3CN adsorption on the reduced sample. This is attributed to the formation of In(0), as observed in the corresponding XRD patterns and the pulse reactor experiments. For In-CHA (Si/Al = 12) with varying In/Al ratios, the peak intensity of isolated In+ species increases linearly as the In/Al ratio rises from 0.3 to 1.0 and stays constant with a further increase of the In/Al ratio to 1.7 (Fig. 7d); that is, the In+ density is related to the In loading and no more In+ species are formed when the BASs were replaced completely. A higher In+ species concentration is also observed on In-CHA(5, 1.0) (Fig. 7c and d) due to the higher In loadings.
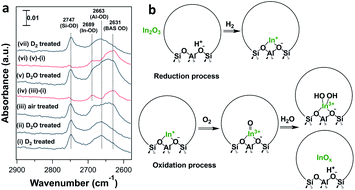
In situ FTIR spectroscopy of the reduced and oxidized samples shows quantitative and reproducible oxidation/reduction of the In cation in In-CHA(11, 1.0). We introduced D2 and D2O to facilitate the investigation of the reduction and oxidation of the sample. As shown in Fig. 8, two peaks at 2747 and 2643 cm−1 were observed upon D2 introduction (see Fig. S15†). When introducing D2O, there are no significant changes on the spectrum; that is, reduced In+ sites do not react with D2O to form In-OD, clearly different from Ga/H-ZSM-5 where reduced Ga+ was easy to oxidize to form Ga-OH at 550 °C with H2O.45 Upon coming into contact with dry air, the BAS OD group (2631 cm−1) re-appears, a result of the regeneration of BASs when isolated In+ was oxidized by air. From the difference spectrum (Fig. 8a(iv)), a peak at 2689 cm−1 is now observed and accompanied by the regeneration of BASs. The peak at 2689 cm−1 could be assigned to the In-OD group considering that the peak position is higher than the BAS O-D group and extra-framework Al-OD group. The introduction of D2O again regenerates BASs, likely due to the hydrolysis of [InO]+ and the formation of BASs. Subsequently, the introduction of D2 and quantification of the number of consumed In-OD and BAS OD groups (Fig. 8(vii)) show reversibility between the reduced and oxidized states of the sample.
It follows that on a calcined sample, In2O3 located on the external surface of the CHA zeolite was reduced and diffused into the micropores in the presence of H2 at high temperature, displacing BASs and forming isolated In+ sites. The O2 treatment of the reduced In species leads to the formation of [InO]+ and [In(OH)2]+ and regeneration of BASs (Fig. 8b). H2 pulses on the H2-O2 treated In-CHA(11, 1.0) are consistent with the proposed oxidation state of isolated In+ sites (Fig. S24†). The low ratio of formed H2O/consumed H2 (∼0.25) is interpreted as the result of the reaction of H2O—formed in the early portion of the catalyst bed—with [InO]+ in the back end of the catalyst bed, a result consistent with the in situ FTIR spectra (Fig. 8a). Overall, the ratio of formed H2O/consumed H2 during the entire experiment was estimated to be 1.1; that is, the main oxidized species was [InO]+, as supported by XRD that revealed no In2O3 diffraction peaks detected on H2-O2 treated In-CHA(11, 1.0) (Fig. S25†).
Propane dehydrogenation mechanism on isolated In+ sites
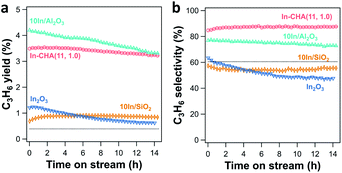
PDH catalytic rates and selectivity were measured on the reduced In-based catalyst. Calcined catalysts were reduced in 10 vol% H2 for 30 min at 600 °C before the introduction of 2.54 kPa C3H8 (balancing N2). At comparable conversion (<6%), In-CHA shows better stability than In2O3, 10In/SiO2 and 10In/Al2O3. There is no significant decrease of the C3H6 yield over 14 hours (Fig. 9a). A long-term test of the 10In/Al2O3 sample (Fig. S26†) shows that the C3H6 yield keeps decreasing within a time on stream of 65 hours, evidencing that indium supported on Al2O3 exhibited poor stability for propane dehydrogenation. Isolated In+ sites in In-CHA(11, 1.0) show good C3H6 selectivity (∼85%) at 600 °C (Fig. 9b), higher than the selectivity exhibited by the other samples. The higher reaction rates on 10In/Al2O3 might be due to bare γ-Al2O3 since it has been shown that (bare) γ-Al2O3 catalyzes propane dehydrogenation.50 A control experiment conducted on bare γ-Al2O3 found that indeed this sample displays higher catalytic rates and C3H6 selectivity than 10In/Al2O3 (Fig. S27†). Compared with the inert SiO2 support, 10In/SiO2 shows a higher C3H6 yield and similar C3H6 selectivity (∼55%) (Fig. S28†). The reduction in the C3H6 yield with time is attributed to the gradual reduction of In2O3 to In(0), evidenced by the negligible reactivity exhibited by In2O3 after being reduced for 8 hours (Fig. S29†). H2O formation quantification and XRD measurements support that In2O3 was completely reduced to In(0) after 8 hours of reduction (Fig. S29†). Considering the occurrence of the thermal cracking reaction of propane, we tested the empty tube for propane dehydrogenation (C3H8 partial pressure 2.54 kPa with balancing N2). The C3H6 yield and selectivity were 0.39% and 60%, respectively (see Fig. 9, dotted line). We then corrected the propane dehydrogenation reaction rate and cracking rate by subtracting the product derived from thermal cracking (see Fig. S30†). As expected, a small reduction in reaction rates was observed when considering the thermal cracking. The C3H6 selectivity increased from 85% to 88% for the In-CHA catalyst, while the C3H6 selectivity of 10In/Al2O3 increased from 77% to 79%. For 10In/SiO2 and In2O3 catalysts, there is no significant change in the C3H6 selectivity when subtracting the thermal cracking products, which might result from the similar C3H6 selectivity (∼60%) of those catalysts with the thermal cracking reaction. Thus, we conclude that the CHA zeolite shows better stability and C3H6 selectivity than indium on the other supports investigated.We also examined the propane dehydrogenation reaction rate on the parent H-CHA (without indium); this catalyst shows higher catalytic rates than In-CHA(11, 1.0), and however, the rates decrease monotonically over time (Fig. S31†). In addition, the C3H6 selectivity of H-CHA(11) is much lower, approximately 20% (Fig. S31†), than that on In-CHA(11, 1.0) (∼85%). This observation confirms that In-CHA is stable and selective for the non-oxidative dehydrogenation of propane to propylene reaction while H-CHA favors propane cracking and has poor stability.
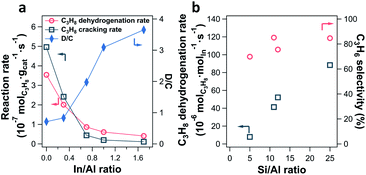
The impact of the In/Al ratio and Si/Al ratio of In-CHA catalysts on the PDH performance has also been examined (Fig. 10). With the increase of the In/Al ratio to 1.7 on the In-CHA (Si/Al = 12) catalyst, several interesting trends were observed: (1) the initial activity including C3H8 dehydrogenation and C3H8 cracking decreases; (2) the ratio between the C3H8 dehydrogenation and C3H8 cracking increases monotonically; (3) the catalyst exhibits better stability over 10 hours of testing (Fig. S32†). These observations are consistent with the results on H-CHA(11) and In-CHA(11, 1.0), showing that the addition of In could increase the C3H6 selectivity by replacing BASs. The lower reactivity of In-CHA compared with H-CHA is due to the weak intrinsic activity of isolated In+ species than BASs. Interestingly, the C3H8 dehydrogenation rate normalized to In loading declines as the Si/Al ratio decreases (Fig. 10b and S33†). In particular, the C3H8 dehydrogenation rate decreased from 88 μmolC3H8 molIn−1 s−1 for In-CHA(25, 1.0) to 7.9 μmolC3H8 molIn−1 s−1 for In-CHA(5, 1.0).
Earlier we showed that for In/Al ratios ≤ 1.0, In2O3 could be reduced to isolated In+ species, independent of Si/Al ratios. This excludes the possibility that a low concentration of In+ in In-CHA(5, 1.0) results in the decrease of In-normalized PDH rates. Considering that a cage of zeolite CHA contains more BASs as the Si/Al ratios decrease, it is more likely to form multi-nuclear In+ sites in one cage (or In+–In+ sites) at low Si/Al ratios. These multi-nuclear species are detrimental to propane conversion and thus decrease the In-normalized rates compared with the case of one cage containing one In+ at high Si/Al ratios. The significant decrease of the micropore volume of In-CHA(5, 1.0) upon reduction compared with the reduced In-CHA(25, 1.0) catalyst (0.15 versus 0.29 cm3 g−1, Table S1†) shows that In species occupy a good fraction of the micropore space on reduced In-CHA(5, 1.0). For H-CHA with varying Si/Al ratios, the BAS-normalized C3H8 dehydrogenation rates are close to each other (approximately 280–370 molC3H8 molBAS−1 s−1) and C3H6 selectivity is between 30% and 50% (Fig. S34 and S35†), showing similar C3H8 dehydrogenation performance on CHA with varying BAS densities.
We prepared as a benchmark a PtSn/Al2O3 catalyst (1%Pt and 2.6%Sn) using incipient wetness impregnation.51 As shown in Fig. S36,†the PtSn/Al2O3 catalyst showed a high initial C3H6 yield (30%) and deactivated quickly within a time on stream of 5 hours, although the C3H6 yield decreased slowly in the following 30 hours. The C3H6 selectivity decreased from 97% to 91% within a time on stream of 35 hours. The deactivation trend is consistent with the results reported in ref. 51. We calculated the Pt normalized reaction rate (TOFPt) based on the C3H6 yield at TOS = 10 h (TOFPt = 6.9 mmolC3H8 molPt−1 s−1). This value of TOFPt is 78 times higher than TOFIn determined on In-CHA(12, 1.0). Although In+ sites show a lower intrinsic reaction rate, it has better stability than PtSn/Al2O3.
Apparent activation energies (Eapp) for the PDH reaction on the reduced catalyst were estimated using an Arrhenius plot in the temperature range of 580–620 °C. On H-CHA(11), the Eapp of the C3H8 dehydrogenation and cracking reactions was 172 kJ mol−1 and 130 kJ mol−1 (Table 2). The lower Eapp for C3H8 cracking is typical for BASs since these sites favor cracking.41
| Sample | C3H8 dehydrogenation Eapp (kJ mol−1) | C3H8 cracking Eapp (kJ mol−1) |
|---|---|---|
| In2O3 | 143 ± 4.0 | 133 ± 3.8 |
| 10In/SiO2 | 179 ± 8.5 | 135 ± 7.4 |
| 10In/Al2O3 | 69.5 ± 11.4 | 200 ± 3.9 |
| In-CHA(11, 1.0) | 94.3 ± 0.6 | 206 ± 11 |
| H-CHA(11) | 172 ± 2.7 | 130 ± 6.0 |
| H-CHA(12) | 190 ± 1.5 | 177 ± 1.8 |
| In-CHA(12, 0.3) | 188 ± 16 | 177 ± 12 |
| In-CHA(12, 0.7) | 149 ± 5.6 | 212 ± 3.0 |
| In-CHA(12, 1.0) | 109 ± 0.8 | 198 ± 1.5 |
| In-CHA(12, 1.7) | 125 ± 14 | 167 ± 19 |
| H-CHA(25) | 223 ± 2.0 | 206 ± 3.0 |
| In-CHA(25, 1.0) | 109 ± 1.5 | 265 ± 28 |
| H-CHA(5) | 180 ± 0.7 | 174 ± 3.2 |
| In-CHA(5, 1.0) | 187 ± 8.8 | 233 ± 6.4 |
The In-containing samples have, in contrast, much lower propane dehydrogenation Eapp and higher propane cracking Eapp (Table 2). The gradual decrease of Eapp for C3H8 dehydrogenation on In-CHA(12, 1.0) from 190 to 109 kJ mol−1 as the In/Al ratio increases from 0 to 1.0 is consistent with the fact that In+ dominates the reaction since the BAS density decreases, although it slightly increases as the In/Al ratio is increased to 1.7. A similar Eapp for C3H8 dehydrogenation on In-CHA(25, 1.0) was observed and an even higher Eapp for C3H8 dehydrogenation was found on In-CHA(5, 1.0), which evidenced that multi-nuclear In+ sites in one cage (or In+–In+ sites) are less effective than single sites.
In summary, isolated In+ sites in the CHA zeolite favor dehydrogenation over cracking under all the conditions investigated. These observations are consistent with the high C3H6 selectivity on the In-CHA(11, 1.0) catalyst. On In2O3 and 10In/SiO2 catalysts, both samples show higher Eapp of C3H8 dehydrogenation than the C3H8 cracking reaction (Table 2), which is consistent with the lower C3H6 selectivity (∼50%) on the catalyst. Although lower Eapp of C3H8 dehydrogenation and higher C3H8 cracking reaction were observed on 10In/Al2O3, the measured reaction rates were mainly the contribution of the γ-Al2O3 support.
The turnover frequency (TOF) and pre-exponential factor were calculated over the In-CHA catalyst for propane dehydrogenation at 600 °C assuming that all the In is equally reactive. For In-CHA(11, 1.0), entropy changes of formation of the transition state for propane dehydrogenation are estimated based on transition state theory,18 and determined to be −207 J mol−1 K−1 (Table S4†). The obtained entropy changes are larger than the values reported on H-[Fe]ZSM-5 (−155 J mol−1 K−1) towards propane dehydrogenation.18 This large negative entropy reflects that the transition state is geometrically constrained due to the small cage of the CHA zeolite. Similar trends are observed on In-CHA(25, 1.0) and In-CHA(12, 1.0); however, the quite distinct entropy changes of the transition state formation indicate the presence of a different active site on In-CHA(5, 1.0).
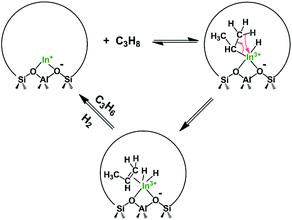
For In-CHA, the C3H8 reaction order was 0.77 for dehydrogenation and 0.93 for cracking, close to the first order for both reaction channels (Fig. 11a). In addition, the reaction order on H2 is close to 0 (Fig. 11b); that is, H2 is likely not part of the rate-determining step. These values are consistent with the reaction order values in In-CHA for ethane dehydrogenation.33 These reaction orders can be rationalized by the following mechanisms: the propane C–H bond is initially dissociated through an oxidative addition process by isolated In+ to form [HIn(III)-C3H7]+ species. This step is followed by H-beta elimination with the formation of a metastable [H2In(III)-C3H6]+ intermediate. The catalytic cycle is closed by the desorption of C3H6, and the reductive elimination of H2 to form In+ (Scheme 1). The reaction order of ∼1 for C3H8 and ∼0 for H2 point to the first step as the rate-determining step.
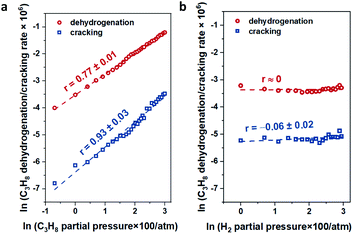 | ||
| Fig. 11 The dependence of propane dehydrogenation and cracking reactions on (a) propane partial pressure and (b) H2 partial pressure over the In-CHA(11, 1.0) catalyst at 600 °C. | ||
TG analysis of the spent catalyst illustrates the high stability of the In-CHA(11, 1.0) catalyst. After a time-on-stream of 14 hours, the samples show only a small amount of coke formation (∼2.4%, Fig. S37†), a value lower than that on the H-CHA(11) catalyst, confirming that the deactivation of the H-CHA catalyst is mainly due to the formation of coke and that an isolated In+ site is less prone to coke formation reactions. There may be a steric contribution to catalysis on In-CHA compared with H-CHA, considering that the available micropore volume on reduced In-CHA is lower than that on the parent H-CHA (Table S1†). Another possibility is that propylene adsorbs more strongly on H+ sites than In+ sites (i.e., has higher heats of adsorption). As shown in Fig. S38,† upon introducing C3H6 on the H-CHA catalyst surface, significant consumption of BASs (3575 cm−1) is observed. Upon evacuation of C3H6, a strong signal associated with hydrocarbon species centered at 3055 cm−1 is detected,36 showing that C3H6 has a strong interaction with BASs and forms stable hydrocarbon species, which could lead to coke formation. No stable hydrocarbon species are observed when introducing C3H8 and C3H6 on the reduced In-CHA(12, 1.0), showing that In+ has a weak interaction with C3H8 and C3H6, which is also a reason for the low formation rate of coke. XRD measurements on the spent catalyst confirmed that no significant structural change occurred on the CHA catalysts, or on the reduced samples (Fig. S39†). It is worth noting that the relative intensities between the diffraction peaks at ∼9° and ∼21° decreased on In-CHA samples compared with H-CHA, suggesting that the formed extra-framework In+ sites are stable after the propane dehydrogenation reaction. On the spent In2O3 sample, there is an overall increase in the sample weight during TGA, attributed to the oxidation of In(0) to indium oxide. This is consistent with the results presented above showing that In(0) is present on the reduced In2O3 catalyst. The slight decrease of the weight on 10In/SiO2 and 10In/Al2O3 results from the combined effect of the two processes: oxidation of In(0) to indium oxide and removal of formed coke.
Main-group compounds containing a group 13 metal (I) compound (M = Al, Ga, In) have been prepared for oxidative addition and reductive elimination reactions of strong single bonds such as X–H σ bonds (X = H, C, Si, P, etc.). These are key steps in catalytic cycles and are frequently observed in organometallic transition-metal chemistry.52 These highly reactive compounds with low oxidation states have been shown to possess high-energy lone pairs and available empty (usually π-antibonding) orbitals, thereby mimicking the state of electrons observed in transition-metal compounds. For instance, Seifert et al.53 found that the gallium(I) complex [Ga({N(dipp)CMe}2CH)] (dipp = 2,6- diisopropylphenyl) undergoes facile oxidative addition reactions with various element–hydrogen bonds at relatively low temperature (−78 to 25 °C). Beachley et al.54 reported that organoindium compounds NaIn(CH2SiMe3)2 with indium in the +1 oxidation state could be prepared from In(CH2SiMe3)3 and NaH via a reductive elimination reaction with Si(CH3)4 as another product. These examples suggest that main-group compounds with low oxidation states can catalyze C–H bond scission via oxidative addition and reductive elimination processes. In this case, In+ in the CHA zeolite could be regarded as an analogue of an In(I) molecular complex, which catalyzes propane dehydrogenation first through the oxidative addition of propane to form [HIn(III)-C3H7] species, and then proceeds via H-beta elimination with the formation of an [H2In(III)-C3H6] intermediate, and the cycle is closed by the desorption of C3H6 and the reductive elimination of H2 to form In+ (Scheme 1). Our findings are a good example of the connection between the chemistry of metals in extra-framework positions and the molecular chemistry of main-group elements like In and Ga. This line of thought may be a fruitful avenue to identify novel catalytic applications of these materials and other main-group elements supported on acidic zeolites.
Conclusions
This report shows that CHA zeolites stabilize In in the +1 oxidation state as isolated species in extra-framework positions, independent of In/Al ratios and Si/Al ratios. In contrast, In/SiO2, In/Al2O3 and In2O3 form substantial amounts of In(0) upon reduction in H2. In-CHA shows quantitative and reproducible redox cycles by sequentially exposing the sample to sets of O2 and H2 pulses producing first mixtures of InO+ and (In(OH)2)+ and then In+ upon reduction. In+ in CHA zeolites catalyzes propane dehydrogenation with a C3H6 selectivity of ∼85%, with minor propane cracking to methane and ethylene. Coke formation is minimal (<2.5% w/w) over a period of 14 h. The dehydrogenation selectivity over In-CHA is much higher than the selectivity observed over In/SiO2, In/Al2O3 and bulk In2O3. The mechanism of the propane dehydrogenation reaction seems to proceed through a sequence of oxidative addition, beta-H elimination, and reductive elimination of a (postulated) dihydride indium intermediate, based on the reaction rate orders with respect to propane and hydrogen obtained at low conversions. There are clear analogies between the observed chemistry of In+ in CHA zeolite and In+ organometallic complexes.Data availability
All data needed to evaluate the conclusions in the paper are present within the article or in the ESI file.† Additional data related to this paper may be requested from the authors.Author contributions
Y. Y. and R. F. L. conceived the research project. Y. Y. conducted the experiments. Y. Y. and R. F. L. analyzed data and wrote the paper. All authors have given approval of the final version of the manuscript.Conflicts of interest
There are no conflicts to declare.Acknowledgements
We acknowledge the support by the RAPID manufacturing institute, USA, supported by the Department of Energy (DOE) Advanced Manufacturing Office (AMO), award number DE-EE0007888-6.5. Y. Y. also acknowledges the support of the US National Science Foundation under the grant number of CBET-1803246. We thank Prof. B. J. Xu (Peking U.) for helpful suggestions on the manuscript.Notes and references
- J. J. H. B. Sattler, J. Ruiz-Martinez, E. Santillan-Jimenez and B. M. Weckhuysen, Chem. Rev., 2014, 114, 10613–10653 CrossRef CAS PubMed
.
- Y. He, Y. Song and S. Laursen, ACS Catal., 2019, 9, 10464–10468 CrossRef CAS
.
- T. Bauer, S. Maisel, D. Blaumeiser, J. Vecchietti, N. Taccardi, P. Wasserscheid, A. Bonivardi, A. Görling and J. Libuda, ACS Catal., 2019, 9, 2842–2853 CrossRef CAS PubMed
.
- N. Raman, S. Maisel, M. Grabau, N. Taccardi, J. Debuschewitz, M. Wolf, H. Wittkämper, T. Bauer, M. Wu, M. Haumann, C. Papp, A. Görling, E. Spiecker, J. Libuda, H. Steinrück and P. Wasserscheid, ACS Catal., 2019, 9, 9499–9507 CrossRef CAS PubMed
.
- Y. He, Y. Song, D. A. Cullen and S. Laursen, J. Am. Chem. Soc., 2018, 140, 14010–14014 CrossRef CAS PubMed
.
- K. Searles, K. W. Chan, J. A. Mendes Burak, D. Zemlyanov, O. Safonova and C. Copéret, J. Am. Chem. Soc., 2018, 140, 11674–11679 CrossRef CAS PubMed
.
- M. Raad, A. Astafan, S. Hamieh, J. Toufaily, T. Hamieh, J. D. Comparot, C. Canaff, T. J. Daou, J. Patarin and L. Pinard, J. Catal., 2018, 365, 376–390 CrossRef CAS
.
- K. Searles, G. Siddiqi, O. V. Safonova and C. Copéret, Chem. Sci., 2017, 8, 2661–2666 RSC
.
- W. Kim, J. So, S. Choi, Y. Liu, R. S. Dixit, C. Sievers, D. S. Sholl, S. Nair and C. W. Jones, Chem. Mater., 2017, 29, 7213–7222 CrossRef CAS
.
- J. J. H. B. Sattler, I. D. Gonzalez-Jimenez, L. Luo, B. A. Stears, A. Malek, D. G. Barton, B. A. Kilos, M. P. Kaminsky, T. W. G. M. Verhoeven, E. J. Koers, M. Baldus and B. M. Weckhuysen, Angew. Chem., Int. Ed., 2014, 53, 9251–9256 CrossRef CAS PubMed
.
- N. M. Schweitzer, B. Hu, U. Das, H. Kim, J. Greeley, L. A. Curtiss, P. C. Stair, J. T. Miller and A. S. Hock, ACS Catal., 2014, 4, 1091–1098 CrossRef CAS
.
- S. M. T. Almutairi, B. Mezari, P. C. M. M. Magusin, E. A. Pidko and E. J. M. Hensen, ACS Catal., 2012, 2, 71–83 CrossRef CAS
.
- C. Chen, S. Zhang, Z. Wang and Z.-Y. Yuan, J. Catal., 2020, 383, 77–87 CrossRef CAS
.
- Y. Dai, J. Gu, S. Tian, Y. Wu, J. Chen, F. Li, Y. Du, L. Peng, W. Ding and Y. Yang, J. Catal., 2020, 381, 482–492 CrossRef CAS
.
- M. Moselage, J. Li and L. Ackermann, ACS Catal., 2016, 6, 498–525 CrossRef CAS
.
- S. Tan, B. Hu, W. Kim, S. H. Pang, J. S. Moore, Y. Liu, R. S. Dixit, J. G. Pendergast, D. S. Sholl, S. Nair and C. W. Jones, ACS Catal., 2016, 6, 5673–5683 CrossRef CAS
.
- J. H. Yun and R. F. Lobo, J. Catal., 2014, 312, 263–270 CrossRef CAS
.
- J. H. Yun and R. F. Lobo, J. Phys. Chem. C, 2014, 118, 27292–27300 CrossRef CAS
.
- Z. Zhao, T. Wu, C. Xiong, G. Sun, R. Mu, L. Zeng and J. Gong, Angew. Chem., Int. Ed., 2018, 57, 6791–6795 CrossRef CAS PubMed
.
- Y. Xie, R. Luo, G. Sun, S. Chen, Z. Zhao, R. Mu and J. Gong, Chem. Sci., 2020, 11, 3845–3851 RSC
.
- N. Kong, X. Fan, F. Liu, L. Wang, H. Lin, Y. Li and S. Lee, ACS Nano, 2020, 14, 5772–5779 CrossRef CAS PubMed
.
- Y. Gu, H. Liu, M. Yang, Z. Ma, L. Zhao, W. Xing, P. Wu, X. Liu, S. Mintova, P. Bai and Z. Yan, Appl. Catal., B, 2020, 274, 119089 CrossRef CAS
.
- Y. Zhang, Y. Zhao, T. Otroshchenko, H. Lund, M. Pohl, U. Rodemerck, D. Linke, H. Jiao, G. Jiang and E. V. Kondratenko, Nat. Commun., 2018, 9, 3794 CrossRef PubMed
.
- T. Otroshchenko, V. A. Kondratenko, U. Rodemerck, D. Linke and E. V. Kondratenko, J. Catal., 2017, 348, 282–290 CrossRef CAS
.
- T. Otroshchenko, S. Sokolov, M. Stoyanova, V. A. Kondratenko, U. Rodemerck, D. Linke and E. V. Kondratenko, Angew. Chem., Int. Ed., 2015, 54, 15880–15883 CrossRef CAS PubMed
.
- Z.-P. Hu, C. Chen, J.-T. Ren and Z.-Y. Yuan, Appl. Catal., A, 2018, 559, 85–93 CrossRef CAS
.
- Z.-P. Hu, H. Zhao, C. Chen and Z.-Y. Yuan, Catal. Today, 2018, 316, 214–222 CrossRef CAS
.
- S. Y. Yu, G. J. Yu, W. Li and E. Iglesia, J. Phys. Chem. B, 2002, 106, 4714–4720 CrossRef CAS
.
- W. Li, S. Y. Yu, G. D. Meitzner and E. Iglesia, J. Phys. Chem. B, 2001, 105, 1176–1184 CrossRef CAS
.
- J. A. Biscardi, G. D. Meitzner and E. Iglesia, J. Catal., 1998, 179, 192–202 CrossRef CAS
.
- M. W. Schreiber, C. P. Plaisance, M. Baumgärtl, K. Reuter, A. Jentys, R. Bermejo-Deval and J. A. Lercher, J. Am. Chem. Soc., 2018, 140, 4849–4859 CrossRef CAS PubMed
.
- N. M. Phadke, E. Mansoor, M. Bondil, M. Head-Gordon and A. T. Bell, J. Am. Chem. Soc., 2019, 141, 1614–1627 CrossRef CAS PubMed
.
- Z. Maeno, S. Yasumura, X. Wu, M. Huang, C. Liu, T. Toyao and K. Shimizu, J. Am. Chem. Soc., 2020, 142, 4820–4832 CrossRef CAS PubMed
.
- Z. Maeno, X. Wu, S. Yasumura, T. Toyao, Y. Kanda and K. Shimizu, Catalysts, 2020, 10, 807 CrossRef CAS
.
- L. Andrews and X. Wang, Angew. Chem., Int. Ed., 2004, 43, 1706–1709 CrossRef CAS PubMed
.
- Y. Yuan, C. Brady, R. F. Lobo and B. Xu, ACS Catal., 2021, 11, 10647–10659 CrossRef CAS
.
- N. M. Phadke, E. Mansoor, M. Head-Gordon and A. T. Bell, ACS Catal., 2021, 11, 2062–2075 CrossRef CAS
.
- V. I. Hart, M. B. Bryant, L. G. Butler, X. Wu and K. M. Dooley, Catal. Lett., 1998, 53, 111–118 CrossRef CAS
.
- S. Tan, L. B. Gil, N. Subramanian, D. S. Sholl, S. Nair, C. W. Jones, J. S. Moore, Y. Liu, R. S. Dixit and J. G. Pendergast, Appl. Catal., A, 2015, 498, 167–175 CrossRef CAS
.
- S. Tan, S. Kim, J. S. Moore, Y. Liu, R. S. Dixit, J. G. Pendergast, D. S. Sholl, S. Nair and C. W. Jones, ChemCatChem, 2016, 8, 214–221 CrossRef CAS
.
- J. H. Yun and R. F. Lobo, Catal. Sci. Technol., 2015, 5, 264–273 RSC
.
- B. Ipek, M. J. Wulfers, H. Kim, F. Göltl, I. Hermans, J. P. Smith, K. S. Booksh, C. M. Brown and R. F. Lobo, ACS Catal., 2017, 7, 4291–4303 CrossRef CAS
.
- T. D. Pham, M. R. Hudson, C. M. Brown and R. F. Lobo, ChemSusChem, 2014, 7, 3031–3038 CrossRef CAS PubMed
.
- J. A. Loiland and R. F. Lobo, J. Catal., 2014, 311, 412–423 CrossRef CAS
.
- Y. Yuan, C. Brady, L. Annamalai, R. F. Lobo and B. Xu, J. Catal., 2021, 393, 60–69 CrossRef CAS
.
- G. D. Meitzner, E. Iglesia, J. E. Baumgartner and E. S. Huang, J. Catal., 1993, 140, 209–225 CrossRef CAS
.
- R. Dupree, M. H. Lewis and M. E. Smith, J. Appl. Crystallogr., 1988, 21, 109–116 CrossRef CAS
.
- A. Kentgens, K. Scholle and W. S. Veeman, J. Phys. Chem., 1983, 87, 4357–4360 CrossRef CAS
.
- H. J. Cho, D. Kim and B. Xu, ACS Catal., 2020, 10, 4770–4779 CrossRef CAS
.
- D. Zhao, H. Lund, U. Rodemerck, D. Linke, G. Jiang and E. V. Kondratenko, Catal. Sci. Technol., 2021, 11, 1386–1394 RSC
.
- A. H. Motagamwala, R. Almallahi, J. Wortman, V. O. Igenegbai and S. Linic, Science, 2021, 373, 217–222 CrossRef CAS PubMed
.
- T. Chu and G. I. Nikonov, Chem. Rev., 2018, 118, 3608–3680 CrossRef CAS PubMed
.
- A. Seifert, D. Scheid, G. Linti and T. Zessin, Chem.–Eur. J., 2009, 15, 12114–12120 CrossRef CAS PubMed
.
- O. T. Beachley Jr and R. N. Rusinko, Inorg. Chem., 1981, 20, 1367–1370 CrossRef
.
Footnote |
| † Electronic supplementary information (ESI) available. See DOI: 10.1039/d1sc05866e |
| This journal is © The Royal Society of Chemistry 2022 |

