 Open Access Article
A photo-switchable molecular capsule: sequential photoinduced processes†
Manjiri
Choudhari
a,
Jingjing
Xu
ab,
Alasdair I.
McKay
 a,
Clément
Guerrin
 c,
Craig
Forsyth
 a,
Howard Z.
Ma
d,
Lars
Goerigk
 d,
Richard A. J.
O'Hair
 d,
Antoine
Bonnefont
e,
Laurent
Ruhlmann
 e,
Stephane
Aloise
c and
Chris
Ritchie
 *a
*a
aSchool of Chemistry, Monash University, Clayton, Victoria 3800, Australia. E-mail: chris.ritchie@monash.edu
bCollege of Chemistry and Materials Science, Shanghai Normal University, Shanghai 200234, China
cUniversité de Lille, CNRS, UMR 8516 – LASIRE – Laboratoire de Spectroscopie pour les Interactions, la Réactivité et l’Environnement, Lille F-59000, France
dSchool of Chemistry, University of Melbourne, Melbourne, 3010, Victoria, Australia
eLaboratoire d’Electrochimie et Chimie Physique du Corps Solide, Institut de Chimie de Strasbourg, UMR 7177 CNRS-Université de Strasbourg, 4, rue Blaise Pascal, Strasbourg 67000, France
First published on 24th October 2022
Abstract
The metastable trilacunary heteropolyoxomolybdate [PMo9O31(py)3]3− – {PMo9}; py = pyridine) and the ditopic pyridyl bearing diarylethene (DAE) (C25H16N2F6S2) self-assemble via a facile ligand replacement methodology to yield the photo-active molecular capsule [(PMo9O31)2(DAE)3]6−. The spatial arrangement and conformation of the three DAE ligands are directed by the surface chemistry of the molecular metal oxide precursor with exclusive ligation of the photo-active antiparallel rotamer to the polyoxometalate (POM) while the integrity of the assembly in solution has been verified by a suite of spectroscopic techniques. Electrocyclisation of the three DAEs occurs sequentially and has been investigated using a combination of steady-state and time-resolved spectroscopies with the discovery of a photochemical cascade whereby rapid photoinduced ring closure is followed by electron transfer from the ring-closed DAE to the POM in the latent donor–acceptor system on subsequent excitation. This interpretation is also supported by computational and detailed spectroelectrochemical analysis. Ring-closing quantum yields were also determined using a custom quantum yield determination setup (QYDS), providing insight into the impact of POM coordination on these processes.
Introduction
Photostimulated changes in molecular and electronic structure are ubiquitous in nature with the underlying processes intriguing and mystifying scientists to the present day. The design and realisation of chemical systems that mimic or replicate these complex stimuli-responsive functions remain a significant challenge.1,2 Photochromic compounds i.e., compounds that display a reversible change in colouration in response to electromagnetic radiation, are particularly important in this research area and are also increasingly finding utility in technologically relevant applications.3–5 Amongst the various classes of photochromes are the diarylethenes (DAEs), molecules that can be chemically tuned to yield species with exceptional thermal stability observed for both photoisomers, desirable ground, and excited-state properties alongside high photochemical yields.6,7 The incorporation of these chromophores into materials, including polymers, nanomaterials, and self-assembled coordination complexes, has led to the report of complex light-driven solution-state dynamics, changes in mechanical strength, actuation, and even the control of organisms' motor function through the perturbation of molecular and electronic structure in response to light.8–11Polyoxometalates (POMs) are molecular metal oxides composed of predominantly early transition metals in high oxidation states, however, there are now numerous exceptions.12,13 The remarkable structural, compositional, and resulting electronic diversity of POMs is undeniable and is responsible for these compounds attracting general interest across the sciences from phasing agents in protein crystallography to electroactive components in photovoltaic and electrochromic devices.14,15 They are, however, most well-known for their catalytic activity due to their rich acid–base and redox chemistry, with an increased emphasis on their utility as photo-catalysts due to their effective redox mediation.16–19 Until recently, the underlying photophysics associated with this behaviour had been somewhat neglected with time-resolved spectroscopic studies on the (fs-ns) time domains being scarcely reported. Significant steps to address this deficiency have been made by the groups of Izzet, Gibson, Proust, Streb and Dietzek amongst others.20–23 In contrast the photochemical dynamics of diarylethenes (DAEs) are well-documented,24,25 however, the absence of hybrid DAE-POM materials in the literature has to date precluded their study, except for our prior report and a recent solid-state investigation by Dessapt et al. Prior studies conducted on photochromic spiropyran POM hybrids and the report that [PMo9O31(py)3]3− – {PMo9} can be utilised as a precursor for the preparation of organically functionalised lacunary phosphomolybdates served as inspiration for this work.26–28
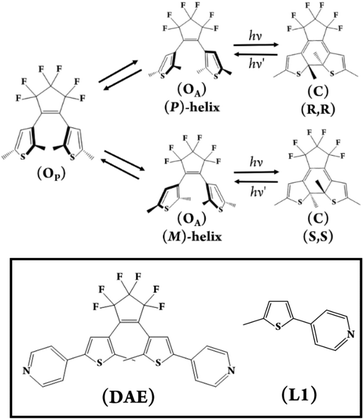
Intrigued by the opportunity that the combination of DAEs and POMs in a molecular assembly would present to investigate this balance of photochemical processes, we designed and prepared the photochromic molecular capsule [(PMo9O31)2(DAE)3]6− – (1) reported herein (Fig. 1 and 2). In this article, we rationalise our experimental findings in terms of the stability of (1) and the photochemical behaviour of the capsule (1) following UV excitation. Due to the complexity of the molecular assembly, the nomenclature (1(OA)x(OP)y(C)z; x + y + z = 3) will be used throughout to describe the various potential states which are defined in (Fig. 2), while (1) will be used in general discussion.
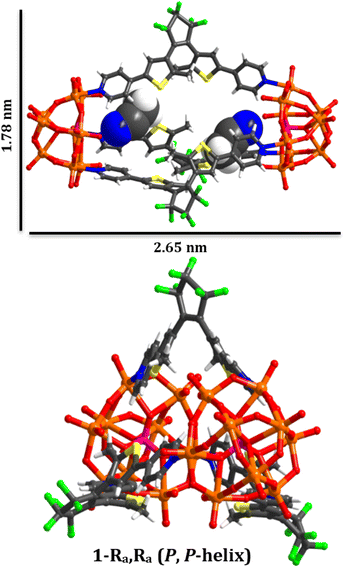 | ||
| Fig. 1 Graphical representation of the chiral molecular capsule (1(OA)3) with dimensions obtained from single crystal X-ray diffraction structure determination. | ||
Results and discussion
In this study, we have utilised the precise surface chemistry and ligand exchange properties of {PMo9}26 to yield the photochromic molecular capsule (1) through the exchange of the pyridyl ligands on the precursor polyanion with the ditopic ligand (DAE) (Fig. 1 and 2). (1) can be isolated as a crystalline product using either tetrabutylammonium (TBA) or tetraphenylphosphonium (TPP) cations to yield (TBA)6(1) and (TPP)6(1) in 62% and 43% yield, respectively. Synthetic details are provided in the ESI.† Crystals suitable for structure determination using single-crystal X-ray diffraction were obtained for both samples. However, the (TPP)6(1) sample was of superior quality with the structure of this compound reported and discussed herein (CCDC 2173175).Uncoordinated diarylethene based ligands such as (DAE) in their ring-open form exist as a mixture of three rapidly interconverting isomers in solution, namely, a pair of enantiomers Ra, Ra and Sa, Sa that adopt the antiparallel conformation (OA) and the meso Ra, Sa isomer that adopts the parallel (OP) conformation.29 Only (OA) can undergo light-driven conrotatory electrocyclisation to yield a racemic mix of R, R and S, S ring closed forms with extended conjugation (Fig. 2). Molecular capsule (1) is constructed by bridging two trilacunary {PMo9} polyanions with three molecules of (OA). Formation of (1) utilises the lability of the MoVI–N coordination bonds in {PMo9}, with the saturation of the polyanion coordination sites by (DAE) only being feasible when the ligands adopt the (OA) conformation due to steric implications imposed by the polyanions if coordinated as the (OP) conformer. Fascinatingly, each independent molecular capsule contains a single enantiomer of (OA), resulting in helical molecular chirality, while single-crystal diffraction studies confirm a racemic mixture of capsules in the crystalline state with no evidence of ligand disorder within each molecular assembly.
Structural analysis
The molecular metal oxide {PMo9} component of (1) contains a capping {Mo3O14} triad connected with three {Mo2O9(Npy)} dimeric fragments with alternating terminal oxido and pyridyl ligands located on the hexagonal face of the polyanion defining the lacunary sites. This surface chemistry supports the ordering of the ligands in the assembly via directional intramolecular contacts between the ortho hydrogen atoms of the pyridyl groups of (DAE) and the adjacent terminal oxido ligands (O28–H35, 2.446 Å; O24–H5, 2.568 Å; O31–H11, 2.624 Å). Notably, all ligands within each assembly are a single enantiomer, representing an exquisite example of self-sorting and resulting in molecular capsules that possess either (P) or (M) helical chirality (Fig. 1).In terms of molecular design, the principle objective was to mitigate coordination of the photochemically inactive (OP) isomer, which was achieved due to steric implications imposed by the polyanions, akin to our previous report using a simpler POM scaffold with only one point of coordination.28 The intramolecular separation between reactive carbon atoms in the crystalline state is C9–C19, 3.43(2) Å, and C39–C39,30 3.47(2)) for the two crystallographically independent ligands (See CCDC 2173175). These values are within the limits required for solid-state photochromism,31 with the expected colour change from colourless to dark blue observed on illumination (Fig. S6†). Unfortunately, while single crystals, bulk crystalline powder, and pelletised samples of (1(OA)3) display photochromism on appropriate illumination, we have been unsuccessful in obtaining the crystallographically determined structure of (1(C)3). Finally, located within the internal cavity of the capsule are acetonitrile solvent molecules, two of which fill the void between the pyridyl ligands while the others serve as spacers between ligands, with charge balancing cations forming 2D sheets along the crystallographic a and b axes.
Solution-state stability and spectroscopy
Our investigation of the solution-state stability of (1(OA)3) in a selection of solvent systems produced varying results, with our full dataset to be published elsewhere. Herein we report that (1(OA)3) is observed to be stable in anhydrous solvents such as acetonitrile, acetonitrile/dioxane mixtures, and dichloromethane. Consequently, analyses were conducted using one or a combination of these solvent systems. Unless explicitly stated, the tetrabutylammonium salt was used due to higher solubility, while the absence of additional aromatic protons and electronic transitions in the UV region aided data analysis that is complicated by the TPP derivative. The integrity of the complex in solution is verified by ESI-MS in the negative ion mode with (1(OA)3) as either the tetrabutylammonium or tetraphenylphosphonium salts being fragile under typical conditions of the mass spectrometer irrespective of the charge balancing cation (See Fig. 3 and S8–10†). The molecular capsules, based upon the unique isotopic envelope and high-resolution accurate mass measurements, were formulated as the trianionic (3−) ion pairs {TBA3[(PMo9O31)2(DAE)3]}3− and {TPP3[(PMo9O31)2(DAE)3]}3− centred at 1691.9955 and 1788.8402 m/z, respectively (Fig. S9 and S10†), where three counter cations remain associated with the assembly during electrospray ionisation. 1H and 31P NMR were then correlated with steady-state UV-vis spectroscopy to identify a spectroscopic signature that can be used to verify solution-state integrity. In the dark, at room temperature (approx. 25 °C), we have confirmed that (1(OA)3) is stable over an extended period (21 days) with negligible spectroscopic changes observed (Fig. S1–S3†), while the integrals of the DAE ligands and tetrabutylammonium cations agree with the formulation of (TBA)6(1(OA)3). 1H–1H COSY and NOESY experiments facilitated the assignment of the pyridyl and thiophene protons (See Fig. S13 and 14†).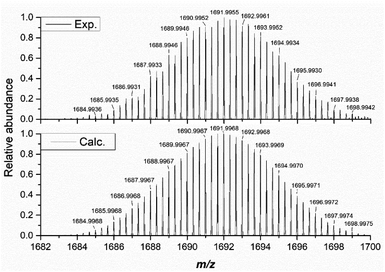 | ||
| Fig. 3 The high resolution isotopic envelope of (1) as the trianionic {TBA3[(PMo9O31)2(DAE)3]}3− (exp. (top) vs. calc. (bottom)). | ||
As expected, the pyridyl alpha protons are de-shielded on coordination due to their proximity to the electron-withdrawing MoIV ions (Δδ = ∼0.2 ppm). The sign of the NOESY cross-peaks are indicative of a large molecular assembly (>1200 MW) meanwhile 1H DOSY experiments are supportive of hydrodynamic radii for (1(OA)3) and (1(C)3) of 1.36 nm and 1.15 nm respectively (Fig. S15–17 and Table S3†). These values are in good agreement with the crystallographically determined 2.76 × 1.85 nm cross-section of (1(OA)3) and the anticipated reduction in molecular cross-section on ring closure. Absorption spectra of {PMo9} and (DAE),32 the molecular components of (1) absorb strongly in the UV region due to their respective electronic ligand-to-metal charge transfer (LMCT) O2p → Mo4d (λ325nm, ε = 8.5 × 10³ L·M−1 cm−1) and π–π* (λ325nm, ε = 1.5 × 10⁴ L·M−1 cm−1) transitions. Having confirmed the solution-state stability of (1(OA)3), we investigated its photochemistry using NMR, steady-state UV-vis spectroscopy, transient absorption spectroscopy, and spectroelectrochemistry.
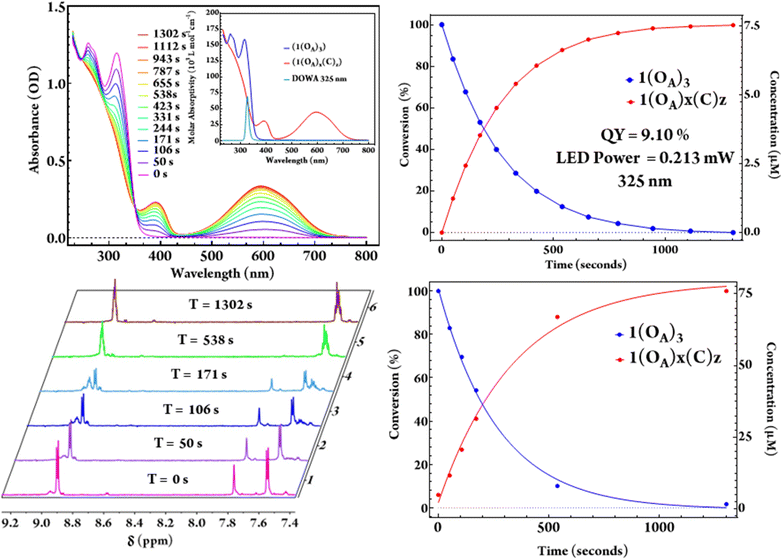
Irradiation of both acetonitrile and dichloromethane solutions of (1) using 325 nm LEDs with known optical power results in the complete conversion of (1(OA)3) to (1(C)3) with a clean isosbestic point noted at 352 nm throughout the quantum yield determination experiments (Fig. 4). As the steady-state UV-vis for the intermediate states, i.e., one and two rings closed ligands, are indistinguishable from a mixture of (1(OA)3) and (1(C)3), the extraction of a speciation diagram was not possible. 1H NMR spectra were also acquired at commensurate timepoints used for QYDS measurements to mirror the photochemical conversion in an attempt to obtain spectra that could be attributed to the intermediate species with one or two DAEs in the closed-form (Fig. 4). The significant overlap of resonances in the aromatic region precluded clear assignment, however, the disappearance of the thiophene singlet at 7.92 ppm of (1) and the absence of uncoordinated (DAE) resonances on illumination were supportive of complete conversion. Two sets of complex multiplets at (6.92 ppm) and (6.90 ppm) appeared upon irradiation which are attributed to the aromatic protons of the ring-closed molecular capsule.
The evolution of the methyl region of the 1H NMR spectra was more informative, with the diminishment of the single methyl resonance of (DAE) in (1(OA)3) at (1.94 ppm) accompanied by the appearance of multiple resonances in the 2.22–2.32 ppm range following 50 seconds of illumination and circa 17% photochemical conversion. This observation indicates the formation of a mixture of species that includes all possible combinations of open and closed ligands. On monitoring, the spectra evolved with further illumination (538 seconds, ≈ 88% photochemical conversion). Signals at 2.24 and 2.26 ppm were no longer evident and are retrospectively assigned as (1(OA)2(C)1), with the spectra now dominated by signals at 2.23 and 2.32 ppm, which are assigned as the two methyl groups in (1(C)3). While being chemically equivalent, these methyl groups are magnetically inequivalent where the ligands remain caged by the {PMo9} blocking groups (Fig. S7†).
Quantum-yield determination
A solution of (1(OA)3) is colourless, with exposure to UV light resulting in the rise of a broad and intense absorptive feature in the visible region (λmax = 595 nm, ε = 4.47 × 10⁴ L mol−1 cm−1). The molar absorptivity is calculated as 2.65 times that of the uncoordinated ring-closed DAE (λmax = 593 nm, ε = 1.69 × 10⁴ L mol−1 cm−1). A (7.5 μM) solution of (1(OA)3) with O.D. of 1 was illuminated using (325 nm) light from a LED which was imaged onto the sample using best form lenses with 0.213 mW of power photometrically measured at the sample (Fig. 4). The photochemical quantum yield for the ring closure starting from (1(OA)3) in dichloromethane as 9.10% using a custom QYDS setup (Fig. S18†).33Time-resolved spectroscopy and spectroelectrochemistry
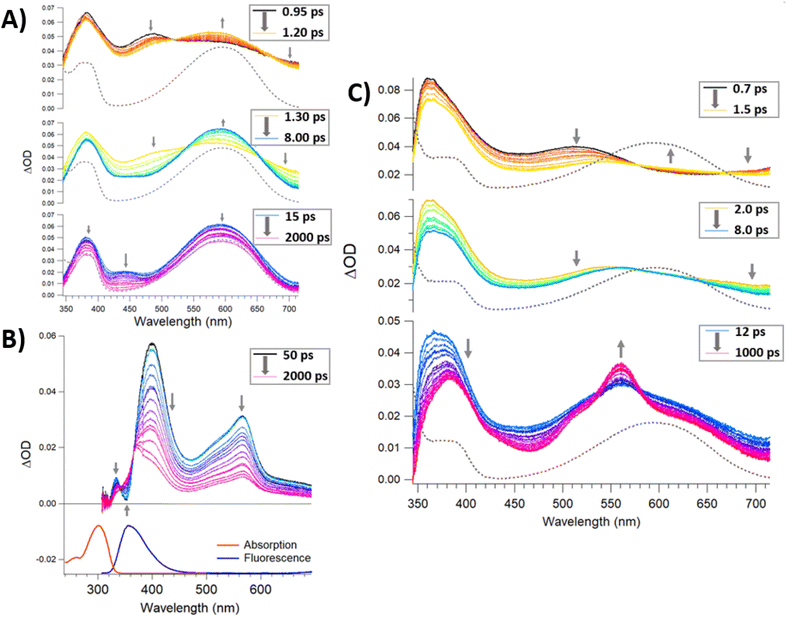
Time-resolved spectroscopies are the most suitable suite of techniques to investigate the photochemistry and physics of DAEs and rationalise the impact of the steric constraint of these molecules on their ultrafast photocyclisation dynamics. We have previously reported such studies for bridged DAEs and DAEs incorporated within supramolecular assemblies.25 Ultra-fast time-resolved spectroscopic studies of POM-based systems remain uncommon, however, they are integral to the understanding of the photochemical processes that ensue following the excitation of complex molecules such as (1(OA)3). To the best of our knowledge, this is the first such study on a POM-DAE molecular hybrid, with the model compound {PMo9} also being investigated in addition to the organic ligands (L1) and (DAE) to support our conclusions (Fig. 2 and 5).To better understand the transient data of (1(OA)3), we will begin the discussion by reviewing (DAE) and (L1) with the (DAE) transient data presented in three distinct temporal windows (Fig. S19†). The first temporal window (0.95–1.2 ps) displays a decreasing band in the blue edge with the rise of a band in the visible peaking at (590 nm), which coincides with the (DAE(C))λmax but with a broader peak width. Two isosbestic points are observed at 520 and 670 nm that will be referred to in the discussion of (1(OA)3) (Fig. 5). This first process is related to photocyclisation, with the photochemical transformation occurring from the (DAE(OA)) singlet state via(DAE(OA)(S1) to the hot (DAE(C) species denoted as (DAE(C)(v*)) probably through a conical intersection.24 As expected, the photocyclisation process OA(S1) → C(v*) is ultrafast with a characteristic time of around 500 fs. The evolution of the transient band (rise of the band maximum with concomitant lateral narrowing) on the second temporal window [1.3–8 ps] is consistent with the well-known vibrational relaxation of (DAE(C)(v*) → (DAE(C)) with a characteristic time of 40 ps. Finally, within the third temporal window, the decay of the small band peaking at 440 nm is attributed to the (OP) molecular dynamics S1 → S0 internal conversion. Note that the unexpectedly small transient bands, when compared with other DAEs,24,25 are probably due to a negligible parallel conformer population. Finally, focusing on the 2000 ps trace, the visible region of the DAE(C) spectra is completely recovered, meaning that no other competitive or slower photophysical processes are observed. The (L1) transient data following 300 nm excitation between 50 and 2000 ps delay times are easily interpreted (Fig. 5B). The stimulated emission band SE (S1 → S0; λmax – 360 nm) is readily assigned by comparison with stationary data, while the depletion of bands on either side of the SE band gave rise to a new transient band near 570 nm (see 2000 ps trace) with two clear isosbestic points evident at 343 and 366 nm. This process is assigned as the intersystem crossing between singlet and triplet species, i.e., S1 → T1 with a characteristic time of ≈ 1 ns. The analysis of transient data acquired (See Fig. 5) for a sample of (1(OA)3) is supported by the prior discussion regarding the two organic species.
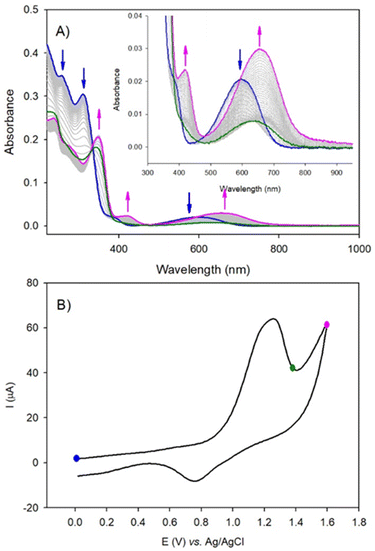
Firstly, the locking of the three DAE ligands in (1(OA)3) removes any spectral contribution from the (OP) conformer which simplifies the analysis. A sample of (1(OA)3) in dry acetonitrile was excited at 330 nm with transient data displayed for three temporal windows [0.7–1.5 ps], [2–8 ps], and [12–1000 ps] within the full-time range of 0.7–1000 ps. Global fit analysis was conducted at five independent wavelengths with an excellent fit achieved using a triple exponential model with characteristic time constants of 500 fs, 6 ps, and 60 ps (See Fig. S21†). The first process observed for (1(OA)3) is comparable to that of (DAE) which is assigned as the photocyclisation of at least one DAE with similar spectral evolution (with comparable isosbestic points – 520 and 670 nm) and a comparable process time of 500 fs. This observation indicates that the structural constraint of the DAE by the POM doesn't impact the ring-closing process. In the second temporal window, it is clear that the vibrational relaxation of (1(OA)2(C)1) is accelerated significantly compared to the DAE (6 ps vs. 40 ps), strongly supporting the ongoing operation of the caging effect and integrity of the molecular capsule. Finally, in the third temporal window, we note two key observations: (i) the absence of a transient band relating to the parallel conformer; (ii) the rise of a new signal peaking at 560 nm with shoulders at 520 and 640 nm. Further, the intensity of the 1000 ps trace at 560 nm is substantially larger than observed for DAE. Interpretation of the new spectral features unique to (1) are supported by spectroelectrochemical analysis and theoretical calculations and are attributed to charge separation following the photocyclisation process to yield DAE based radical cations and commensurate reduction of the {PMo9} capping groups as discussed in the following sections (See Fig. 6, 7, S30, Tables S5 and S6†). Cyclic voltammetry was used to elucidate changes in the redox behaviour of (1) and DAE before and after irradiation as well as for the model POM system (Table S4†). Cyclic voltammetry conducted on (1(OA)3) when cycling toward positive potentials reveals an irreversible two-electron oxidation at ca. 1.26 V vs. SCE (Fig. 6), while a quasi-reversible reduction peak is noted at 0.77 V and an ill-defined peak with low intensity is evident at ca −0.50 V.
The wave at 1.26 V is attributed to the oxidation of the open form of the DAE subunits to yield the radical cation (OA)2(˙+) form of the ligand within the complex. The radical cation can be reduced at 0.77 V, returning the species to the starting state (1(OA)3) or can be converted via radical coupling to (C2+). The reduction of this oxidised species is achieved at ca −0.50 V. Thus, for potential well below 1.26 V and under UV-visible illumination, the solution is in the steady-state composed of a mixture of ((1(OA)x(C)z); x + z = 3) driven by the equilibrium between the open and the closed form of the DAE subunits (blue-curve, Fig. 6A). Note that under illumination, the consumption of (OA) by the oxidation process favors the shift of the equilibrium from the open to the closed form leading to complete conversion to (1(C2+)3). This interpretation agrees with the spectroelectrochemical results. Upon the irreversible oxidation of the mixture above 1.26 V, UV-visible absorption spectroelectrochemistry showed the decrease of the band at 600 nm (blue curve, Fig. 6), followed by the appearance of a new absorption band shifted into the red at 650 nm (pink curve, Fig. 6) if the applied potential reached 1.60 V. This result is attributed to the oxidation of ((1(OA)x(C)z); x + z = 3) with two-electron oxidation per open-DAE subunit yielding ((1(OA)2(˙+))x(C)z); x + z = 3) (green curve, radical cation state, Fig. 6) followed by the formation of the ring closed species ((1(C2+)x(C)z); x + z = 3) which will be converted into (1(C2+)3) under illumination at the potential of 1.26 V (pink curve, Fig. 6). The reduction of the (1(C2+)3) is observed at ca −0.50 V (irreversible process), giving the formation of the initial mixture as confirmed by the full recovery of the initial band at 600 nm. Thus, under electrochemical oxidation, the open-closed equilibrium is quantitatively displaced to the oxidised closed-form. Similar results are obtained for (DAE) when considering electrochemical oxidation (Fig. S24–S25†).
In the cathodic domain, the cyclic voltammetry of (1(OA)3) reveals several reduction processes at ca. −0.69 V, −1.15 V, and −1.99 V (see Table S4)†) when acquired in the dark or under visible illumination (Fig. S32–S33†). Following UV illumination, two additional irreversible reduction peaks were detected at −1.35 V and −1.52 V which are attributed to the reduction of closed form (C). When potential reaches ca −1.15 V and −1.95 V, the reduction of the POM components of (1(OA)x(C)z) were observed in accordance with the evolution of intense broad absorption bands between 400 and 900 nm. These features are characteristic of reduced POMs and attributed to d–d and charge transfer (CT), (MoV–MoVI) transitions (Fig. S30–S31†). Furthermore, these assignments are supported by CV and UV-visible absorption spectroelectrochemistry conducted on the model compound {PMo9} (Table S4†) and Fig. S26–S29,† for which two successive reduction steps were observed. One slow electron transfer with Epc = −1.15 V (and Epa = +0.02 V) vs. Ag/AgCl and a second at −1.87 V which is irreversible. Interpretation of spectral features observed in the transient data in conjunction with spectroelectrochemical analysis indicates that the 560 nm band along with the lateral shoulder at 520 nm is related to the triplet spectra obtained for (L1) discussed earlier.
Furthermore, we can assign the second broad band at 640 nm as the DAE radical cation (DAE)+˙, which we suggest coincides with the absorption band of the reduced POM identified during the spectroelectrochemical analysis. Using a linear combination of normalised (DAE(C)), (L1) normalised triplet, (DAE(C))+˙, and reduced (POM)− spectra, we have attempted to reconstruct the normalised transient trace at 1000 ps, with the results reported in Fig. S21.† In summary, when the molecular capsule (1) is excited with UV light within 60 ps the photochromic process is completed for one DAE unit, followed by charge separation and electronic decoupling of the thiophene moieties. We propose that this first electrocyclisation and the resulting asymmetrisation of the assembly induces stretching of the remaining two DAE ligands and electronic decoupling of the DAE, resulting in the characteristic thiophene photophysics described for (L1) and charge separation yielding (DAE+ and POM−). Note that, under continuous illumination, we postulate that (1(C)3) is obtained due to the sequential ring-closure of each DAE (1(OA)3) → (1(OA)2(C)1) → (1(OA)1(C)2) → (1(C)3) rather than via simultaneous ring-closure.
We have also investigated the stability of the charge-separated state within the μ-second regime, with the transient spectra presented in (Fig. S20†). While the triplet signature has completely decayed, the (DAE(C)) spectra remain overlapped by contributions from both (1(O)x(C)z)+˙ and reduced (POM)–. Within the limit of our laser/pulse Xe lamp setup (200 μs) we were not able to recover the full spectrum of the DAE(C) species (as we did for DAE alone), suggesting that the charge-separated state is stable in the μ-second regime.
The distinct features of the experimental UV-vis absorption spectra could be qualitatively reproduced with the sTDA39-CAMB3LYP40 calculations. While (1(OA)3) does not show any absorption in the visible or near UV, the first electronic transition for (1(OA)2(C)1) occurs at 550 nm, an acceptable blueshift (45 nm) when compared to the experiment given the various approximations made to be able to treat this system computationally. The relevant highest occupied and lowest unoccupied molecular orbitals (HOMO and LUMO) for this transition are localised on the closed diarylethene, as expected (Fig. 7, Tables S6 and S37†). Significantly, on closing a single DAE within the molecular capsule, the number of excited states within the 0–5 eV energy window dramatically increased. While only five transitions were calculated for (1(OA)3) (shown in Table S5†), ranging from about 251 to 280 nm, the calculation for (1(OA)2(C)1) revealed a total of 30 excitations ranging from 249 to about 550 nm. Table S6† contains the eleven lowest-lying transitions. Qualitative trends can be drawn from these values in conjunction with the acquired transient data and spectroelectrochemical analyses, whereby the first photophysical process following excitation of (1(OA)3) is the ring closure of at least one DAE, with subsequent processes including charge transfer from the open and closed DAEs. Qualitative trends can be drawn from these values in conjunction with the acquired transient data and spectroelectrochemical analyses, whereby the first photophysical process following excitation of (1(OA)3) is the ring closure of at least one DAE, with subsequent processes including charge transfer from the open and closed DAEs to the POMs.
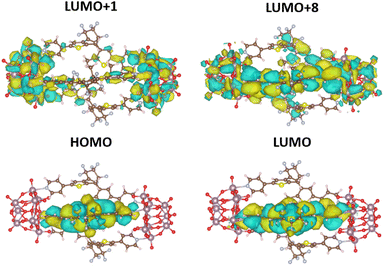 | ||
| Fig. 7 CAMB3LYP/def2-SVPD41 orbitals (plotted with standard settings in VESTA) for the most relevant excitations in (1(OA)2(C)1) as listed in (Table S6†). | ||
This hypothesis is supported by calculations, with a noticeable high oscillator strength transition at around 327 nm being identified as a CT transition from the closed ligand into both POM units (Fig.7, Tables S6 and S37†). All remaining transitions in the (1(OA)2(C)1) system appear at 300 nm and below and lie very close to one another, which fits well with the experimentally observed broad featureless absorption spectrum. On close analysis of excitations between 300 and 280 nm (Table S6†), we see that they all also show CT from the closed ligand to the POM units, which precludes the requirement for extensive discussion as the density of these states prevents experimental interrogation. Contrary to that, all calculated transitions in the open system (1(OA)3) involve transitions from any of the three open ligands to the entire capsule (Table S5 and Fig. S36†).
Conclusions
The photochromic molecular capsule (1) was prepared, crystallised, structurally characterised, and studied using a suite of spectroscopic techniques. Constructed from three diarylethene ligands and two polyoxomolybdates, the assembly represents the first structurally characterised POM-based assembly containing multiple DAE ligands. The molecule is stable in anhydrous acetonitrile and dichloromethane, with the DAE ligands undergoing sequential electrocyclisation following illumination with UV (Φ – 0.091) as confirmed by NMR and transient data via the classical pathway (OF** → OF*(S1 state) → Conical intersection → CF(v*) → CF) within the characteristic time of ∼500 fs that is comparable to regular DAEs, where OF and CF represent the open and closed form of the DAE respectively.24 After the appearance of the CF species, additional photoproducts are observed: (i) the triplet species of pyridine-thiophene with a lifetime shorter than hundreds of nanoseconds and (ii) the charge-separated electron–hole pair of DAE+˙ and POM-with a lifetime of longer than 200 μ-seconds. The assignment of these spectral signatures is supported by a spectroelectrochemistry study that identified the nature of the oxidised and reduced species. These conclusions are supported by theoretical calculations. Collectively these findings lay the foundation for an expansive study that aims to elucidate the compositional and structural combinations of POM and DAE that will provide access to latent long-lived charge-separated states and thereafter, photocatalytic performance amongst other applications.Data availability
Raw data associated with this article is available from the authors on request.Author contributions
All authors contributed to the preparation of the manuscript and declare no conflict of interest. C. R. devised and managed the project, M. C conducted the synthesis, NMR and steady-state UV-vis including quantum yield determination and chemical characterisation. J. X. assisted with initial synthetic experiments. A. M assisted with NMR experiments while C. G. and S. A. acquired and analysed the TA data. C. F. assisted with structure determination, H. Z. M and R. A. J. O. acquired and analysed mass spectra. A. B and L. R conducted and interpreted the spectroelectrochemistry and L. G. conducted the computational study.Conflicts of interest
The authors declare no conflict of interests.Acknowledgements
C. R. would like to thank Monash University and the Australian Research Council for funding this research (FT180100610). C. R. also acknowledges the funding support from the Australian Research Council for the ARC Centre of Excellence for Enabling Eco-Efficient Beneficiation of Minerals, grant number CE200100009. A. B. and L. R. thank the CNRS and the Université de Strasbourg for support through the project “Idex Attractivité 2012”. R. A. J. O. acknowledges funding from the ARC Discovery scheme (ARC DP180101187). L. G. is grateful for the generous allocation of computational resources from the National Computational Infrastructure (NCI) Facility within the National Computational Merit Allocation Scheme (project fk5). S. A. HZM thanks the Australian government for a Research Training Program (RTP) scholarship. Ms. Henrieta Derondeau is thanked for the discussion concerning the QYDS measurements.Notes and references
- D. M. Kaschak, J. T. Lean, C. C. Waraksa, G. B. Saupe, H. Usami and T. E. Mallouk, J. Am. Chem. Soc., 1999, 121, 3435–3445 CrossRef CAS.
- H. Zhou, X. Li, T. Fan, F. E. Osterloh, J. Ding, E. M. Sabio, D. Zhang and Q. Guo, Adv. Mater., 2010, 22, 951–956 CrossRef CAS PubMed.
- Y. Wang, E. L. Runnerstrom and D. J. Milliron, Annu. Rev. Chem. Biomol. Eng., 2016, 7, 283–304 CrossRef CAS PubMed.
- Y. Ke, J. Chen, G. Lin, S. Wang, Y. Zhou, J. Yin, P. S. Lee and Y. Long, Adv. Energy Mater., 2019, 9, 1902066 CrossRef CAS.
- A. Abdollahi, H. Roghani-Mamaqani, B. Razavi and M. Salami-Kalajahi, ACS Nano, 2020, 14, 14417–14492 CrossRef PubMed.
- D. Bléger and S. Hecht, Angew. Chem., Int. Ed., 2015, 54, 11338–11349 CrossRef PubMed.
- M. Irie, T. Fukaminato, K. Matsuda and S. Kobatake, Chem. Rev., 2014, 114, 12174–12277 CrossRef CAS PubMed.
- X. Yao, T. Li, J. Wang, X. Ma and H. Tian, Adv. Opt. Mater., 2016, 4, 1322–1349 CrossRef CAS.
- A. Goulet-Hanssens, F. Eisenreich and S. Hecht, Adv. Mater., 2020, 32, 1905966 CrossRef CAS PubMed.
- J. Zhang, Q. Zou and H. Tian, Adv. Mater., 2013, 25, 378–399 CrossRef CAS PubMed.
- A. M. Rice, C. R. Martin, V. A. Galitskiy, A. A. Berseneva, G. A. Leith and N. B. Shustova, Chem. Rev., 2020, 120, 8790–8813 CrossRef CAS PubMed.
- E. C. Juan, J. Borrás-Almenar, A. Müller and M. Pope, Polyoxometalate Molecular Science, Springer, Dordrecht, Netherlands, 2003 Search PubMed.
- N. V. Izarova, N. Vankova, T. Heine, R. N. Biboum, B. Keita, L. Nadjo and U. Kortz, Angew. Chem., Int. Ed., 2010, 49, 1886–1889 CrossRef CAS PubMed.
- Y. Gao, M. Choudhari, G. K. Such and C. Ritchie, Chem. Sci., 2022, 13, 2510–2527 RSC.
- C. L. Hill, Chem. Rev., 1998, 98, 1–2 CrossRef CAS PubMed.
- A. Proust, R. Thouvenot and P. Gouzerh, Chem. Commun., 2008, 1837–1852, 10.1039/B715502F.
- N. I. Gumerova and A. Rompel, Nat. Rev. Chem., 2018, 2, 0112 CrossRef CAS.
- P. J. Sarver, V. Bacauanu, D. M. Schultz, D. A. DiRocco, Y.-h. Lam, E. C. Sherer and D. W. C. MacMillan, Nat. Chem., 2020, 12, 459–467 CrossRef CAS PubMed.
- P. J. Sarver, N. B. Bissonnette and D. W. C. MacMillan, J. Am. Chem. Soc., 2021, 143, 9737–9743 CrossRef CAS PubMed.
- Y. Luo, S. Maloul, S. Schönweiz, M. Wächtler, C. Streb and B. Dietzek, Chem.–Eur. J., 2020, 26, 8045–8052 CrossRef CAS PubMed.
- S. Cetindere, S. T. Clausing, M. Anjass, Y. Luo, S. Kupfer, B. Dietzek and C. Streb, Chem.–Eur. J., 2021, 27, 17181–17187 CrossRef CAS PubMed.
- B. Matt, X. Xiang, A. L. Kaledin, N. Han, J. Moussa, H. Amouri, S. Alves, C. L. Hill, T. Lian, D. G. Musaev, G. Izzet and A. Proust, Chem. Sci., 2013, 4, 1737–1745 RSC.
- F. A. Black, A. Jacquart, G. Toupalas, S. Alves, A. Proust, I. P. Clark, E. A. Gibson and G. Izzet, Chem. Sci., 2018, 9, 5578–5584 RSC.
- I. Hamdi, G. Buntinx, A. Perrier, O. Devos, N. Jaïdane, S. Delbaere, A. K. Tiwari, J. Dubois, M. Takeshita, Y. Wada and S. Aloïse, Phys. Chem. Chem. Phys., 2016, 18, 28091–28100 RSC.
- I. Hamdi, G. Buntinx, O. Poizat, A. Perrier, L. Le Bras, S. Delbaere, S. Barrau, M. Louati, M. Takeshita, K. Tokushige, M. Takao and S. Aloïse, J. Phys. Chem. A, 2018, 122, 3572–3582 CrossRef CAS PubMed.
- C. Li, N. Mizuno, K. Yamaguchi and K. Suzuki, J. Am. Chem. Soc., 2019, 141, 7687–7692 CrossRef CAS PubMed.
- C. Li, A. Jimbo, K. Yamaguchi and K. Suzuki, Chem. Sci., 2021, 12, 1240–1244 RSC.
- J. Xu, H. Volfova, R. J. Mulder, L. Goerigk, G. Bryant, E. Riedle and C. Ritchie, J. Am. Chem. Soc., 2018, 140, 10482–10487 CrossRef CAS PubMed.
- D. Schlüter, F. Kleemiss, M. Fugel, E. Lork, K. Sugimoto, S. Grabowsky, J. R. Harmer and M. Vogt, Chem.–Eur. J., 2020, 26, 1335–1343 CrossRef PubMed.
- Generated by symmetry operations.
- S. Kobatake, K. Uchida, E. Tsuchida and M. Irie, Chem. Commun., 2002, 2804–2805 Search PubMed.
- M. Han, Y. Luo, B. Damaschke, L. Gómez, X. Ribas, A. Jose, P. Peretzki, M. Seibt and G. H. Clever, Angew. Chem., Int. Ed., 2016, 55, 445–449 CrossRef CAS PubMed.
- U. Megerle, R. Lechner, B. König and E. Riedle, Photochem. Photobiol. Sci., 2010, 9, 1400–1406 CrossRef CAS PubMed.
- P. Hohenberg and W. Kohn, Phys. Rev., 1964, 136, B864–B871 CrossRef.
- W. Kohn and L. J. Sham, Phys. Rev., 1965, 140, A1133–A1138 CrossRef.
- S Grimme, J. G. Brandenburg, C. Bannwarth and A. Hansen, J. Chem. Phys., 2015, 143, 054107 CrossRef PubMed.
- A. Klamt and G. Schüürmann, J. Chem. Soc., Perkin Trans. 2, 1993,(5), 799–805 RSC.
- V. Barone and M. Cossi, J. Phys. Chem. A, 1998, 102(11), 1995–2001 CrossRef CAS.
- S. Grimme, J. Chem. Phys., 2013, 138, 244104 CrossRef PubMed.
- T. Yanai, D. P. Tew and N. C. Handy, Chem. Phys. Lett., 2004, 393, 51–57 CrossRef CAS.
- D. Rappoport and F. Furche, J. Chem. Phys., 2010, 133, 134105 CrossRef PubMed.
Footnote |
| † Electronic supplementary information (ESI) available. CCDC 2173175. For ESI and crystallographic data in CIF or other electronic format see DOI: https://doi.org/10.1039/d2sc04613j |
| This journal is © The Royal Society of Chemistry 2022 |

