MgH2/single-atom heterojunctions: effective hydrogen storage materials with facile dehydrogenation†
Shuai
Dong
a,
Chaoqun
Li
a,
Erfei
Lv
a,
Jinhui
Wang
a,
Hao
Liu
a,
Zhengyang
Gao
a,
Wei
Xiong
 *b,
Zhao
Ding
c,
Weijie
Yang
 *a and
Hao
Li
 *d
*d
aSchool of Energy and Power Engineering, North China Electric Power University, Baoding, 071003, China. E-mail: yangwj@ncepu.edu.cn
bKey Laboratory for Green Chemical Process (Ministry of Education), Engineering Research Center of Phosphorus Resources Development and Utilization of Ministry of Education, Hubei Key Laboratory of Novel Reactor & Green Chemical Technology, School of Chemistry and Environmental Engineering, Wuhan Institute of Technology, Wuhan 430205, China. E-mail: xiongwei@wit.edu.cn
cCollege of Materials Science and Engineering, Chongqing University, Chongqing, 400044, China
dAdvanced Institute for Materials Research (WPI-AIMR), Tohoku University, Sendai 980-8577, Japan. E-mail: li.hao.b8@tohoku.ac.jp
First published on 10th May 2022
Abstract
Magnesium hydride (MgH2) is considered as a promising solid-state hydrogen storage material due to its high hydrogen storage mass density and environmental friendliness. However, its sluggish dehydrogenation kinetics are still the bottleneck that restricts practical applications. To address this challenge, very recent pioneering experiments found that MgH2/single-atom catalyst (MgH2/SAC) heterojunctions can be promising candidates for hydrogen storage. However, the reaction mechanism and design guideline were still not well understood. Herein, we design and analyze MgH2/SAC heterojunction systems including nine 3d transition metals, using spin-polarized density functional theory calculations with van der Waals corrections. We found that the energy barriers of MgH2 dehydrogenation are significantly reduced by 0.51–2.22 eV through the promotion effects of a heterojunction. Using ab initio molecular dynamics simulations, these promotion effects were analyzed in depth based on the observation of hydrogen diffusion behaviors. To provide further insights, the electron localization function, charge density difference, hydrogen adsorption energy, system electronegativity, d-band center, and crystal orbital Hamilton population were comprehensively analyzed to understand the origin of the high performance of MgH2/SACs. In particular, we found that the system electronegativity of SACs can act as an effective descriptor that predicts the dehydrogenation energy barriers. Most importantly, this study provides important design guidelines of a brand-new type of MgH2/SAC material and a promising solution to the sluggish kinetics of MgH2 dehydrogenation in hydrogen storage.
Introduction
Hydrogen is a green energy source in industry.1–3 However, how to safely and effectively use hydrogen are the main challenges that hinder its broad utilization.4–6 Among the gas–liquid–solid three-phase materials, solid hydrogen storage materials not only have the advantages of high safety but also high volumetric energy density.7–9 Among solid hydrogen storage materials, light metal hydrides are ideal candidates as hydrogen storage materials due to their high storage capacity.10–12 Magnesium hydride (MgH2) (7.6 wt%) has good reversibility and low cost, which make it a potential hydrogen storage material.13,14 However, the experimental dehydrogenation enthalpy of magnesium is high.15 Due to the key challenge in the dehydrogenation process, its working temperature is 450–550 °C in practical applications, making it difficult to apply it in the energy industry.16Common strategies to address these challenges include alloying,17–22 nanostructuring,23–27 and doping.28–39 Among these strategies, doping can significantly improve the dehydrogenation performance because it may accelerate hydrogen transfer.4 At present, transition metal based materials with high activity are considered as ideal dopants, most of which are metals and metal compounds.4,14,28–38 Because the weight of metals is larger than that of non-metals, the material weight is greatly increased, and therefore the hydrogen storage capacity is limited. Even if the material has a good hydrogen storage performance, it is difficult to use it in industry due to the relatively high weight. Moreover, the coordination saturation of those catalysts is insufficient to activate MgH2, leading to a high dehydrogenation temperature which cannot meet the urgent needs in engineering. Therefore, it is particularly important to search for a hydrogen storage material with both light weight and high performance.
The emergence of metal–carbon composites36,39–41 is one of the promising solutions to this challenge. Carbon-based single-atom catalysts (SACs) can further reduce the relative mass, which endows them with unique advantages as dehydrogenation catalysts. SACs have a maximum atom utilization42–48 and excellent performance in many catalytic processes, including oxygen reduction,49,50 oxygen evolution,51 nitrogen reduction,52–57 CO2 reduction,58–60 and hydrogen-involving reactions such as organic dehydrogenation/hydrogenation61–66 and the hydrogen evolution reaction.67–72 Since hydrogen storage has a similar hydrogen transfer process, it can be reasonably expected that the introduction of SACs onto MgH2 may improve its dehydrogenation/hydrogenation performance. Transition metal and nitrogen-doped carbon composites (TM–N–C, where TM = Fe, Co, Ni, Cu, etc.) were first reported by the Zhang group and found to be promising candidates for many applications.42 Very recently, Huang et al.73 analyzed the SACs with a TM–N–C structure and found that these materials could significantly promote the dehydrogenation performance of MgH2 for hydrogen storage. They showed that the hydrogen storage capacity of the material was about 5.4 wt%. Given that the hydrogen storage capacity between 5 wt% and 15 wt% can be considered as a high hydrogen storage performance, the study of this type of material is of great significance. They used a quasi-solid-state template method involving ball-milling, calcination, and washing to synthesize highly disperse SACs. The composite materials formed by adding these SACs onto MgH2 showed excellent hydrogen storage and dehydrogenation performance. This pioneering study published in the year 2021 provides a brand-new avenue to address the challenges of MgH2 dehydrogenation. However, related mechanistic understanding and design guidelines are still not clear.
Motivated by the very recent success from experiments and the remaining challenges, herein, first-principles calculations were employed to analyze the reaction pathways and related kinetics and thermodynamics of MgH2 and nine MgH2/SAC heterojunction systems. The materials with promising dehydrogenation performances were then selected for electronic structure analysis and ab initio molecular dynamics (AIMD) simulations. Subsequently, we comprehensively analyzed the structure–property relationships of MgH2/SAC heterojunction systems and generalized the trends in their dehydrogenation performance. Finally, we provided a design guideline for MgH2/SAC heterojunctions as high-performance hydrogen storage materials and screened other SAC candidates among 3d, 4d, and 5d transition metals in the periodic table.
Computational and modeling methods
Computational methods
Density functional theory (DFT) calculations were performed using the Vienna Ab initio Simulation Package (VASP) with the projector augmented wave (PAW) method. The Perdew–Burke–Ernzerhof (PBE) functional within the generalized gradient approximation (GGA) was employed to describe the exchange–correlation energy.74–76 Previous benchmarking studies and related discussions showed that PBE is relatively precise for describing hydrogen adsorption and desorption,77,78 in good agreement with ultrahigh vacuum experimental results. Meanwhile, we also considered both spin-polarization79 and van der Waals corrections using the DFT-D3 scheme.80 Dipole moments were corrected along the z-direction for all the calculations. A plane-wave basis set with an energy cutoff of 450 eV was used to describe valence electrons. The geometries were considered relaxed when all the forces of each atom decreased below 0.05 eV Å−1. A (4 × 4 × 1) Γ-centered k-point grid was employed for structural relaxations (Fig. S1†). All geometry optimizations were performed using the conjugate gradient method. The climbing-image nudged elastic band (CI-NEB) method developed by Henkelman et al.81,82 was employed to locate the transition states (TS) of dehydrogenation reactions. The image number of the CI-NEB calculations was obtained based on a calculated reference value: the VASP-VTST83 script calculated the atomic distance between the initial and final states (IS and FS, respectively), after which we specified that the distance between two adjacent images was less than 0.8 Å, thus obtaining a reference value for the number of our CI-NEB images. As a result, at least four images were inserted between the IS and FS in our study to locate the TS using CI-NEB calculations. AIMD simulations embedded in the VASP code were performed with a time step of 1 fs with a simulation duration of 10![[thin space (1/6-em)]](https://www.rsc.org/images/entities/char_2009.gif) 000 steps, i.e., 10 ps, in the NVT ensemble using the Nose–Hoover thermostat. According to previous studies, the dehydrogenation temperature of MgH2 was around 663 K.84 At this point, we chose 500 K for the AIMD simulation of MgH2 and MgH2/SAC. This allows a better comparison of the kinetic gap between pure MgH2 and MgH2/SAC. The visualization software VMD was used for the post-processing of AIMD.85 To determine whether the single-atom site is stable at the heterojunction structure, the binding energies of the single-atom transition metals were calculated via the following equation:
000 steps, i.e., 10 ps, in the NVT ensemble using the Nose–Hoover thermostat. According to previous studies, the dehydrogenation temperature of MgH2 was around 663 K.84 At this point, we chose 500 K for the AIMD simulation of MgH2 and MgH2/SAC. This allows a better comparison of the kinetic gap between pure MgH2 and MgH2/SAC. The visualization software VMD was used for the post-processing of AIMD.85 To determine whether the single-atom site is stable at the heterojunction structure, the binding energies of the single-atom transition metals were calculated via the following equation:| Eb = ESAC − ETM − ECN | (1) |
In addition, to further estimate the dehydrogenation temperature from the resulting energy barriers, we invoked the Arrhenius equation:86
 | (2) |
To explore the magnitude of the hydrogen adsorption capacity of the catalyst, we introduced the H adsorption energies (EH), which were calculated as follows:
| EH = Etot − ESAC − Ehydrogen | (3) |
 | (4) |
 | (5) |
To analyze the charge change upon the addition of SACs, we calculated the charge density difference (Δρ). Charge density difference is one of the important ways to analyze electronic structures, which was calculated by the following equation:
| Δρ = ρAB − ρA − ρB | (6) |
Modeling methods
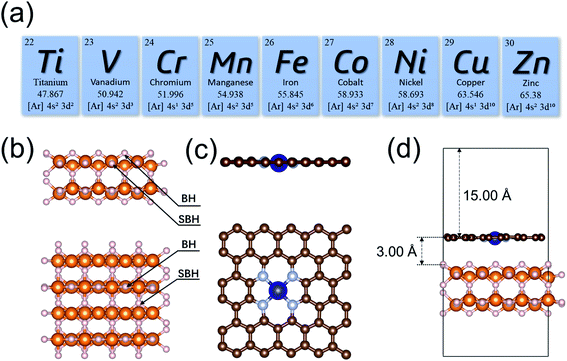
The initial configuration of the MgH2 surface was cleaved from the rutile structure of bulk MgH2. To analyze the effects of single-atom metals on the catalytic performance, nine 3d transition metals (Ti, V, Cr, Mn, Fe, Co, Ni, Cu, and Zn) were explicitly analyzed as the SACs in this study (Fig. 1a). All MgH2 surfaces in this study were modeled as a stable (110) slab due its low surface energy,94 with (4 × 4) unit cells (Fig. 1b). Only the dehydrogenation energy barrier on the MgH2 surface was calculated, and there are only two types of H atoms at the surface: bridge and sub-bridge hydrogen. The studied dehydrogenation process is a reaction using two bridge hydrogens (BH) to generate a hydrogen molecule. Based on the most widely seen SAC structures from experiments,73 the single-atoms were embedded at the –N4 sites of a defected graphene surface. To build a heterojunction with the surface of MgH2(110), the dimension size of single-atom doped graphene was adjusted to 12.62 × 12.68 Å to minimize lattice mismatch (Fig. 1c). A vacuum layer of 15 Å was set in the z-direction to separate images. After optimization, the gap between MgH2 and SACs was found to be 3.00 Å (Table S1†). A side view of the MgH2/SAC heterojunction considered for our calculations is shown in Fig. 1d.Results and discussion
MgH2 dehydrogenation at MgH2 and MgH2/SAC heterojunctions
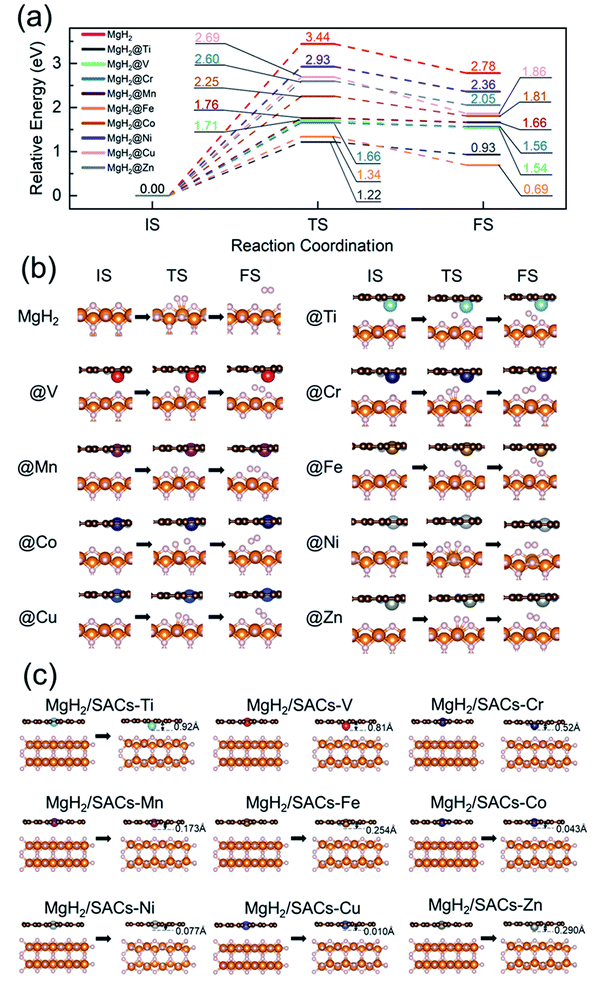
To analyze the stability of the catalysts, we calculated the binding energy of the transition metal SAs at the –N4–C site (Table 1); the results showed that the binding energies were all very negative, suggesting that these SACs are thermodynamically stable in the heterojunction system. Also, after structural optimization for all the heterojunction systems, we found that the metal atoms always face the side with H atoms after relaxation. Firstly, we analyzed the dehydrogenation kinetics of MgH2 for comparison (Fig. 2a, red lines). The associative desorption of two bridging atomic H at the top layer has a reaction energy and activation energy barrier of 2.78 and 3.44 eV, respectively. Previous studies found that pure graphene is incapable of affecting MgH2 dehydrogenation.95 Therefore, any performance variation of MgH2/SACs is mainly contributed by the doping of single-atom metals. The free energy diagrams (where the zero-point energy corrections and entropic changes were included) and corresponding structures of MgH2 and MgH2/SAC heterojunctions are shown in Fig. 2, with the calculated data tabulated in Tables S2–S4.† The final and transition state structures of different systems are slightly different, mainly due to different positions of doped metal atoms in the catalysts and the dissociation order of H in the transition states. Interestingly, the results show that when SACs are added above MgH2, both the energy barriers and reaction energies of MgH2 dehydrogenation are reduced at all nine SACs. Moreover, the hydrogen evolution pathway of MgH2 changes significantly after the addition of SACs (Fig. 2b). From the obtained energy barriers, we can estimate the relative decrease of reaction temperature. According to the Arrhenius equation, when the dehydrogenation temperature of MgH2 is assumed to be 700 K, the dehydrogenation temperature for the same reaction rate constant of other systems can be estimated (Table S5†), and the lowest dehydrogenation temperature obtained is 247.65 K at MgH2/SAC–Ti. Since the dehydrogenation energy barriers of pure magnesium hydride obtained from different articles95–98 are different, we use the reduction percentage of dehydrogenation energy barriers for comparison (Table S6†). We found that MgH2/SAC–Ti has a larger reduction percentage of dehydrogenation energy barrier than the previously analyzed materials. These results clearly indicate that SACs have a significant effect on the optimization of the hydrogen storage performance of MgH2. Among them, the decrease in the energy barrier is most pronounced when Ti is the dopant, and it is lower than half of the dehydrogenation energy barrier of pure MgH2. In addition, the order of thermodynamic energy changes is in good agreement with the magnitude of the energy barriers. Besides, it was found from the optimized structures that some of the SACs have significant displacements with their single-atom metals moving closer towards MgH2 after structural relaxation (Fig. 2c).| Metal | E b (eV) | E a (eV) | H M (Å) | ΔQM (e) | ΔQN (e) | E H (eV) | Electronegativity | ε d (eV) |
|---|---|---|---|---|---|---|---|---|
| Ti | −7.732 | 1.217 | 0.924 | −1.383 | 0.892 | −0.116 | −0.116 | 0.308 |
| V | −8.296 | 1.706 | 0.812 | −1.310 | 1.008 | −0.050 | −0.050 | 0.220 |
| Cr | −4.639 | 1.656 | 0.520 | −1.243 | 0.986 | −0.308 | −0.308 | −0.191 |
| Mn | −6.041 | 1.756 | 0.173 | −1.292 | 1.049 | −0.280 | −0.280 | −0.963 |
| Fe | −7.426 | 1.563 | 0.254 | −1.088 | 0.911 | −0.675 | −0.675 | −0.898 |
| Co | −7.134 | 2.253 | 0.043 | −0.848 | 0.521 | −0.150 | −0.150 | −0.701 |
| Ni | −8.058 | 2.909 | 0.077 | −0.847 | 0.619 | −0.149 | −0.149 | −1.746 |
| Cu | −4.607 | 2.690 | 0.010 | −0.928 | 0.861 | −0.230 | −0.230 | −3.294 |
| Zn | −2.430 | 2.596 | 0.290 | −1.142 | 1.168 | −0.219 | −0.219 | −6.069 |
Analysis of structure–property relationships
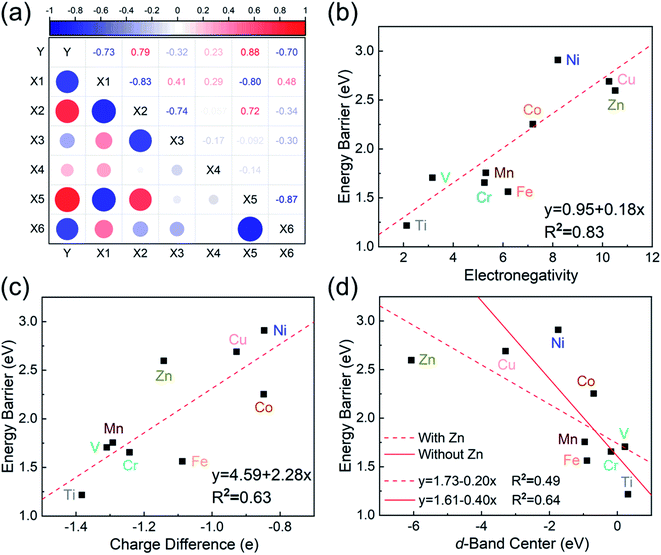
To investigate the relevance between SACs and their reaction kinetics and thermodynamics, we analyzed the height change of metal atoms, metal charge difference, N charge difference, H adsorption energy, system electronegativity, and d-band center of these SACs in the heterojunctions (Table 1). Based on the information in Table 1, we carried out Pearson correlation coefficient (PCC) analysis to discuss their correlations with the dehydrogenation energy barriers of MgH2 (Fig. 3a). Among the six properties, the system electronegativity correlates most significantly with dehydrogenation energy barriers, with a correlation coefficient of 0.88. Therefore, we plotted the linear correlation between energy barrier and electronegativity in Fig. 3b. According to statistical theory,99 an R2 of 0.83 (Fig. 3b) suggests a relatively high correlation between the two variables. Electronegativity is an important charge descriptor based on the atoms' atomic electronegativity (eqn (1)),88 which has been used to understand the reactivity of the atom center of SACs.87 As shown in Fig. 3b, the energy barrier increases with the increase of the electronegativity of SACs. This is because the two atomic H are negatively charged in MgH2, making it difficult for them to form H2. The charge distribution of H is affected by the charge properties of the single-atom metals, leading to a more facile bonding between two atomic H. These results are in good agreement with the previous experimental conclusion that metal electronegativity is highly correlated with the dehydrogenation kinetics.73 However, in the previous study,73 the order of electronegativity was not fully the same as the order of energy barriers, which is less precise than our analyses presented here. According to previous analyses,100 the experimentally prepared metal-doped graphene has uncertainty and irregularity in structure, and the N-coordination numbers of each dopant atom were usually not identical in this type of material. Moreover, the N-coordination number directly affects the catalytic properties of the material,50,101 which is one of the main reasons leading to the discrepancy of the data between this paper and the previous experimental material.73 Therefore, previous experimental methods might unavoidably lead to different N-coordination numbers and environments for the doped transition metals, leading to uncertainty in the analyses. Being very different from the analytical methods used in previous studies, herein, we for the first time performed first-principles based analysis on this SAC–MgH2 system with an explicit stable metal–N4–C structure. Throughout the calculations, Fe is an outlier for several reasons. For example, in different coordination and experimental environments, Fe may present different magnetic states.102,103 In addition, in previous studies, hydrides are easily formed at the sites associated with Fe,104–107 having different properties compared to many other transition metals. Fig. 3c shows the Bader charges of metals after relaxation and the difference in the intrinsic charges of metal atoms. We found that there is a linear correlation between the metal charge difference and dehydrogenation performance. Therefore, we speculate that its ability to optimize dehydrogenation is related to the charge properties of metal atoms. Therefore, we further calculated the d-band centers (i.e., average energy of d-electrons) of the single-atom metals (Fig. 3d), which closely correlate with the dehydrogenation performance of SACs. Other correlation analyses are shown in Fig. S2.† According to the classic d-band center theory,89 a surface site with a more positive d-band center has a stronger adsorption capacity. This is in good agreement with our findings that the single-atom metal sites with more positive d-band centers generally have lower barriers for the reaction because of the stronger attractive interaction with the atomic H from MgH2.Based on all the analyses above, we can find that the dehydrogenation performance of MgH2 can be significantly improved upon adding SACs, where the electronegativity of the single-atom system plays a key role in determining the performance. To further illustrate the electronic changes upon adding SACs, we analyzed the electron localization functions (ELFs) of both MgH2 and MgH2/SACs (Fig. 4, S3 and S4†). Red color indicates a higher degree of electron localization, while blue color indicates a lower electron density in the region. From all the ELF results, we can see that the electron localization degree around H is high on the pure MgH2 system, while it decreases upon the addition of SACs above the MgH2 surface. The phenomenon that the degree of electron localization decreases not only occurs on surface H but also slightly on the sublayer H. This suggests that SACs affect not only the electronic properties of surface H but also the sublayer H of MgH2. The decrease in the degree of electron-domain fixation indicates that the addition of SACs makes it easier for the electrons around the atomic H to leave MgH2.
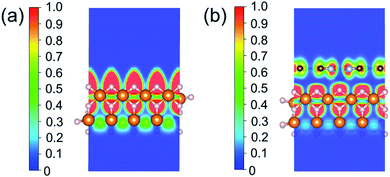 | ||
| Fig. 4 ELFs of (a) MgH2 and (b) MgH2/SACs–Ti. The section is the 010 plane of the H atom nearest to the metal atom. In the color bars, 1 represents a fully localized state, 0.5 represents a uniform electronic gas state, and 0 represents a fully nonlocalized state. The ELF results of other MgH2/SAC systems are shown in Fig. S4.† | ||
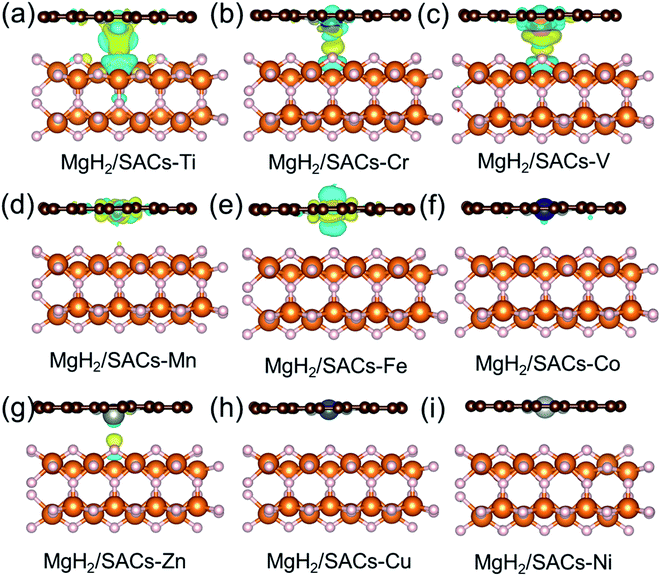
Furthermore, the charge changes of MgH2 induced by the addition of SACs were analyzed in detail by calculating the charge density difference (Fig. 5a–i). Charge transfer occurs on the atomic H closest to the transition metal, and the charge is obtained by losing electrons above H. As mentioned earlier in this paper, atomic H has a negative charge in MgH2, and the addition of catalyst may tune its charge properties. Fig. 5 shows the positions of electron aggregation and reduction, which helps understand the charge changes upon the addition of SACs. Interestingly, as the corresponding dehydrogenation barrier decreases, the charge migration of H becomes less significant. For those systems which have lower dehydrogenation barriers (e.g., MgH2/SAC–Ti), the yellow region illustrates the clustering of H electrons due to the influence of SACs, while the blue region indicates that the aggregated electrons are provided by electrons in the bonding orbitals between H and Mg below. This indicates that the Mg–H bond is not stable because the electrons from H migrate toward the transition metal atom, in turn reducing the dehydrogenation barrier of MgH2. Graphene is very stable due to the largely delocalized π-bonding, thus it does not provide electrons to hydrogen. However, N will compete with H for the valence electrons of metal. When the N–metal bond is weaker, the single-atom metal will be closer to MgH2. Then more electrons will move closer to H. These phenomena are generally consistent among the analyzed 3d transition metals. Furthermore, we analyzed the electronic changes of metal atoms by calculating the projected density of states (PDOS) of d electrons of the systems (Fig. S5†). The distribution changes of the d-states upon the combination of SACs and MgH2 are qualitatively consistent with the calculated charge density differences in Fig. 5. These further confirm that the interactions between SACs and MgH2 significantly influence material performance.
AIMD simulations
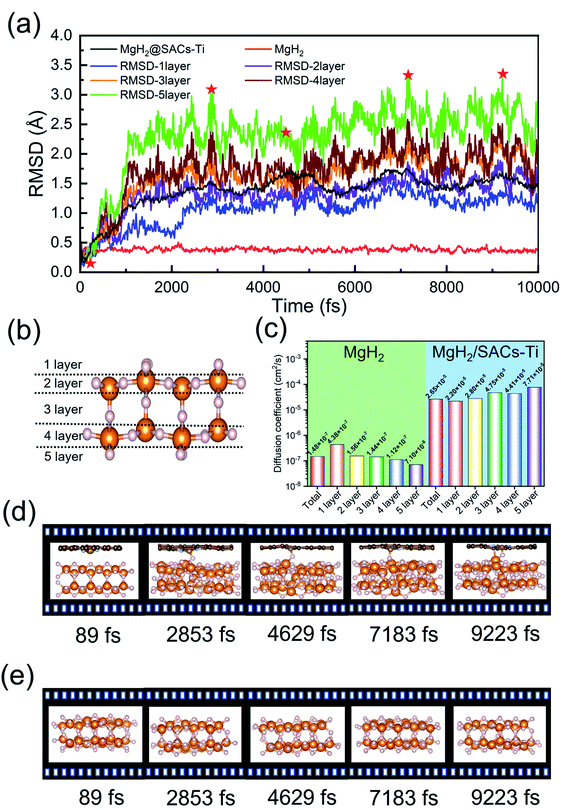
The desorption ability of hydrogen in the system is an important factor for measuring the performance of hydrogen storage materials. Therefore, we analyze the hydrogen desorption performance of MgH2 before and after adding SACs using AIMD simulations. Previous MD simulations found that MgH2 dehydrogenates only when MD simulations were performed at temperatures above 663 K.84 Therefore, we set the temperature to 500 K in our AIMD simulations. After analyzing both MgH2 and MgH2/SACs–Ti for 10 ps, we found that the H-atoms become more confused with the addition of SAC in the animation of AIMD results. Therefore, the root mean square displacement/deviation (RMSD) of H in the whole system was chosen as an important indicator.108 The shift of H increases significantly and slightly fluctuates with the addition of SACs (Fig. 6a), indicating that H in MgH2 desorbs more easily with the addition of SACs above. To better analyze the displacement and diffusion of H in each part of MgH2, we plotted the displacement (Fig. 6a) and diffusion rates (Fig. 6c) of H in each layer and observed the corresponding structures. As shown in Fig. 6b, we divided the layers for the atomic H in MgH2. In Fig. 6a–c, we can find that the diffusion rate of atomic H away from the surface is greater than that of surface H. For Fig. 6c, the diffusion coefficient (D) was calculated by converting RMSD to mean square displacement (MSD): | (7) |
![[r with combining right harpoon above (vector)]](https://www.rsc.org/images/entities/i_char_0072_20d1.gif) (t)2 is MSD, and t is simulation time.109Fig. 6c clearly shows the change of H diffusivity after adding SAC–Ti. First, the diffusion rate at 10 ps on the right is several orders of magnitude higher than that on the left. Secondly, for pure MgH2, diffusivity decreases with the increase of the number of layers, while that of the heterojunction increases with the increase of the number of layers. It indicates that the addition of catalyst affects the deep H atoms, which is consistent with the results of the above ELF analysis. However, we can confirm that SACs–Ti can significantly increase H diffusivity. We selected several extreme fluctuating points and observed the differences between the two structures (Fig. 6d and e). It can be seen that an H atom breaks the chemical bond with a Mg, and this H atom forms a new chemical bond with Ti. However, pure MgH2 does not change much at this temperature, H is not detached and the vibration amplitude is not very large. As mentioned earlier in this paper, N prevents H from attracting the valence electrons provided by the single-atom metal. When Mg approaches N, it can provide valence electrons to N, which in turn weakens and subsequently breaks the Mg–H bond, thus enhancing the dehydrogenation capacity.
(t)2 is MSD, and t is simulation time.109Fig. 6c clearly shows the change of H diffusivity after adding SAC–Ti. First, the diffusion rate at 10 ps on the right is several orders of magnitude higher than that on the left. Secondly, for pure MgH2, diffusivity decreases with the increase of the number of layers, while that of the heterojunction increases with the increase of the number of layers. It indicates that the addition of catalyst affects the deep H atoms, which is consistent with the results of the above ELF analysis. However, we can confirm that SACs–Ti can significantly increase H diffusivity. We selected several extreme fluctuating points and observed the differences between the two structures (Fig. 6d and e). It can be seen that an H atom breaks the chemical bond with a Mg, and this H atom forms a new chemical bond with Ti. However, pure MgH2 does not change much at this temperature, H is not detached and the vibration amplitude is not very large. As mentioned earlier in this paper, N prevents H from attracting the valence electrons provided by the single-atom metal. When Mg approaches N, it can provide valence electrons to N, which in turn weakens and subsequently breaks the Mg–H bond, thus enhancing the dehydrogenation capacity.
Bonding analysis
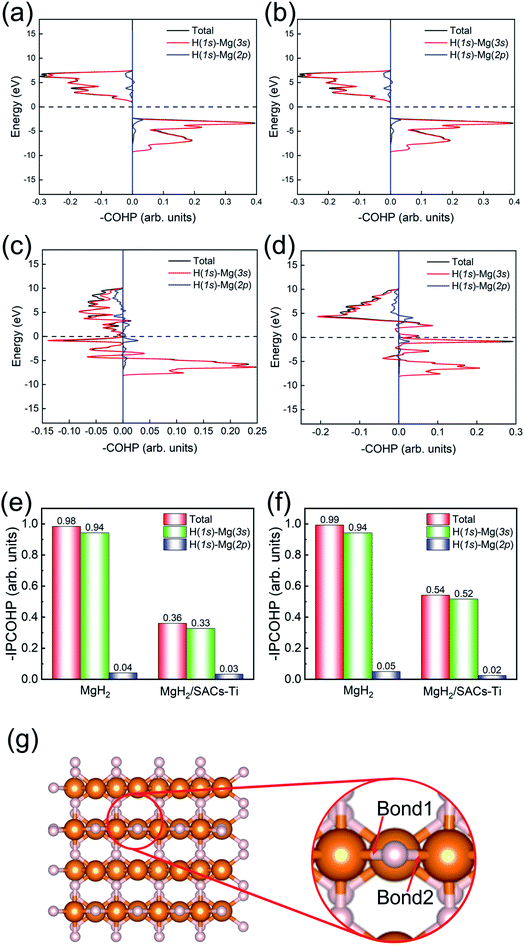
Motivated by the above analyses, herein, we further analyze the Mg–H bonding information by calculating the integrated crystal orbital Hamilton population (ICOHP) integral values of the Mg–H bond (Tables S7–S10†) based on the COHP method (Fig. 7).90,91 Without SACs, the COHP distribution for two bridge Mg–H bonds of MgH2 are the same and no anti-bonding orbitals are occupied, indicating that Mg–H bonds are stabilized by the electrons of H (1s)–Mg (3s) (Fig. 7a and b). Obviously, there is anti-bonding orbital occupation in the bond of H (1s)–Mg (3s), as shown in the lower left of Fig. 7c and d, illustrating that the Mg–H bond of MgH2 becomes very unstable after the addition of SACs. From Fig. 7e and f, the bond strength of Mg–H mainly depends on the electron distribution of H (1s)–Mg (3s). The integral values of ICOHP for bridge Mg–H bonds of MgH2 with SACs are obviously smaller than those without SACs, providing direct evidence that SACs can efficiently promote the dehydrogenation of MgH2 through weakening the Mg–H bond. In addition, we performed similar analyses for the Mg–H bond away from the Ti atom (Fig. S6†). We found that even though these bonds are far from the Ti atom, they still show a decrease in –IPCOHP. And still, some of the bonds show antibonding orbitals, indicating that the catalyst weakens most of the Mg–H bonds nearby. This suggests that the catalyst not only promotes the first H2 dehydrogenation. Similar analyses of other heterojunctions are shown in Tables S11–S16.†Screening other SACs based on the linear scaling relation
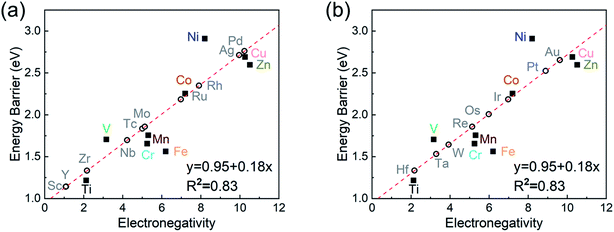
As the final section of this study, we use the fitted correlation of energy barrier vs. electronegativity to predict the dehydrogenation performance of other MgH2/SAC systems (Fig. 8). The detailed parameters are tabulated in Table S17.† Interestingly, Hf, Sc, Zr, and Y are predicted to be promising dopants of SACs due to their low system electronegativity. We expect that these predicted performances can provide further guideline and motivation for future experimental and theoretical studies.Conclusion
In summary, we explicitly analyzed MgH2/SAC heterojunction systems including nine different 3d transition metals as potential hydrogen storage materials, using spin-polarized DFT-D3 calculations. We found that the energy barriers of MgH2 dehydrogenation are significantly reduced by 0.51–2.22 eV through the promotion effects of a MgH2/SAC heterojunction. Among them, MgH2/SAC–Ti showed the best performance and was further analyzed. We found that the electronic properties of the single-atom metal play an essential role in determining the dehydrogenation performance of MgH2/SACs. Using AIMD simulations, these promotion effects were unraveled based on the observation of H diffusivity. To provide further insights, ELFs, charge density difference, H adsorption energy, system electronegativity, d-band center, and COHP were comprehensively analyzed. Finally, we predicted the performance of eighteen other MgH2/SACs based on the proven good linear scaling relation between system electronegativity and dehydrogenation barrier. For practical applications of MgH2, hydrogen storage under conventional conditions can now be achieved by a simple ball milling process with MgH2.110 Based on the previous experimental success in the synthesis of such a heterojunction-MgH2 system73 and the emerging atomic-level control synthesis of a target N-coordination environment (e.g., by developing a single-atom covalent organic framework structure),50 we believe that the experimental synthesis is facile for realizing our designs based on current techniques. Most importantly, this study provides important design guidelines of novel MgH2/SAC heterojunction materials and a solution to the sluggish kinetics of MgH2 dehydrogenation in hydrogen storage.Conflicts of interest
There are no conflicts to declare.Acknowledgements
This work was supported by the National Natural Science Foundation of China (52006073 and 21703161), Natural Science Foundation of Hebei Province of China (E2020502023), and the Interdisciplinary Innovation Program of North China Electric Power University (Grant Number XM2112355).References
- L. Schlapbach and A. Züttel, in Materials for Sustainable Energy: A Collection of Peer-Reviewed Research and Review Articles from Nature Publishing Group, World Scientific, 2011, pp. 265–270 Search PubMed.
- M. Ball and M. Wietschel, Int. J. Hydrogen Energy, 2009, 34, 615–627 CrossRef CAS.
- R. Ramachandran and R. K. Menon, Int. J. Hydrogen Energy, 1998, 23, 593–598 CrossRef CAS.
- Y. Luo, L. Sun, F. Xu and Z. Liu, J. Mater. Chem. A, 2018, 6, 7293–7309 RSC.
- Q. Lai, M. Paskevicius, D. A. Sheppard, C. E. Buckley, A. W. Thornton, M. R. Hill, Q. Gu, J. Mao, Z. Huang and H. K. Liu, ChemSusChem, 2015, 8, 2789–2825 CrossRef CAS PubMed.
- I. Sreedhar, K. M. Kamani, B. M. Kamani, B. M. Reddy and A. Venugopal, Renewable Sustainable Energy Rev., 2018, 91, 838–860 CrossRef CAS.
- A. Züttel, Mater. Today, 2003, 6, 24–33 CrossRef.
- S. Niaz, T. Manzoor and A. H. Pandith, Renewable Sustainable Energy Rev., 2015, 50, 457–469 CrossRef CAS.
- D. Pukazhselvan, V. Kumar and S. K. Singh, Nano Energy, 2012, 1, 566–589 CrossRef CAS.
- N. S. Norberg, T. S. Arthur, S. J. Fredrick and A. L. Prieto, J. Am. Chem. Soc., 2011, 133, 10679–10681 CrossRef CAS PubMed.
- F. Schüth, B. Bogdanović and M. Felderhoff, Chem. Commun., 2004, 2249–2258 RSC.
- X. Zhang, Y. Liu, X. Zhang, J. Hu, M. Gao and H. Pan, Mater. Today Nano, 2020, 9, 100064 CrossRef.
- L. Schlapbach and A. Züttel, Nature, 2001, 414, 353–358 CrossRef CAS PubMed.
- G.-x. Liang, J. Huot, S. Boily, A. Van Neste and R. Schulz, J. Alloys Compd., 1999, 292, 247–252 CrossRef CAS.
- W. Grochala and P. P. Edwards, Chem. Rev., 2004, 104, 1283–1316 CrossRef CAS PubMed.
- W. Li, C. Li, H. Ma and J. Chen, J. Am. Chem. Soc., 2007, 129, 6710–6711 CrossRef CAS PubMed.
- M. Zhu, Y. Lu, L. Ouyang and H. Wang, Materials, 2013, 6, 4654–4674 CrossRef PubMed.
- H. Zhang, X. Zheng, T. Wang and X. Li, Intermetallics, 2016, 70, 29–32 CrossRef CAS.
- X. Hou, R. Hu, T. Zhang, H. Kou and J. Li, J. Power Sources, 2016, 306, 437–447 CrossRef CAS.
- X. Jiang, K. Fu, R. Xiao, Y. Wu, B. Sun, H. Shao, X. Wu, J. Zheng and X. Li, J. Alloys Compd., 2018, 751, 176–182 CrossRef CAS.
- M. Chen, X. Xiao, M. Zhang, M. Liu, X. Huang, J. Zheng, Y. Zhang, L. Jiang and L. Chen, Int. J. Hydrogen Energy, 2019, 44, 1750–1759 CrossRef CAS.
- Y. Lu, H. Wang, J. Liu, L. Ouyang and M. Zhu, J. Power Sources, 2018, 396, 796–802 CrossRef CAS.
- M. Liu, S. Zhao, X. Xiao, M. Chen, C. Sun, Z. Yao, Z. Hu and L. Chen, Nano Energy, 2019, 61, 540–549 CrossRef CAS.
- A. Schneemann, J. L. White, S. Kang, S. Jeong, L. F. Wan, E. S. Cho, T. W. Heo, D. Prendergast, J. J. Urban and B. C. Wood, Chem. Rev., 2018, 118, 10775–10839 CrossRef CAS PubMed.
- G. Xia, Y. Tan, X. Chen, D. Sun, Z. Guo, H. Liu, L. Ouyang, M. Zhu and X. Yu, Adv. Mater., 2015, 27, 5981–5988 CrossRef CAS PubMed.
- E. S. Cho, A. M. Ruminski, Y. S. Liu, P. T. Shea, S. Kang, E. W. Zaia, J. Y. Park, Y. D. Chuang, J. M. Yuk and X. Zhou, Adv. Funct. Mater., 2017, 27, 1704316 CrossRef.
- M. Ma, L. Yang, L. Ouyang, H. Shao and M. Zhu, Energy, 2019, 167, 1205–1211 CrossRef CAS.
- N. Sazelee, N. Idris, M. M. Din, N. Mustafa, N. Ali, M. Yahya, F. H. Yap, N. Sulaiman and M. Ismail, Int. J. Hydrogen Energy, 2018, 43, 20853–20860 CrossRef CAS.
- L.-P. Ma, X.-D. Kang, H.-B. Dai, Y. Liang, Z.-Z. Fang, P.-J. Wang, P. Wang and H.-M. Cheng, Acta Mater., 2009, 57, 2250–2258 CrossRef CAS.
- Y. Liu, H. Du, X. Zhang, Y. Yang, M. Gao and H. Pan, Chem. Commun., 2016, 52, 705–708 RSC.
- A. Valentoni, G. Mulas, S. Enzo and S. Garroni, Phys. Chem. Chem. Phys., 2018, 20, 4100–4108 RSC.
- M. Zhang, X. Xiao, X. Wang, M. Chen, Y. Lu, M. Liu and L. Chen, Nanoscale, 2019, 11, 7465–7473 RSC.
- J. Zhang, R. Shi, Y. Zhu, Y. Liu, Y. Zhang, S. Li and L. Li, ACS Appl. Mater. Interfaces, 2018, 10, 24975–24980 CrossRef CAS PubMed.
- M. Yahya and M. Ismail, J. Energy Chem., 2019, 28, 46–53 CrossRef.
- M. Ismail, N. Mustafa, N. Ali, N. Sazelee and M. Yahya, Int. J. Hydrogen Energy, 2019, 44, 318–324 CrossRef CAS.
- X. Huang, X. Xiao, W. Zhang, X. Fan, L. Zhang, C. Cheng, S. Li, H. Ge, Q. Wang and L. Chen, Phys. Chem. Chem. Phys., 2017, 19, 4019–4029 RSC.
- N. Ali, N. Idris, M. M. Din, M. Yahya and M. Ismail, J. Alloys Compd., 2019, 796, 279–286 CrossRef CAS.
- N. Sazelee, N. Idris, M. M. Din, M. Yahya, N. Ali and M. Ismail, Results Phys., 2020, 16, 102844 CrossRef.
- D. Peng, Z. Ding, Y. Fu, Y. Wang, J. Bi, Y. Li and S. Han, RSC Adv., 2018, 8, 28787–28796 RSC.
- X. Zhang, Z. Leng, M. Gao, J. Hu, F. Du, J. Yao, H. Pan and Y. Liu, J. Power Sources, 2018, 398, 183–192 CrossRef CAS.
- S. Gao, X. Wang, H. Liu, T. He, Y. Wang, S. Li and M. Yan, J. Power Sources, 2019, 438, 227006 CrossRef CAS.
- A. Wang, J. Li and T. Zhang, Nat. Rev. Chem., 2018, 2, 65–81 CrossRef CAS.
- H. Zhang, G. Liu, L. Shi and J. Ye, Adv. Energy Mater., 2018, 8, 1701343 CrossRef.
- L. Zhang, A. Wang, W. Wang, Y. Huang, X. Liu, S. Miao, J. Liu and T. Zhang, ACS Catal., 2015, 5, 6563–6572 CrossRef CAS.
- H. Shen, E. Gracia-Espino, J. Ma, H. Tang, X. Mamat, T. Wagberg, G. Hu and S. Guo, Nano Energy, 2017, 35, 9–16 CrossRef CAS.
- Y. Peng, B. Lu and S. Chen, Adv. Mater., 2018, 30, 1801995 CrossRef PubMed.
- J. Masa, W. Xia, M. Muhler and W. Schuhmann, Angew. Chem., Int. Ed., 2015, 54, 10102–10120 CrossRef CAS PubMed.
- W. Liu, L. Zhang, X. Liu, X. Liu, X. Yang, S. Miao, W. Wang, A. Wang and T. Zhang, J. Am. Chem. Soc., 2017, 139, 10790–10798 CrossRef CAS PubMed.
- Y. Yang, Y. Yang, Z. Pei, K.-H. Wu, C. Tan, H. Wang, L. Wei, A. Mahmood, C. Yan and J. Dong, Matter, 2020, 3, 1442–1476 CrossRef.
- C. Liu, H. Li, F. Liu, J. Chen, Z. Yu, Z. Yuan, C. Wang, H. Zheng, G. Henkelman and L. Wei, J. Am. Chem. Soc., 2020, 142, 21861–21871 CrossRef CAS PubMed.
- Y. Zhou, J. Li, X. Gao, W. Chu, G. Gao and L.-W. Wang, J. Mater. Chem. A, 2021, 9, 9979–9999 RSC.
- H. Li, B. Yu, Z. Zhuang, W. Sun, B. Jia and T. Ma, J. Mater. Chem. A, 2021, 9, 4184–4192 RSC.
- B. Yu, H. Li, J. White, S. Donne, J. Yi, S. Xi, Y. Fu, G. Henkelman, H. Yu and Z. Chen, Adv. Funct. Mater., 2020, 30, 1905665 CrossRef CAS.
- M. Yan, L. Jasin Arachchige, A. Dong, X. L. Zhang, Z. Dai and C. Sun, Inorg. Chem., 2021, 60, 18314–18324 CrossRef CAS PubMed.
- Y. Kong, D. Liu, H. Ai, K. H. Lo, S. Wang and H. Pan, ACS Appl. Nano Mater., 2020, 3, 11274–11281 CrossRef CAS.
- Y. Kong, T. He, A. R. Puente Santiago, D. Liu, A. Du, S. Wang and H. Pan, ChemSusChem, 2021, 14, 3257–3266 CrossRef CAS PubMed.
- C. Liu, Q. Li, J. Zhang, Y. Jin, D. R. MacFarlane and C. Sun, J. Mater. Chem. A, 2019, 7, 4771–4776 RSC.
- B. Zhang, B. Zhang, Y. Jiang, T. Ma, H. Pan and W. Sun, Small, 2021, 17, 2101443 CrossRef CAS PubMed.
- S. Vijay, W. Ju, S. Brückner, S.-C. Tsang, P. Strasser and K. Chan, Nat. Catal., 2021, 4, 1024–1031 CrossRef CAS.
- Z. Li, R. Wu, S. Xiao, Y. Yang, L. Lai, J. S. Chen and Y. Chen, Chem. Eng. J., 2022, 430, 132882 CrossRef CAS.
- X. Shao, X. Yang, J. Xu, S. Liu, S. Miao, X. Liu, X. Su, H. Duan, Y. Huang and T. Zhang, Chem, 2019, 5, 693–705 CAS.
- Y. Ma, B. Chi, W. Liu, L. Cao, Y. Lin, X. Zhang, X. Ye, S. Wei and J. Lu, ACS Catal., 2019, 9, 8404–8412 CrossRef CAS.
- W. Liu, Y. Chen, H. Qi, L. Zhang, W. Yan, X. Liu, X. Yang, S. Miao, W. Wang and C. Liu, Angew. Chem., 2018, 130, 7189–7193 CrossRef.
- X. He, Q. He, Y. Deng, M. Peng, H. Chen, Y. Zhang, S. Yao, M. Zhang, D. Xiao and D. Ma, Nat. Commun., 2019, 10, 1–9 CrossRef PubMed.
- V. Fung, F. F. Tao and D.-e. Jiang, Phys. Chem. Chem. Phys., 2018, 20, 22909–22914 RSC.
- V. Fung, F. Tao and D. e. Jiang, ChemCatChem, 2018, 10, 244–249 CrossRef CAS.
- L. Zhang, Y. Jia, G. Gao, X. Yan, N. Chen, J. Chen, M. T. Soo, B. Wood, D. Yang and A. Du, Chem, 2018, 4, 285–297 CAS.
- M. Sun, J. Ji, M. Hu, M. Weng, Y. Zhang, H. Yu, J. Tang, J. Zheng, Z. Jiang and F. Pan, ACS Catal., 2019, 9, 8213–8223 CrossRef CAS.
- J. Park, S. Lee, H. E. Kim, A. Cho, S. Kim, Y. Ye, J. W. Han, H. Lee, J. H. Jang and J. Lee, Angew. Chem., Int. Ed., 2019, 58, 16038–16042 CrossRef CAS PubMed.
- H.-W. Liang, S. Brüller, R. Dong, J. Zhang, X. Feng and K. Müllen, Nat. Commun., 2015, 6, 1–8 CAS.
- J. Yan, Y. Ji, M. Batmunkh, P. An, J. Zhang, Y. Fu, B. Jia, Y. Li, S. Liu and J. Ye, Angew. Chem., Int. Ed., 2021, 60, 2541–2547 CrossRef CAS PubMed.
- V. Fung, G. Hu, Z. Wu and D.-e. Jiang, J. Phys. Chem. C, 2020, 124, 19571–19578 CrossRef CAS.
- Y. Huang, C. An, Q. Zhang, L. Zang, H. Shao, Y. Liu, Y. Zhang, H. Yuan, C. Wang and Y. Wang, Nano Energy, 2021, 80, 105535 CrossRef CAS.
- G. Kresse and D. Joubert, Phys. Rev. B: Condens. Matter Mater. Phys., 1999, 59, 1758 CrossRef CAS.
- J. P. Perdew, K. Burke and M. Ernzerhof, Phys. Rev. Lett., 1996, 77, 3865 CrossRef CAS PubMed.
- G. Kresse and J. Furthmüller, Phys. Rev. B: Condens. Matter Mater. Phys., 1996, 54, 11169 CrossRef CAS PubMed.
- J. Wellendorff, T. L. Silbaugh, D. Garcia-Pintos, J. K. Nørskov, T. Bligaard, F. Studt and C. T. Campbell, Surf. Sci., 2015, 640, 36–44 CrossRef CAS.
- H. Zheng, H. Li, W. Song, Z. Zhao and G. Henkelman, J. Phys. Chem. C, 2021, 125, 12028–12037 CrossRef CAS.
- A. D. Becke and E. R. Johnson, J. Chem. Phys., 2005, 122, 154104 CrossRef PubMed.
- S. Grimme, J. Antony, S. Ehrlich and H. Krieg, J. Chem. Phys., 2010, 132, 154104 CrossRef PubMed.
- G. Henkelman and H. Jónsson, J. Chem. Phys., 2000, 113, 9978–9985 CrossRef CAS.
- G. Henkelman, B. P. Uberuaga and H. Jónsson, J. Chem. Phys., 2000, 113, 9901–9904 CrossRef CAS.
- G. Kresse and J. Hafner, J. Non-Cryst. Solids, 1993, 47, 558 CAS.
- M. Lakhal, M. Bhihi, A. Benyoussef, A. El Kenz, M. Loulidi and S. Naji, Int. J. Hydrogen Energy, 2015, 40, 6137–6144 CrossRef CAS.
- W. F. Humphrey, A. Dalke and K. Schulten, J. Mol. Graphics, 1996, 14(33–38), 27–38 Search PubMed.
- P. Hnggi, P. Talkner and M. Borkovec, Rev. Mod. Phys., 1990, 62, 251–341 CrossRef.
- W. Yang, S. Xu, K. Ma, C. Wu, I. D. Gates, X. Ding, W. Meng and Z. Gao, Nano Mater. Sci., 2020, 2, 120–131 CrossRef.
- H. Xu, D. Cheng, D. Cao and X. C. Zeng, Nat. Catal., 2018, 1, 339–348 CrossRef CAS.
- B. Hammer and J. K. Norskov, Nature, 1995, 376, 238–240 CrossRef CAS.
- V. L. Deringer, A. L. Tchougréeff and R. Dronskowski, J. Phys. Chem. A, 2011, 115, 5461–5466 CrossRef CAS PubMed.
- R. Dronskowski and P. E. Bloechl, J. Phys. Chem., 1993, 97, 8617–8624 CrossRef CAS.
- S. Maintz, V. L. Deringer, A. L. Tchougréeff and R. Dronskowski, J. Comput. Chem., 2016, 37, 1030–1035 CrossRef CAS PubMed.
- S. Maintz, V. L. Deringer, A. L. Tchougréeff and R. Dronskowski, J. Comput. Chem., 2013, 34, 2557–2567 CrossRef CAS PubMed.
- A. Du, S. C. Smith, X. Yao and G. Lu, Surf. Sci., 2006, 600, 1854–1859 CrossRef CAS.
- Q. Li, S. Qiu, C. Wu, K. T. Lau, C. Sun and B. Jia, J. Phys. Chem. C, 2021, 125, 2357–2363 CrossRef CAS.
- J. J. Liang, J. Alloys Compd., 2007, 446, 72–79 CrossRef.
- L. L. Wang and D. D. Johnson, J. Phys. Chem. C, 2012, 116, 7874–7878 CrossRef CAS.
- M. Lakhal, M. Bhihi, A. Benyoussef, A. El Kenz, M. Loulidi and S. Naji, Int. J. Hydrogen Energy, 2015, 40, 6137–6144 CrossRef CAS.
- A. G. Asuero, A. Sayago and A. Gonzalez, Crit. Rev. Anal. Chem., 2006, 36, 41–59 CrossRef CAS.
- H. Wu, Z. Chen, Y. Wang, E. Cao, F. Xiao, S. Chen, S. Du, Y. Wu and Z. Ren, Energy Environ. Sci., 2019, 12, 2697–2705 RSC.
- W. Yang, S. Xu, M. Kai, C. Wu and Z. Gao, Nano Mater. Sci., 2019, 2, 120–131 CrossRef.
- A. Cao, V. J. Bukas, V. Shadravan, Z. Wang, H. Li, J. Kibsgaard, I. Chorkendorff and J. K. Nørskov, Nat. Commun., 2022, 13, 1–7 Search PubMed.
- M. Uhl, L. M. Sandratskii and J. Kübler, J. Magn. Magn. Mater., 1992, 103, 314–324 CrossRef CAS.
- Y.-C. Liu, K.-T. Chu, R.-L. Jhang, G.-H. Lee and M.-H. Chiang and, Chem. Commun., 2013, 49, 4743–4745 RSC.
- F. Aubertin, U. Gonser and S. J. Campbell, J. Phys. F: Met. Phys., 1984, 14, 2213 CrossRef CAS.
- J. I. V. D. Vlugt, T. B. Rauchfuss, C. M. Whaley and S. R. Wilson, J. Am. Chem. Soc., 2005, 127, 16012–16013 CrossRef PubMed.
- D. A. Papaconstantopoulos and A. C. Switendick, J. Less-Common Met., 1982, 88, 273–281 CrossRef CAS.
- K. Kobayashi and M. U. Salam, Agron. J., 2000, 92, 345–352 CrossRef.
- J. Kubečka, F. Uhlík and P. Košovan, Soft Matter, 2016, 12, 3760–3769 RSC.
- H. Shao, G. Xin, Z. Jie, X. Li and E. Akiba, Nano Energy, 2012, 1, 590–601 CrossRef CAS.
Footnote |
| † Electronic supplementary information (ESI) available. See https://doi.org/10.1039/d2ta02111k |
| This journal is © The Royal Society of Chemistry 2022 |


