Insights into the role of water and surface OH species in methane activation on copper oxide: a combined theoretical and experimental study
Kartavya
Bhola†
ae,
Quang Thang
Trinh†
 bc,
Dapeng
Liu
d,
Yan
Liu
*d and
Samir H.
Mushrif
 *e
*e
aSchool of Chemical and Biomedical Engineering, Nanyang Technological University, 62 Nanyang Drive, 637459, Singapore
bQueensland Micro and Nanotechnology Centre, Griffith University, Nathan, Queensland 4111, Australia
cInstitute of High-Performance Computing (IHPC), Agency for Science, Technology and Research (A*STAR), 1 Fusionopolis Way, #16-16 Connexis, Singapore 138632, Republic of Singapore
dInstitute of Sustainability for Chemicals, Energy and Environment (ISCE2), Agency for Science, Technology and Research (A*STAR), 1 Pesek Road, Jurong Island, Singapore 627833, Republic of Singapore. E-mail: liu_yan@isce2.a-star.edu.sg
eDepartment of Chemical and Materials Engineering, University of Alberta, 9211-116 St NW, Edmonton, Alberta T6G 1H9, Canada. E-mail: mushrif@ualberta.ca
First published on 9th October 2023
Abstract
Despite its huge potential, the utilization of methane as a main feedstock for the synthesis of fuels and value-added chemicals is limited. Earth abundant transition metal oxides (TMOs) are promising catalysts for efficiently transforming methane to value-added products, but their activity is not satisfactory. The introduction of a small amount of water was reported to significantly change TMO's methane activation ability; however, the role of water remains unclear. In this study, a combined theoretical and experimental approach is used to elucidate how the presence of water influences thermodynamics and kinetics of methane activation on the CuO catalyst. Density functional theory (DFT) calculations show that water can be activated to form surface hydroxide species (OH*) on the CuO surface with a very low barrier of 5.6 kJ mol−1. The presence of surface OH* opens a new reaction pathway for the C–H bond activation. DFT computed activation barriers for the first and second activations of methane in the presence of surface hydroxide species are 62 and 76 kJ mol−1, significantly lower than the corresponding barriers of 82 and 154 kJ mol−1 on CuO under dry conditions. FTIR experiments of the methane reaction on CuO at a temperature of 300 °C validate the theoretical prediction, showing that the moist reaction is faster and has lower induction times, indicating that adsorbed water is an initiator for methane activation. Besides, the stability of the CuO catalyst is also enhanced in the presence of water which helps to prevent the consumption of lattice oxygen of CuO and avoid the reduction of CuO to the inactive Cu metallic state.
1. Introduction
Most of the hydrocarbon oxidation reactions catalyzed by transition metal oxide (TMO) catalysts are believed to occur primarily via the Mars–van Krevelen mechanism1–3 with the consumption of lattice oxygen of TMOs4 for nucleophilic oxidation.5 Coordinative unsaturated metal and oxygen atoms on the surface of TMOs are known to be the active sites for those reactions, involving C–H bond activations which are crucial for oxidative conversion.6–9 Since the surface atomic arrangement of metal oxides depends on the cleavage surface or the exposed facets, the surface reactivity of metal oxides varies distinctly with the surface structure and nature of surface atoms.10–15 Trends in reactivity of TMOs across groups and periods may differ significantly. In TMOs, the overlapping 2p-orbitals of oxygen form the low energy valence band, which is highly populated; whereas the overlapping d-orbitals of the transition metal form the conduction band, which is mainly responsible for their diverse electronic and magnetic properties.16–18 Unlike the homolytic bond cleavage typically observed on transition metal surfaces, metal oxides are also able to promote the heterolytic cleavage of the C–H bond with the metal center adsorbing the CHx fragment and the surface lattice oxygen adsorbing the dissociated hydrogen.11 The chemisorption energy of hydrogen is widely used as a suitable descriptor for the reactivity of metal-oxide mediated hydrogen abstraction reactions.15,19–22 All those factors have significant effects in determining the efficacy of the metal oxide to activate the hydrocarbon C–H bonds.Experimental results suggest that rare earth and transition metal oxides are effective catalysts to activate the stable C–H bonds in methane and natural gas molecules.11 However, due to limitations associated with independent experimental surface science techniques to provide fundamental insights into these complex transition metal oxide catalyzed reactions,23–25 computational investigations employing a quantum mechanics based density functional theory (DFT) approach are greatly helpful in complementing the experimental observations and have shed some light on the active sites, mechanisms, and energetics of these surface reactions.26–29 In methane conversion, DFT studies report that its initial C–H activation on TMOs gives rise to methyl species,11,15 which can further be converted to higher value-added oxygenated species like methanol, formaldehyde, and formic acid or is fully oxidized to CO/CO2. Since the first activation of methane is usually the rate-limiting step, a large number of studies have focused on the first C–H bond activation of methane,30–33 whereas subsequent conversions of methane on TMOs are not widely investigated in the literature. To comprehensively evaluate the activity of TMOs in methane conversion, it is crucial to study subsequent activations of methane, not just from the methane partial oxidation perspective but also to gain an understanding on the role of surface-active sites in those oxidations.
Water and hydroxide (OH) species can be present on the TMO's surface either from the catalyst synthesis method or via the adsorption from moisture in the atmosphere.34–36 Surface hydroxide species can act as Brønsted bases when bound to transition metals like Cu, Au, and Ag and have shown to aid in the activation of C–H bonds.36–38 The presence of a co-adsorbed surface hydroxide reduced the activation barrier for ethanol deprotonation on Au(111) in water to 22 kJ mol−1 compared to the high barrier on a bare gold surface (204 kJ mol−1).36 The presence of these surface OH species may influence the catalytic behavior by promoting the activation of C–H bonds of methane and oxidation of other reaction intermediates on the TMO surface as well, as already observed in catalytic Fischer–Tropsch synthesis,39 hydrogenation of ketones,40,41 and CO2 reduction.42–44 These surface OH species can also be formed during the CH4 dissociation reactions under dry conditions or in the presence of moisture or steam as co-reactants, generating strongly bound dissociated H atoms on the catalyst surface (called  ) which block the active, under-coordinated surface O3 site of CuO.6,18,34,45 At sufficiently high coverages or reaction temperatures, these surface OH species can combine with each other to form water,6,45,46 thereby generating oxygen vacancies and thus a partially reduced CuO structure, further influencing the reaction pathways and kinetics.6,47
The selectivity towards partial oxidation of methane (methanol and formaldehyde) as compared to CO/CO2 was stated to be a strong function of the amount of water vapor present in the system for methane oxidation on MoO3/SiO2.48 It has also been shown using computations and experiments that the presence of surface hydroxide species  on CuO, from the dissociation of H2O2, provides a lower energy pathway for glycerol oxidation, without utilizing the surface lattice oxygen, and leads to an increased conversion of glycerol (>70% vs. 10% in the absence of surface OH species).7 Also, the presence of these surface OH species has shown to affect the product distribution and yield of glycerol oxidation. It has been reported that these surface hydroxide species
  can react with the H atom occupying the active surface O3 site (surface hydroxyl species,
  ) easily with a barrier of 27 kJ mol−1 to generate water and free the active sites on the CuO surface. Due to this interaction, the active O3 site is regenerated and contributes to the high conversion of glycerol, as is observed experimentally.7 A similar observation has also been reported for the selective oxidation of glucose to glucuronic acid, driven by the in situ generation of surface hydroxide species on the CuO surface under high frequency ultrasound conditions.6 However, there is limited literature available with respect to the mechanism of how moisture or surface hydroxide species (added externally or generated during the reaction) participate and affect the methane activation energetics and barriers over TMOs. The reduction of methane oxidation barriers, if facilitated with the presence of surface OH species, can lead to the reduction in temperatures employed in the fuel reactor of chemical looping combustion (CLC) or chemical looping reforming (CLR) processes (via improving the heat balance and overall efficiency of these processes)49,50 as well as the higher stability of the catalyst (due to low or no consumption of lattice oxygen in oxidation reactions).
Previous work has shown that an otherwise inactive metal Cu, when converted to its oxide CuO, can activate C–H bonds in methane with three and four centre mechanisms involving surface Cu and lattice oxygen extracting hydrogen from the C–H bond.11 Recently, CuO in both pure and supported forms has been shown to activate the formyl C–H bond to convert glucose to higher value products including gluconic acid3,51 and glucuronic acid6 for biomass oxidation reactions, and to be highly selective for desired products (imine derivatives) under solvent-free conditions by oxidative coupling of aromatic amines.8,10 The use of low-valence dopants such as Cu, Zn, and Mg (relative to the primary oxide) in La2O3 has also shown to decrease the energy of oxygen vacancy formation as well as lower the first activation barrier for methane activation.52,53 These studies provide mechanistic insights into the C–H bond activation, which is central in paving the way for novel processes and catalysts to be used in value-added C1 chemical processing.
The activity of Cu-modified zeolites (via incorporation of Cu-oxo clusters) have also demonstrated the role of Cu–O–Cu species, which are relevant to the pair of surface “–Cu–O–” active centers in CuO, in methane activation. In the study of methane oxidation over Cu loaded zeolites by Groothaert et al.,54 the catalytic methane oxidation was established in sequential steps involving activation of methane and desorption of products upon the oxidative activation of the copper-exchanged zeolite to form Cu–O–Cu species.55 The formation of bis(μ-oxo)di Cu clusters on Cu loaded ZSM-5 was confirmed by spectrophotometric techniques and proposed to be the active sites for the conversion of methane to methanol. The role of active species Cu–O–Cu has also been examined for the selective oxidation of methane to methanol on Cu-exchanged mordenite (MOR) catalysts56–58 and was identified to mimic the active site in the naturally occurring enzyme methane monooxygenase59,60 (that successfully catalyzes methane to methanol in the presence of O2). Recent studies have also confirmed the existence and selective synthesis of other active Cu-oxo species like well-defined trinuclear [Cu3(μ-O)3]2+ clusters in Cu/MOR materials.58,61 Several theoretical studies are exploring and providing insights into the selective oxidation of methane to methanol in Cu exchanged zeolites and mordenite systems providing evidence into the bi or trinuclear metal-oxo centers being the responsible species for methane activation. Li et al. investigated the catalytic behaviour of transition metal ions and oxide clusters (including Fe, Cu, etc.) introduced into mesoporous silica SBA-15, and reported CuOx/SBA-15 to exhibit the best catalytic performance for selective oxidation of methane to formaldehyde, with active sites being the reduced Cu species (which react with molecular oxygen to create active O* species) generated during the reaction.62,63 Although highly selective to partially dehydrogenated products, zeolite mediated methane conversion has its current limitations with respect to (i) the low compositional richness (amount of active metal centers with respect to the total amount of the catalyst) and (ii) the product desorption step due to a) its underlying hydrophilic nature leading to undesired oxidation reactions and b) a separate extraction process hindering the Cu-ZSM/MOR mediated methane to methanol conversion to be converted into a fully catalytic process.64
Although all those above-mentioned studies could provide mechanistic insights into the C–H bond activation on pure, supported, and zeolite incorporated Cu based catalysts and highlight the unique nature of Cu–O bonds that play a vital role in methane activation, the roles of lattice oxygen and surface OH species (generated intrinsically through dissociation of moisture or catalytic preparation or through C–H activation reactions) in the reaction energetics and pathways are not clearly understood. A detailed understanding of the role and contribution of those species towards C–H bond dissociation will help in the design of controlled oxidation reactions on these catalysts. Moreover, due to the presence of various surface species with similar (competing) spectrophotometric signals (e.g., different kinds of OH species in methane dissociation reaction have very similar FTIR signals), it becomes challenging for independent experimental techniques like FTIR to determine the types of adsorbates and surface moieties. Based on the gaps identified above, this study presents the integration of DFT simulations and experimental FTIR studies to investigate methane activation and dissociation to partial oxidation products over the CuO surface. The computational and experimental methods are described in section 2. Section 3 reports the theoretical activation barriers, energetics and pathways of methane dissociation on the CuO(111) surface under dry and moist conditions and also discusses of the role of moisture in both molecular and dissociated forms, in comparison to surface mediated methane dissociation on CuO(111). In section 4, the surface characterization data for the as-synthesized CuO are presented and various surface moieties present during the CuO catalyzed methane oxidation reaction under dry and moist conditions at 300 °C are identified by performing an in situ IR analysis of the reaction at successive time intervals. We conclude our findings in section 5. These insights from the current work would help in the fundamental understanding of the C–H bond activation on TMOs to design novel processes and catalysts for both direct and indirect methods of methane oxidation.
2. Computational and experimental methods
2.1. Computational methods
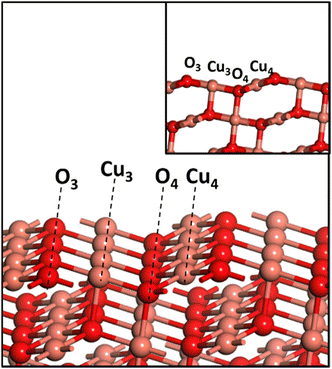
All the calculations in the current work were performed using the PBE exchange–correlation functional of GGA65 as implemented in VASP66 with the PPW implementation within DFT.66,67 The PAW scheme68,69 is used to describe the inner core–valence interaction with a plane wave cut-off energy of 450 eV. A k-point sampling of 4 × 4 × 1 within the Monkhorst–Pack scheme is employed. A three-layer CuO(111) slab with top two layers allowed to be fully relaxed is used in the current study. A vacuum region of 12 Å was wide enough to avoid interactions between different slabs. An energy convergence criterion of 10−4 eV per unit cell along with minimization of interatomic forces to 0.02 eV A−1 was employed. Since CuO is antiferromagnetic in its ground state, the spin polarization setting was turned on for all the calculations. The CuO(111) surface has a repeating surface arrangement of O3–Cu3–O4–Cu4 units (Fig. 1), where the subscript denotes the coordination number of the individual atom. Transition states were searched using the nudged elastic band (NEB) method, and subsequently were confirmed with frequency calculations.All the calculations for CuO systems were performed using the GGA+U scheme with U = 5 eV, as it showed excellent agreement with experimental lattice parameters (a, b, c, and β) and interatomic distances,70 and reproduced experimental band gaps, magnetic moments,16 hydrogen adsorption enthalpy35 and the O1s core-level binding energies of CuO.71 CuO has a monoclinic structure, and the optimized lattice parameters a = 4.52 Å, b = 3.66 Å, c = 5.19 Å, and β = 95.8° agree well with the earlier report of Varghese et al.11 All the calculations have been done on CuO(111) as it is the most stable exposed facet of CuO and has been predominantly found in the HR-TEM image and XRD pattern of the as-synthesized CuO which is used for experiments in this work (presented later in section 4).
The adsorption energy of the intermediate A on the catalysts, Eads, was calculated as follows, for a model adsorption reaction:
| A(g) + * → A* | (1) |
| Using the expression: Eads = EA* − (E* + EA(g)) | (2) |
Free energy barriers of the first and second activation of methane via different pathways under dry and moist conditions are computed at experimental temperature T = 300 °C and partial pressures pCH4 = 1 atm (for both dry and moist conditions) and pH2O = 0.0313 atm (for moist conditions). The free energies of those transition states are referenced to the clean CuO surface and gas phase of CH4 and H2O, using the equation:
ΔG(T, p) = Etransition state + ΔZPE − TΔS − RT![[thin space (1/6-em)]](https://www.rsc.org/images/entities/char_2009.gif) ln(pH2O) ln(pH2O) | (3) |
2.2. Experimental methods
The CuO nanomaterial was synthesized by the precipitation method using NaOH solution as the precipitant. The concentrated 4 M NaOH solution was added dropwise to the Cu(CH3COO)2·H2O solution under continuous stirring at room temperature. The black precipitate appeared as the solution was added. The resultant slurry was aged under stirring at ambient temperature for five hours, and the final product was collected by vacuum filtration, washed with deionized water, dried at 60 °C and calcined at 350 °C for 4 hours.35The characterization of as-synthesized CuO was performed by X-ray diffraction (XRD), field-emission scanning electron microscopy (FE-SEM) and in situ diffuse reflectance infrared Fourier transform spectroscopy (DRIFTS). X-ray diffraction (XRD) patterns were recorded on a Bruker AXS D8 diffractometer at ambient temperature using CuKα radiation operated at 40 kV and 40 mA in the 2θ range of 10–80°, using a step size of 0.05° and a step time of 20 seconds at each point. The morphology of the calcined catalyst was analyzed using a field-emission scanning electron microscope (FE-SEM, Jeol JSM-6700) at an accelerating voltage of 5 kV. Further morphological information was acquired through transmission electron microscopy (TEM) observation using a Tecnai G2 TF20 S-twin microscope operated at 200 kV. Samples were dispersed on carbon grids after sonicating the samples in ethanol for half an hour. In situ DRIFTS spectra were recorded on a Bio-Rad FT-IR3000 MX spectrometer equipped with a Harrick Praying Mantis DRIFTS cell connected to a mercury–cadmium–telluride (MCT) detector and a resolution of 4 cm−1 with an accumulation of 64 scans in a single measurement. The catalyst was loaded into the reaction cell, and the fresh catalyst was pre-treated before each reaction (MS and DRIFTS) in helium at 350 °C for 30 min to clean the surface and any morphological change in the pre- and post-treatment of the catalyst was not observed, ensuring that the catalyst structure was not affected. This was performed for both dry and moist conditions.
For the pretreatment of the catalyst in the DRIFT chamber, based on the reaction under study, different procedures were used as described below:
(i) Moist case: helium (He) was bubbled through water at room temperature and then passed through the FTIR cell after the pretreatment. The FTIR measurements were performed to ensure that the water reached the catalyst surface. After 30 minutes of bubbling, dry He was purged for an hour to ensure none of the gas phase water was present in the system, and the same was verified using FTIR measurements. After this, methane was introduced into the reaction chamber under the reaction conditions and the FTIR measurements were done at successive intervals.
(ii) Dry case: it was ensured that none of the gas phase water or surface hydroxyls are present in the system by using FTIR measurements. After the pretreatment in helium at 350 °C for 30 min to clean the surface, methane was introduced into the reaction chamber under the reaction conditions and the FTIR measurements were done at successive intervals.
Throughout this work, the background spectrum was recorded under a helium atmosphere at the reaction temperature. Background subtractions were performed for all spectra reported in this investigation.
3. Results and discussion
3.1. CuO(111) surface mediated methane activation
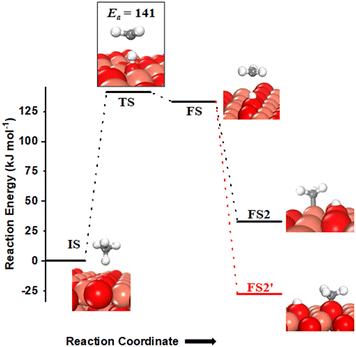
Methane adsorbs weakly on the CuO(111) surface in a physisorption mode with an adsorption energy of only 4 kJ mol−1. The reaction energy for the first activation is the difference in the energy of the physisorbed methane system, referred to as IS, and the dissociation products, referred to as FS (Fig. 2 and 3). As reported in previous studies, two mechanisms are investigated for the first activation of methane on the CuO(111) surface, based on the surface sites that activate the C–H bond11,15 and they are revisited in our study as presented below.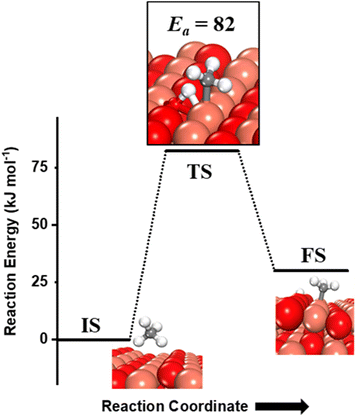 | ||
| Fig. 3 The initial state (IS), transition state (TS) and final state (FS) corresponding to dissociation of methane by the 4-center mechanism involving synergistic roles of the under-coordinated copper (Cu3) and lattice oxygen (O3) atoms on the CuO(111) surface. Activation energy barrier (kJ mol−1) is indicated. The colour scheme is the same as in Fig. 2. | ||
(i) The three-centre or radical mechanism, where the C–H bond is activated by only the under-coordinated lattice oxygen O3 site via hydrogen abstraction. As shown in Fig. 2 FS, this leads to the formation of a CH3 radical, and an H atom adsorbed on the under-coordinated lattice oxygen site O3 (active site for the CuO(111) surface, cf.Fig. 1). The activation barrier for the three-centre mechanism is 141 kJ mol−1, generating methyl radicals. These radicals may evolve directly to the gas phase since there is no stabilization by any surface moieties or may adsorb on the CuO surface,55 either on the surface Cu3 site (cf.Fig. 2, FS2) or O3 site (cf.Fig. 2, FS2′). The latter is 60 kJ mol−1 more stable.
(ii) The four-centre or surface stabilized mechanism, where the C–H bond is activated jointly by the under-coordinated lattice oxygen (O3) and the under-coordinated surface copper (Cu3) atom, forming the surface hydroxyl and adsorbed CH3 species (cf.Fig. 3). While the Cu3 site jointly stretches the C–H bond, the O3 site also polarizes the C–H bond leading to the heterolytic dissociation of methane on the surface.55 The activation barrier for the four-center mechanism is 82 kJ mol−1, with a reaction energy of 30 kJ mol−1.
The barriers and reaction energy for the first activation of methane are different from previously reported values11 (Ea of 130 kJ mol−1 for the 3-center mechanism, and Ea and ΔErxn of 76.6 kJ mol−1 and 3.4 kJ mol−1 for the 4-center mechanism) due to the inclusion of the XPS-benchmarking fitted surface-specific Hubbard U value of 5 eV (unlike the U value of 7 eV which is optimized for bulk properties) in the DFT GGA+U calculations to correct the self-interaction errors associated with transition metal oxides like CuO.34,35 The addition of this U value puts a penalty on the delocalization of the surface electrons of the transition metal, and hence, restricts their participation in bond formation between surface–adsorbates. This leads to the reduced binding energy of the reaction products in this case, and thus higher reaction energies (30 kJ mol−1vs. 3.4 kJ mol−1) are observed. The reaction energies are affected by higher magnitude than the activation barriers due to limited charge transfer between the surface and the adsorbate species in the transition state as compared to the fully adsorbed final state.
The CH3 adsorbed on the Cu3 site on the surface in the four-centre mechanism (cf.Fig. 3) may also diffuse to the non-bonded under-coordinated lattice oxygen (O3) atom via a two-step mechanism with the barrier reported as 77.3 kJ mol−1 previously.11 Thus, under typical catalytic conditions of high temperature (>800 K) for methane oxidation, the diffusion of CH3 from the Cu surface sites to under-coordinated oxygen O3 site is highly probable. Also, the final state thus achieved with both CH3 and hydrogen on adjacent under-coordinated oxygens is much more stable than the configuration in the first activation FS by 60 kJ mol−1.
The hydrogen extracted from the methane molecule, which is also adsorbed on the under-coordinated O3 atom, can also diffuse to the neighboring O atom (Fig. 4). The barrier for this diffusion is 92.5 kJ mol−1, which is low enough to be achieved under the reaction conditions at which methane is oxidized. Thus, both the first activation products of methane can diffuse between the active surface sites and hence for any further reactions; these products are being evaluated without being co-adsorbed adjacent to each other.
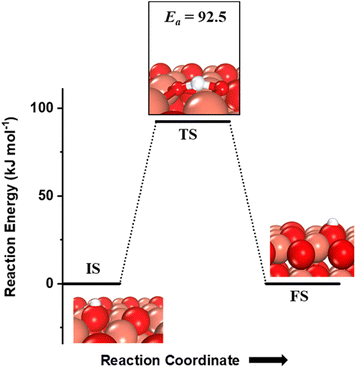 | ||
Fig. 4 The initial state (IS), transition state (TS) and final state (FS) corresponding to the diffusion of surface hydroxyls  from one under-coordinated surface O3 atom to another. Activation barrier (kJ mol−1) is indicated. The color scheme is the same as in Fig. 2. from one under-coordinated surface O3 atom to another. Activation barrier (kJ mol−1) is indicated. The color scheme is the same as in Fig. 2. | ||
The CH3 chemisorbed on O is evaluated for further activation (Fig. 5, IS). The barrier for the dissociation is 154 kJ mol−1 with reference to the CH3 chemisorbed on O, with a reaction energy of 5.9 kJ mol−1 (cf.Fig. 5). The dissociation of CH3 dictates slight restructuring of the CuO surface to permit both H2C- and oxygen to form bonds with the same Cu atom as noticed in the FS. This permits the system to preserve the sp3 nature of the C-center as well as necessitates the lattice oxygen being pulled out from the surface (cf.Fig. 5, FS). As the reaction proceeds, the lattice oxygen pops out of the surface forming HCHO adsorbed on the surface leaving behind a surface oxygen vacancy (cf.Fig. 5, FS2) with a reaction energy of 38.8 kJ mol−1. The calculated desorption energy for HCHO is 54.3 kJ mol−1.
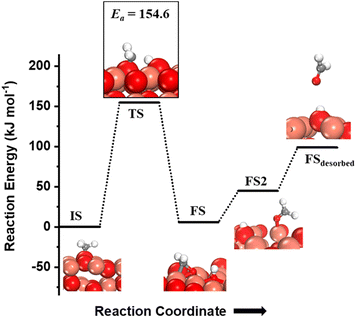 | ||
| Fig. 5 The initial state (IS), transition state (TS), final states (FS, FS2) and desorbed state (FSdesorbed) corresponding to the second activation of methane involving C–H bond dissociation of the methyl fragment adsorbed on the surface O3 site on the CuO(111) surface. Activation energy barrier (kJ mol−1) is indicated. The color scheme is the same as in Fig. 2. | ||
The desorbed formaldehyde can reabsorb on the CuO(111) surface and get oxidized further. The activation of this formyl C–H bond is evaluated on the fresh CuO(111) surface. The adsorption energy is −41 kJ mol−1 in an η1 configuration, where the formaldehyde oxygen is bonded to the surface Cu3 site (Fig. 6, ISη1). This adsorbed state then moves to a more stable state in an η2 configuration where the carbon is bonded to surface under-coordinated oxygen O3, and the formyl oxygen is bonded to surface Cu sites in a bridge configuration (cf.Fig. 6, ISη2). The η2 configuration is more stable than the η1 configuration by 71.4 kJ mol−1.
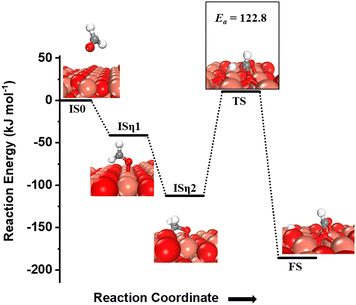 | ||
| Fig. 6 The initial state with gas phase HCHO (IS0), adsorbed state in an η1 configuration (ISη1), adsorbed state in an η2 configuration (ISη2), transition state (TS), and final state (FS) corresponding to the activation of formaldehyde (third activation of methane) on the CuO(111) surface. Activation barrier (kJ mol−1) is indicated. The color scheme is the same as in Fig. 2. | ||
One of the formyl hydrogens is activated by the surface under-coordinated O3 site with a barrier of 122.8 kJ mol−1 (cf.Fig. 6, TS) and a reaction energy of −73.4 kJ mol−1. The oxygen atom of the resulting formyl group can be hydrogenated back with the hydrogen abstracted from the carbon atom in the formaldehyde leading to the formation of formic acid. A similar mechanism is observed for oxidation of glucose to gluconic acid on CuO where O3 of copper oxide (CuO) nanoleaves activates the formyl C–H bond in glucose and incorporates itself into the glucose molecule to oxidize it to gluconic acid.3
3.2. Investigating the role of moisture in methane activation
As mentioned before, the introduction of small amounts of water vapor could drastically change methane activation and oxidation and will be evaluated in this study. The water molecule can participate in activating the C–H bond of methane via two pathways, either in the molecular form (hydrogen shuttling mechanism) or in the dissociated form (via the water dissociation products, e.g. surface OH group, on the CuO surface).6,7,74 In the hydrogen shuttling mechanism, the hydrogen from the C–H bond is abstracted by the oxygen of the water molecule, and one of the two hydrogens of the water molecule is shuttled to the catalyst surface. There are two possible pathways for the shuttling mechanism for the first activation of methane. In the first pathway (Fig. 7a), the C–H bond of methane is only activated via the hydrogen shuttling to the oxygen of the water molecule “in-the-air” without the assistance from the CuO surface, thus generating a methyl radical as a product (cf.Fig. 7a, FS1). The barrier for the radical pathway is 137.7 kJ mol−1. In the second pathway (Fig. 7b), the C–H bond of methane is activated by the oxygen of the water molecule assisted by the CuO surface (forming a bond with the CH3 fragment in the transition state), thus generating adsorbed methyl species on Cu3 of the catalyst surface after the reaction (cf.Fig. 7b, FS2). In this case, the transition state TS2 is stabilized by the surface, and hence the barrier for the C–H bond activation is lower by 16 kJ mol−1. In both pathways, in the process of extracting the hydrogen from methane, water loses one of its hydrogens to the active surface under-coordinated O3 site, thus generating a surface hydroxyl site as well as regenerating H2O in the gas phase, as shown in Fig. 7a, FS1 and 7b, FS2.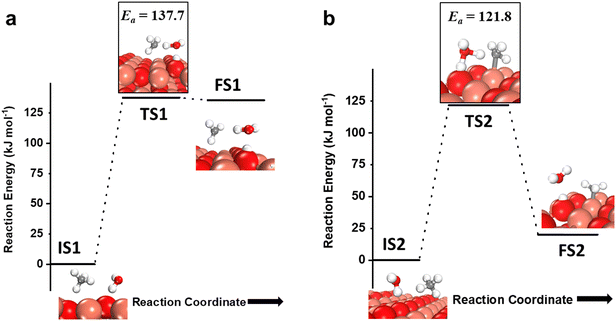 | ||
| Fig. 7 a) The initial state (IS1), transition state (TS1), and final state (FS1) corresponding to the first activation of methane by the hydrogen abstraction mechanism involving only molecular water as a reactant (radical mechanism); b) the initial state (IS2), transition state (TS2), and final state (FS2) corresponding to the surface mediated first activation of methane involving molecular water as a reactant. Activation energy barriers (kJ mol−1) associated with the reaction are indicated. The color scheme is the same as in Fig. 2. | ||
For the second step during the activation of methane, the hydrogen shutting mechanism for the activation of the C–H bond of the methyl species adsorbed on the CuO surface is also investigated (Fig. 8). The C–H bond of the methyl species on the O3 site is activated by the oxygen of the water molecule through the hydrogen abstraction pathway with a barrier of 106.7 kJ mol−1 (cf.Fig. 8). It is important to mention here that for both the first and second activations of methane involving a water molecule, the transition state is entropically confined due to the presence of a gaseous water molecule in the TS (cf.Fig. 6 TS, Fig. 7a TS1, Fig. 7b TS2).
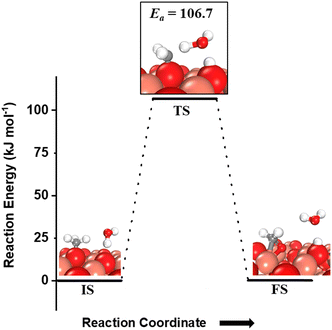 | ||
| Fig. 8 The initial state (IS), transition state (TS), and final state (FS) corresponding to the second activation of methane involving molecular water as a reactant. Activation energy barrier (kJ mol−1) associated with the reaction is indicated. The color scheme is the same as in Fig. 2. | ||
3.3. The formation of surface OH species in methane activation
The OH species can be present on the catalyst surface either as a residue from the preparation method or via the adsorption and dissociation of moisture in the atmosphere.3,6,7,34 They can also be formed on the transition metal oxide's surface during the course of the CH4 activation reactions. Before proceeding to investigate the role of surface OH species in methane activation, the feasibility of the formation of surface OH species in the presence of moisture (Fig. 9), and under dry conditions (Fig. 10) is studied.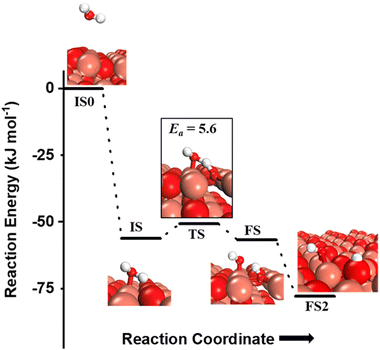 | ||
| Fig. 9 The initial state with gas phase water (IS0), adsorbed state (IS), transition state (TS), final states with surface hydroxide in the top configuration (FS) and with surface hydroxide in the bridge configuration (FS2) for the activation of water on the CuO(111) surface. Activation barrier (kJ mol−1) is indicated. The colour scheme is the same as in Fig. 2. | ||
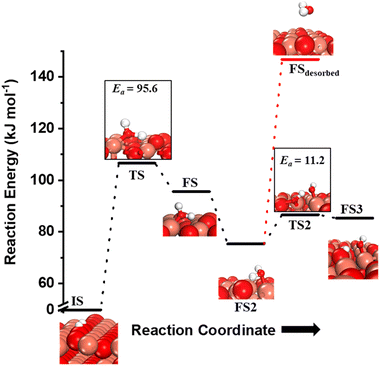 | ||
Fig. 10 The initial state (IS), transition states (TS, TS2), final states (FS, FS2 and FS3), and desorbed state (FSdesorbed) corresponding to the reaction of two  to form water adsorbed next to a vacancy, to form water adsorbed next to a vacancy,  and its further dissociation to form surface hydroxides and its further dissociation to form surface hydroxides  species under dry conditions. Activation energy barriers (kJ mol−1) associated with the reaction are indicated. The color scheme is the same as in Fig. 2. species under dry conditions. Activation energy barriers (kJ mol−1) associated with the reaction are indicated. The color scheme is the same as in Fig. 2. | ||
 and (ii) surface hydroxides
  (cf.Fig. 9, FS). The presence of surface OH on metal oxides has already been detected by experiments.34,35 There are two adsorbed configurations for surface hydroxides
  on the CuO surface: at the top site (cf.Fig. 9, FS) and at the bridge site (cf.Fig. 9, FS2), with the latter being 21 kJ mol−1 more stable than the former. The participation of both those structures is evaluated in the first and second activations of CH4.
It should be noted that the high coverage of surface OH on the CuO surface might not be favorable. When taking into account the entropic penalty to locate the water on the CuO surface from the gas phase of water (computed to be 96.2 kJ mol−1 at an experimental reaction temperature of 300 °C and a low partial pressure of 0.0313 atm for H2O moisture), the free energy barrier for water dissociation on CuO(111) increases to 71.1 kJ mol−1. Furthermore, the availability of Cu3 sites which are needed for H2O dissociation is reduced during the course of reaction since two adjacent Cu3 sites are occupied by the adsorbed OH species in the stable bridge configuration, as is shown in Fig. 9.
 species on the CuO surface. These surface hydroxyls
  can also react to form a water molecule, H2Olattice, leaving an oxygen vacancy, VO on the CuO surface. As depicted in Fig. 10, either of the surface oxygens (with hydrogens adsorbed on them) stretches out of the surface slightly, with a hydrogen atom from one surface hydroxyl
  species migrating to the neighbouring surface hydroxyl
  to form an [O–H–O–H] complex with an elongated O–H bond (cf.Fig. 10, TS). After this hydrogen transfer, the oxygen atom which lost the hydrogen settles back into the lattice, and the other oxygen atom with 2 hydrogens adsorbed on it pops out of the surface leading to the formation of H2Olattice (cf.Fig. 10, FS), leaving a surface with vacancies, VO. The barrier for the formation of H2Olattice is 95.6 kJ mol−1. This indicates that the formation of water on the CuO surface could be possible, even under dry conditions. Bader charge analysis shows that the charge of the Cu3 site coordinating with H2O next to the oxygen vacancy is +0.43, while the charge of the Cu3 site for the clean stoichiometric CuO(111) surface is +0.97. This change of 0.5–0.6 in the charge of this Cu3 site upon the formation of water reflects its reduction from the Cu2+ to Cu+ oxidation state, as was mentioned by Maimaiti et al.18
This water molecule can either desorb with a desorption energy of 71.4 kJ mol−1 (cf.Fig. 10, FSdesorbed) or can further dissociate to form surface hydroxides  . An under-coordinated lattice O3 site activates this O–H bond of H2Olattice, resulting in the formation of a surface hydroxyl
  and a surface hydroxide
  , as seen in the case of water dissociation on clean CuO(111) in section 3.3.1. The barrier for the dissociation of H2Olattice is only 11.2 kJ mol−1 (TS2, Fig. 10), similar to the activation barrier of H2O on the clean surface of 5.6 kJ mol−1 (Fig. 9). Hence, the presence of surface hydroxyls
  species on the CuO surface can serve as a source of water as well as surface hydroxides
  even under dry reaction conditions (cf.Fig. 10). It should be noted that the barriers for methane activation and CH3 dehydrogenation on the clean surface and on the surface with the oxygen vacancy are also almost the same, suggesting that the presence of oxygen vacancies generated during the formation of surface OH under dry conditions does not have much influence on the computed activation barriers.
3.4. The role of surface OH species in methane activation
As discussed in section 3.3, surface hydroxides can be generated both from the dissociation of water, as well as from the reaction of surface hydroxyls
  under dry reaction conditions. These surface hydroxides can activate the C–H bonds of methane. The first activation of methane can proceed through the hydrogen abstraction mechanism with a barrier of 130.9 kJ mol−1, where the oxygen of the hydroxide activates the C–H bond of methane, generating a methyl radical and a water molecule (Fig. 11).
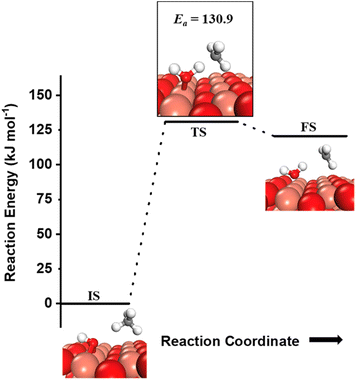 | ||
Fig. 11 Initial state (IS) and transition state (TS) for the first activation of methane by surface hydroxides  via the radical mechanism. Activation energy barrier Ea (kJ mol−1) for the reaction is indicated. The color scheme is the same as in Fig. 2. via the radical mechanism. Activation energy barrier Ea (kJ mol−1) for the reaction is indicated. The color scheme is the same as in Fig. 2. | ||
The activation of C–H bonds of methane can also occur via the involvement of both surface sites or only by the oxygen of surface hydroxide, generating methyl species on Cu3 sites (FS in Fig. 12) or the surface O3 site (FS′ in Fig. 12), correspondingly. The barrier for the surface mediated activation with CH3 adsorbed on the Cu3 site in the final state is only 62.6 kJ mol−1 (TS in Fig. 12) which is similar to the calculated barrier of 61.6 kJ mol−1 for the pathway with CH3 adsorbed on the O3 site in the final state (TS′ in Fig. 12).
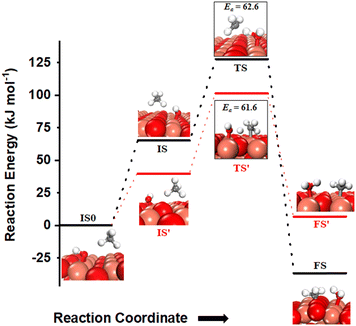 | ||
Fig. 12 The most stable initial state (IS0), reaction initial state for the first activation of methane (IS and IS′), transition states (TS and TS′) and final states (FS and FS′) corresponding to the surface mediated first activation of methane by surface hydroxides  . Activation energy barriers (kJ mol−1) associated with the reaction are indicated. The color scheme is the same as in Fig. 2. . Activation energy barriers (kJ mol−1) associated with the reaction are indicated. The color scheme is the same as in Fig. 2. | ||
For the second activation of methane, the surface hydroxide  moves to a top configuration (IS in Fig. 13) to facilitate the activation of methyl C–H bonds, which is 41.8 kJ mol−1 less stable than the bridge configuration (IS0 in Fig. 13). The oxygen of the surface hydroxide extracts the hydrogen from the methyl species with a barrier of 76.9 kJ mol−1 (TS, Fig. 13) This activation leads to the rearrangement of the CuO surface with both oxygen and carbon attaching to the same surface Cu site as can be seen in both the TS and FS (cf.Fig. 13). This ensures that carbon stays in its sp3 configuration. This rearrangement also mediates the popping out of lattice oxygen leading to the formation of HCHO in FS2. The desorption energy for HCHO is 55.6 kJ mol−1.
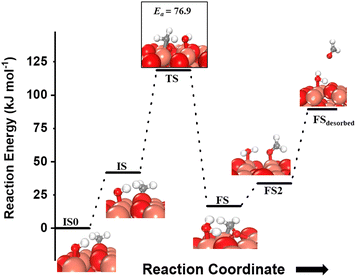 | ||
Fig. 13 The most stable initial state (IS0), reaction initial state for the second activation of methane (IS), transition state (TS), final states (FS and FS2), and desorbed state (FSdesorbed) corresponding to the second activation of methane by surface hydroxides  . Activation energy barrier (kJ mol−1) is indicated. The color scheme is the same as in Fig. 2. . Activation energy barrier (kJ mol−1) is indicated. The color scheme is the same as in Fig. 2. | ||
Instead of further dehydrogenation of CH3, an alternate possible pathway is where the OCH3 fragment (O is the surface lattice oxygen of CuO on which the CH3 molecule adsorbs) pops out from the surface and subsequently hydrogenated by the adjacent H atom, producing methanol. However, the activation barriers for these reactions are 272 and 226 kJ mol−1, both, under dry and moist conditions. These high activation barriers would kinetically hinder the formation of methanol under our reaction conditions.
3.5. Comparison of dry and moist surface activation methane
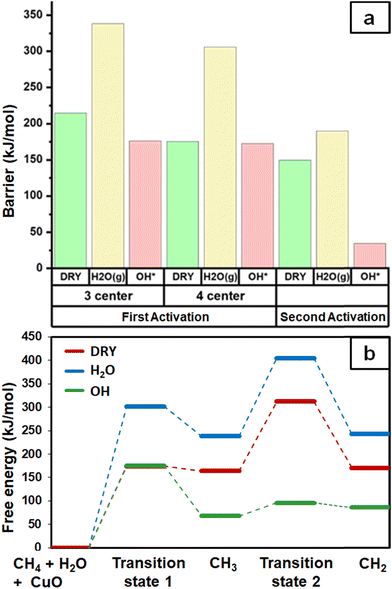
As expected, the barrier for the first activation of methane is higher than the second activation under all the three conditions, i.e. surface reaction, reaction with gas phase water, and reaction with surface OH (Fig. 14). For all the C–H activations studied, the free energy barrier is substantially high for the mechanism involving molecular H2O (Fig. 14a). This is due to the entropically constrained nature of the transition state with gaseous molecules (H2O in the gas phase) leading to a higher drop in entropy, and thus a higher free energy barrier. For the second activation barrier of methane, the contribution of entropy in the activation of the C–H bond with molecular gas-phase water increases the free energy barrier more as compared to the dry case due to entrapment of gaseous species in the TS. The inclusion of entropy in activation by surface hydroxide species is having the reverse effect on the barriers due to lattice oxygen popping out of the surface in the form adsorbed water and thus increasing the entropy of the system, explaining the trend for the second activation free energy barriers H2O(g) > dry surface > surface OH (Fig. 14b).It is evident from the free energy profile presented in Fig. 14b that dissociated water in the form of surface hydroxide  species can reduce the barrier for the first and subsequent C–H bond activations of methane. This observation could open a new approach to conduct the activation of methane in a more efficient way by utilizing the contribution of surface OH* on CuO to overcome the high barrier of methane activation and conversion. As discussed in previous sections, these surface hydroxide
  species can be present in the system due to (i) the low barrier of dissociation of water (supplied externally) and (ii) generated during the course of the reaction under dry conditions (reaction of surface hydroxyls generated from activation of C–H bonds). Inspired from this observation, experiments are conducted to confirm the theoretical prediction, and are discussed in the subsequent section.
4. Experimental study for the methane activation and conversion on the CuO catalyst under dry and moist conditions
4.1. CuO morphology and surface characterization
The as-synthesized CuO was characterized using XRD, and all the peaks in the pattern were representative of the monoclinic C/2c symmetry of cupric oxide.35 The morphology of CuO nanoparticles was examined by SEM (cf.Fig. 15), presenting an ellipsoidal morphology, resembling nanopellets or rice-like structures. HRTEM was conducted and focused on different regions of the pellet, and lattice fringes with a d-spacing of 0.23 nm were typically observed, corresponding to the (111) plane as the most exposed surface of the as-prepared CuO. The same surface is used to model reactions in the computational work.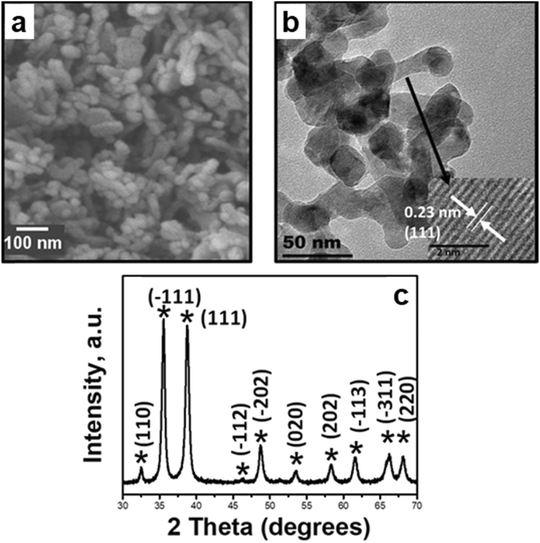 | ||
| Fig. 15 Morphology and structure characterization of the as-synthesized CuO: a) SEM image depicting the nanopellet morphology, b) bright field TEM image with the HRTEM image insert for the nanopellets depicting lattice fringes corresponding to the (111) facet, and c) X-ray diffractograms of as-synthesized CuO with signature peaks of copper(II) oxide.35 Copyright 2017 American Chemical Society. | ||
4.2. Surface species characterization on dry and moist surfaces using DRIFTS
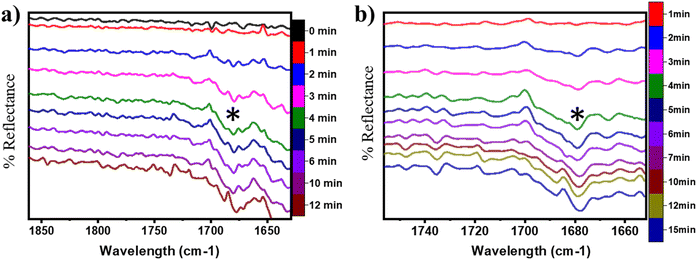
As discussed in sections 3.1 to 3.4, methane oxidation on the CuO surface (i) can lead to various possible partially oxidized intermediates and species prior to the evolution of combustion products like CO2, CO, and H2O, (ii) can lead to the formation of surface hydroxide species even under the dry conditions (H originates from CH4), and (ii) the presence of surface hydroxide species originating from water in the system reduces the barriers for the first and second activation of methane under moist conditions. To investigate these findings, in situ DRIFTS analysis of the CH4 reaction with CuO at the reaction temperature of 300 °C is carried out under both dry (absence of any form of external source of moisture or surface hydroxide species) and moist conditions (catalytic surface with adsorbed water and hydroxide species). The IR spectra were recorded at successive time intervals to gauge the evolution of various surface species and the various regions of interest (HC–O stretching region, aldehydic/formic C
![[double bond, length as m-dash]](https://www.rsc.org/images/entities/char_e001.gif) O stretching region, O–H stretching).
O stretching region, O–H stretching).
![[double bond, length as m-dash]](https://www.rsc.org/images/entities/b_char_e001.gif) O stretching vibrations.
Our calculations have shown that the second activation of methane results in the formation of formaldehyde (H2C
O stretching vibrations.
Our calculations have shown that the second activation of methane results in the formation of formaldehyde (H2C![[double bond, length as m-dash]](https://www.rsc.org/images/entities/char_e001.gif) O) on the CuO surface under both moist (cf.Fig. 8 FS and 13 FS) and dry conditions (cf.Fig. 5 FS2). The IR spectra of the C
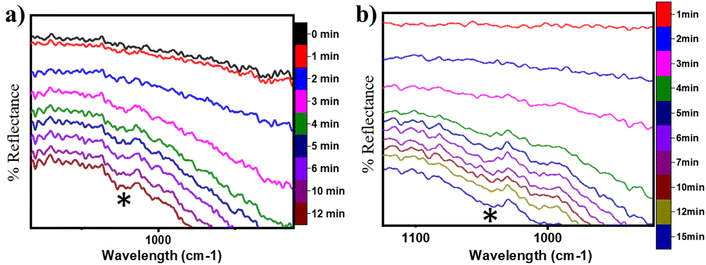
O) on the CuO surface under both moist (cf.Fig. 8 FS and 13 FS) and dry conditions (cf.Fig. 5 FS2). The IR spectra of the C![[double bond, length as m-dash]](https://www.rsc.org/images/entities/char_e001.gif) O stretching region for the CH4 reaction on CuO at 300 °C under moist and dry conditions are shown in Fig. 17a and b, respectively. The absorbance peak around 1680 cm−1 appears in the IR spectra for moist and dry reactions. The peak at 1680 cm−1 corresponds to double bonded carbon and oxygen of aldehyde groups, and hence this peak is assigned to the C
O stretching region for the CH4 reaction on CuO at 300 °C under moist and dry conditions are shown in Fig. 17a and b, respectively. The absorbance peak around 1680 cm−1 appears in the IR spectra for moist and dry reactions. The peak at 1680 cm−1 corresponds to double bonded carbon and oxygen of aldehyde groups, and hence this peak is assigned to the C![[double bond, length as m-dash]](https://www.rsc.org/images/entities/char_e001.gif) O peak of the formaldehyde group. This validates the DFT computed reaction pathway for the second activation of methane generating formaldehyde as an intermediate under both moist (cf.Fig. 8 FS and 13 FS) and dry conditions (cf.Fig. 5 FS2). The peaks in both dry and moist cases appear at a similar time in the reaction (∼2–3 min).
O peak of the formaldehyde group. This validates the DFT computed reaction pathway for the second activation of methane generating formaldehyde as an intermediate under both moist (cf.Fig. 8 FS and 13 FS) and dry conditions (cf.Fig. 5 FS2). The peaks in both dry and moist cases appear at a similar time in the reaction (∼2–3 min).
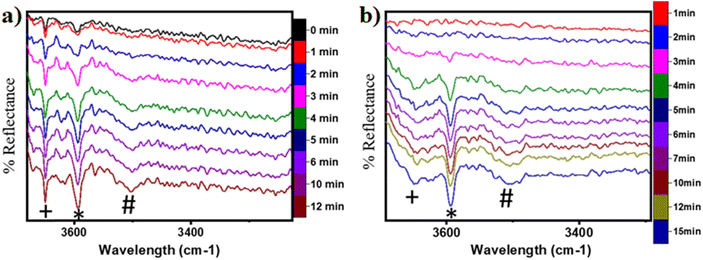
In the previous FTIR study,35 it was established that the sharp peaks at 3595 cm−1 and 3650 cm−1 correspond to surface hydroxyl species,  , and surface hydroxide species,
  , respectively. These insights are applied to the IR spectra recorded for the methane reactions on moist and dry CuO surfaces (cf.Fig. 18a and b) and provide the following observations:
1. IR spectra for the moist reaction shown in Fig. 18a present two sharp O–H stretching peaks (≈3595 cm−1 and ≈3650 cm−1) of similar intensity at time = 0, even before methane is introduced to the chamber, thus confirming the presence of both  and
and  species from the splitting of water. This validates the low activation barrier reported for the dissociation of water on the CuO surface (section 3.3).
2. IR spectra for the moist reaction show that both  and
and  peaks (≈3595 cm−1 and ≈3650 cm−1) continue to increase in intensity as the reaction proceeds, with the peak at 3595 cm−1 increasing with higher intensity than the peak at 3650 cm−1. This agrees with the higher number of
  being formed by the C–H activation of methane (and other reaction intermediates) than the
  .
.
3. The broad peak around 3500 cm−1 in the IR spectra for the moist reaction corresponding to stretching vibrations of hydrogen bonded O–H bonds and (H–OLattice–H)* starts to appear in the reaction. This agrees with the C–H bond activation with surface  species generating surface H2O species, which again split to provide both
  and
and  species.
4. The IR spectra in Fig. 18b for the dry reaction show the absence of OH peaks in the OH stretching region at the start of the reaction, thus establishing that the system does not contain identifiable amounts of adsorbed water or adsorbed surface hydroxyls ( and
and  ) at the start of the reaction.
5. IR spectra for the dry reaction show that the  peak (≈3595 cm−1) starts to appear first in the O–H region. This is in line with the generation of
  as the product of the first activation of methane (section 3.1).
6. As the reaction proceeds, the peak corresponding to the surface hydroxide  (≈3650 cm−1) starts to develop in the dry reaction at about 4 minutes (cf.Fig. 18b).
a. In the dry experiment, the C–H bonds of methane are only activated via the extraction of hydrogen by the surface under-coordinated O3 sites, leading to the formation of only surface hydroxyl species  . Hence the presence of the peak at 3650 cm−1 corresponding to surface hydroxide species
  could not be explained if only lattice oxygen is involved in methane activation under dry conditions.
b. This peak indicates the formation of surface hydroxides  as the reaction proceeds and validates the findings regarding the generation of surface hydroxides from the reaction of surface hydroxyls under dry conditions.
Thus, even under dry conditions, the CuO(111) surface may only activate the C–H bonds of methane for the initial period only. In this induction period, enough  is generated that reacts to form H2Olattice, that consequently dissociates to form surface hydroxides
  . After this initial induction period, the dissociation of methane would proceed through activation via the surface hydroxide
  pathway, since the barriers reported for this pathway are lower compared to the pathways where only surface-active sites activate methane C–H bonds (section 3.5).
7. The peaks in the O–H stretching region of the IR spectra for the moist experiment develop faster than for the dry case (2 min vs. 3–4 min), indicating faster kinetics or lower induction time needed due to the presence of moisture as a promoter.
5. Summary and conclusions
In summary, the reaction mechanism and various pathways for methane activation on the CuO(111) surface under dry conditions, as well as in the presence of moisture in the system were investigated. For the initial activation of methane under dry conditions, the four-center mechanism (Ea = 82 kJ mol−1) has a lower activation barrier than the three-center mechanism (141 kJ mol−1). The surface hydroxyls generated during the C–H bond cleavage can diffuse on the surface with a barrier of about 92 kJ mol−1. The barriers for the subsequent second and third C–H activations during methane conversion (e.g. C–H bond activation in CH3 and CH2O intermediates) are 154.7 and 122 kJ mol−1, respectively. In the presence of physisorbed molecular water, the barriers for the initial and second activations are slightly lower, i.e., 121 kJ mol−1 and 106 kJ mol−1. The formation of surface OH species from the dissociation of water as well as under dry conditions from the participation of lattice oxygen was evaluated. Due to the low barrier of water dissociation (5 kJ mol−1) on CuO(111) and the huge entropy of entrapment associated with the transition states involving molecular water as a reactant, it was concluded that water would participate in the reaction in the form of surface hydroxides. Calculations were performed to investigate the formation of surface hydroxides under dry conditions and the mechanism was revealed. Two surface hydroxyls react to form water with one of the lattice oxygens popping out from the surface with a barrier of 106.6 kJ mol−1. This water can easily split on the CuO surface with a low barrier of 11 kJ mol−1, thus generating surface hydroxides. The first and second barriers in the presence of surface hydroxide species are 62 kJ mol−1 and 76 kJ mol−1. The barriers in the presence of surface hydroxides are lower than those in the dry case and with molecular water. FTIR experiments of the methane reaction on CuO were performed at a temperature of 300 °C and the subsequent spectra were recorded at successive time intervals for both dry and moist cases. The IR spectra confirms the presence of the methoxy (1050 cm−1), aldehyde C
![[double bond, length as m-dash]](https://www.rsc.org/images/entities/char_e001.gif) O (1680 cm−1), and various surface OH species (3500 cm−1, 3595 cm−1, 3650 cm−1) for the reaction in both the absence and presence of moisture. The time of first peak appearances in the IR spectra analysis for the moist reaction depicts it to be a bit faster and with slightly lower induction times, indicating adsorbed water to be acting as an initiator. Also, the peak in the IR spectra of the dry reaction confirms the formation of surface hydroxide
O (1680 cm−1), and various surface OH species (3500 cm−1, 3595 cm−1, 3650 cm−1) for the reaction in both the absence and presence of moisture. The time of first peak appearances in the IR spectra analysis for the moist reaction depicts it to be a bit faster and with slightly lower induction times, indicating adsorbed water to be acting as an initiator. Also, the peak in the IR spectra of the dry reaction confirms the formation of surface hydroxide  even without the presence of any water source in the system. The insights from the current work provide the computational and experimental evidence that even when methane reacts on the CuO surface under dry conditions, the lattice oxygen does not directly activate the methane C–H bonds, but rather activates the C–H bonds in the form of surface hydroxide species. It is also established that (dissociated) water can not only act as an initiator to reduce the induction time but can also lead to an increased lifetime of the catalysts due to it being an oxygen donor in the initial stages of methane activation.
Conflicts of interest
There are no conflicts to declare.Acknowledgements
Q. T. T. acknowledges the financial support by the A*STAR AME IAF-PP grant (Grant No. A19E9a0103), the National Research Foundation, Singapore, and A*STAR (Agency for Science, Technology and Research) under its LCER FI program Award No. U2102d2002 and the assistance of resources and services from the National Computational Infrastructure (NCI), which is supported by the Australian Government. Y. L. acknowledges the financial support from Singapore Energy Center (SgEC-Core2021-48). KB acknowledges financial support by Nanyang Technological University, Singapore. SHM acknowledges financial support by NSERC Canada, via their Discovery Grants program. The Digital Research Alliance of Canada provided computational resources for this study.References
- S. Minicò, S. Scirè, C. Crisafulli, R. Maggiore and S. Galvagno, Appl. Catal., B, 2000, 28, 245–251 CrossRef.
- S. Scirè, S. Minicò, C. Crisafulli and S. Galvagno, Catal. Commun., 2001, 2, 229–232 CrossRef.
- P. N. Amaniampong, Q. T. Trinh, B. Wang, A. Borgna, Y. Yang and S. H. Mushrif, Angew. Chem., Int. Ed., 2015, 54, 8928–8933 CrossRef CAS PubMed.
- T. Ono, T. Nakajo and T. Hironaka, J. Chem. Soc., Faraday Trans., 1990, 86, 4077–4081 RSC.
- J. Haber, in Solid State Chemistry in Catalysis, American Chemical Society, 1985, ch. 1, vol. 279, pp. 3–21 Search PubMed.
- P. N. Amaniampong, Q. T. Trinh, K. De Oliveira Vigier, D. Q. Dao, N. H. Tran, Y. Wang, M. P. Sherburne and F. Jérôme, J. Am. Chem. Soc., 2019, 141, 14772–14779 CrossRef CAS PubMed.
- P. N. Amaniampong, Q. T. Trinh, J. J. Varghese, R. Behling, S. Valange, S. H. Mushrif and F. Jérôme, Green Chem., 2018, 20, 2730–2741 RSC.
- C. Sarkar, S. Pendem, A. Shrotri, D. Q. Dao, P. P. T. Mai, T. N. Ngoc, D. R. Chandaka, T. V. Rao, Q. T. Trinh, M. P. Sherburne and J. Mondal, ACS Appl. Mater. Interfaces, 2019, 11, 11722–11735 CrossRef CAS PubMed.
- Q. T. Trinh, A. Banerjee, K. B. Ansari, D. Q. Dao, A. Drif, N. T. Binh, D. T. Tung, P. M. Q. Binh, P. N. Amaniampong, P. T. Huyen and M. T. Le, in Biorefinery of Alternative Resources: Targeting Green Fuels and Platform Chemicals, ed. S. Nanda, D.-V. N. Vo and P. K. Sarangi, Springer Singapore, Singapore, 2020, pp. 317–353 Search PubMed.
- R. Singuru, Q. T. Trinh, B. Banerjee, B. Govinda Rao, L. Bai, A. Bhaumik, B. M. Reddy, H. Hirao and J. Mondal, ACS Omega, 2016, 1, 1121–1138 CrossRef CAS PubMed.
- J. J. Varghese, Q. T. Trinh and S. H. Mushrif, Catal. Sci. Technol., 2016, 6, 3984–3996 RSC.
- K. B. Ansari, A. Banerjee, M. Danish, S. Z. Hassan, D. V. Sahayaraj, M. S. Khan, T. T. N. Phan and Q. T. Trinh, in Innovations in Thermochemical Technologies for Biofuel Processing, ed. S. Nanda and D.-V. Vo, Elsevier, 2022, pp. 115–147 Search PubMed.
- G. Liu, P. R. Narangari, Q. T. Trinh, W. Tu, M. Kraft, H. H. Tan, C. Jagadish, T. S. Choksi, J. W. Ager, S. Karuturi and R. Xu, ACS Catal., 2021, 11, 11416–11428 CrossRef CAS.
- M. A. Tekalgne, K. V. Nguyen, D. L. T. Nguyen, V.-H. Nguyen, T. P. Nguyen, D.-V. N. Vo, Q. T. Trinh, A. Hasani, H. H. Do, T. H. Lee, H. W. Jang, H. S. Le, Q. V. Le and S. Y. Kim, J. Alloys Compd., 2020, 823, 153897 CrossRef CAS.
- J. J. Varghese and S. H. Mushrif, J. Phys. Chem. C, 2017, 121, 17969–17981 CrossRef CAS.
- J. Hu, D. Li, J. G. Lu and R. Wu, J. Phys. Chem. C, 2010, 114, 17120–17126 CrossRef CAS.
- O. Lupan, N. Ababii, A. K. Mishra, O. Gronenberg, A. Vahl, U. Schürmann, V. Duppel, H. Krüger, L. Chow, L. Kienle, F. Faupel, R. Adelung, N. H. de Leeuw and S. Hansen, ACS Appl. Mater. Interfaces, 2020, 12, 42248–42263 CrossRef CAS PubMed.
- Y. Maimaiti, M. Nolan and S. D. Elliott, Phys. Chem. Chem. Phys., 2014, 16, 3036–3046 RSC.
- A. A. Latimer, A. R. Kulkarni, H. Aljama, J. H. Montoya, J. S. Yoo, C. Tsai, F. Abild-Pedersen, F. Studt and J. K. Norskov, Nat. Mater., 2017, 16, 225–229 CrossRef CAS PubMed.
- E. C. Tyo, C. Yin, M. Di Vece, Q. Qian, G. Kwon, S. Lee, B. Lee, J. E. DeBartolo, S. Seifert, R. E. Winans, R. Si, B. Ricks, S. Goergen, M. Rutter, B. Zugic, M. Flytzani-Stephanopoulos, Z. W. Wang, R. E. Palmer, M. Neurock and S. Vajda, ACS Catal., 2012, 2, 2409–2423 CrossRef CAS.
- S. Atzkern, S. V. Borisenko, M. Knupfer, M. S. Golden, J. Fink, A. N. Yaresko, V. N. Antonov, M. Klemm and S. Horn, Phys. Rev. B: Condens. Matter Mater. Phys., 2000, 61, 12792–12798 CrossRef CAS.
- G. Fu, Z.-N. Chen, X. Xu and H.-L. Wan, J. Phys. Chem. A, 2008, 112, 717–721 CrossRef CAS PubMed.
- Q. T. Trinh, K. F. Tan, A. Borgna and M. Saeys, J. Phys. Chem. C, 2013, 117, 1684–1691 CrossRef CAS.
- Q. T. Trinh, B. K. Chethana and S. H. Mushrif, J. Phys. Chem. C, 2015, 119, 17137–17145 CrossRef CAS.
- K. B. Ansari, M. Danish, A. Banerjee, S. Z. Hassan, D. V. Sahayaraj, M. S. Khan, P. T. Huyen and Q. T. Trinh, in Innovations in Thermochemical Technologies for Biofuel Processing, ed. S. Nanda and D.-V. Vo, Elsevier, 2022, pp. 21–62 Search PubMed.
- Q. T. Trinh, A. Banerjee, Y. Yang and S. H. Mushrif, J. Phys. Chem. C, 2017, 121, 1099–1112 CrossRef CAS.
- Q. T. Trinh, J. Yang, J. Y. Lee and M. Saeys, J. Catal., 2012, 291, 26–35 CrossRef CAS.
- Q. T. Trinh, A. V. Nguyen, D. C. Huynh, T. H. Pham and S. H. Mushrif, Catal. Sci. Technol., 2016, 6, 5871–5883 RSC.
- G. Liu, Q. T. Trinh, H. Wang, S. Wu, J. M. Arce-Ramos, M. B. Sullivan, M. Kraft, J. W. Ager, J. Zhang and R. Xu, Small, 2023, 2301379, DOI:10.1002/smll.202301379.
- J. A. Labinger and J. E. Bercaw, Nature, 2002, 417, 507–514 CrossRef CAS PubMed.
- J. K. Nørskov, T. Bligaard, B. Hvolbæk, F. Abild-Pedersen, I. Chorkendorff and C. H. Christensen, Chem. Soc. Rev., 2008, 37, 2163–2171 RSC.
- A. A. Latimer, A. R. Kulkarni, H. Aljama, J. H. Montoya, J. S. Yoo, C. Tsai, F. Abild-Pedersen, F. Studt and J. K. Nørskov, Nat. Mater., 2016, 16, 225 CrossRef PubMed.
- B. Xing, X.-Y. Pang and G.-C. Wang, J. Catal., 2011, 282, 74–82 CrossRef CAS.
- Q. T. Trinh, K. Bhola, P. N. Amaniampong, F. Jérôme and S. H. Mushrif, J. Phys. Chem. C, 2018, 122, 22397–22406 CrossRef CAS.
- K. Bhola, J. J. Varghese, L. Dapeng, Y. Liu and S. H. Mushrif, J. Phys. Chem. C, 2017, 121, 21343–21353 CrossRef CAS.
- B. N. Zope, D. D. Hibbitts, M. Neurock and R. J. Davis, Science, 2010, 330, 74–78 CrossRef CAS PubMed.
- D. D. Hibbitts and M. Neurock, J. Catal., 2013, 299, 261–271 CrossRef CAS.
- D. Hibbitts and M. Neurock, Surf. Sci., 2016, 650, 210–220 CrossRef CAS.
- G. T. K. K. Gunasooriya, A. P. van Bavel, H. P. C. E. Kuipers and M. Saeys, ACS Catal., 2016, 6, 3660–3664 CrossRef CAS.
- J. E. De Vrieze, J. W. Thybaut and M. Saeys, ACS Catal., 2018, 8, 7539–7548 CrossRef CAS.
- R. Paul, S. C. Shit, T. Fovanna, D. Ferri, B. Srinivasa Rao, G. T. K. K. Gunasooriya, D. Q. Dao, Q. V. Le, I. Shown, M. P. Sherburne, Q. T. Trinh and J. Mondal, ACS Appl. Mater. Interfaces, 2020, 12, 50550–50565 CrossRef CAS PubMed.
- S. Mu, H. Lu, Q. Wu, L. Li, R. Zhao, C. Long and C. Cui, Nat. Commun., 2022, 13, 3694 CrossRef CAS PubMed.
- P. Yang, Z.-J. Zhao, X. Chang, R. Mu, S. Zha, G. Zhang and J. Gong, Angew. Chem., Int. Ed., 2018, 57, 7724–7728 CrossRef CAS PubMed.
- W. Deng, L. Zhang, L. Li, S. Chen, C. Hu, Z.-J. Zhao, T. Wang and J. Gong, J. Am. Chem. Soc., 2019, 141, 2911–2915 CrossRef CAS PubMed.
- P. N. Amaniampong, Q. T. Trinh, T. Bahry, J. Zhang and F. Jérôme, Green Chem., 2022, 24, 4800–4811 RSC.
- Y.-Y. Song and G.-C. Wang, J. Phys. Chem. C, 2016, 120, 27430–27442 CrossRef CAS.
- C. Cui, J. Han, X. Zhu, X. Liu, H. Wang, D. Mei and Q. Ge, J. Catal., 2016, 343, 257–265 CrossRef CAS.
- T. Sugino, A. Kido, N. Azuma, A. Ueno and Y. Udagawa, J. Catal., 2000, 190, 118–127 CrossRef CAS.
- E. Jerndal, T. Mattisson and A. Lyngfelt, Chem. Eng. Res. Des., 2006, 84, 795–806 CrossRef CAS.
- K. B. Ansari, S. Z. Hassan, S. A. Farooqui, R. Hasib, P. Khan, A. R. S. Rahman, M. S. Khan and Q. T. Trinh, in Green Diesel: An Alternative to Biodiesel and Petrodiesel, ed. M. Aslam, S. S. Maktedar and A. K. Sarma, Springer Nature Singapore, Singapore, 2022, pp. 351–375 Search PubMed.
- P. N. Amaniampong, Q. T. Trinh, K. Li, S. H. Mushrif, Y. Hao and Y. Yang, Catal. Today, 2018, 306, 172–182 CrossRef CAS.
- A. R. Derk, B. Li, S. Sharma, G. M. Moore, E. W. McFarland and H. Metiu, Catal. Lett., 2013, 143, 406–410 CrossRef CAS.
- B. Li and H. Metiu, J. Phys. Chem. C, 2011, 115, 18239–18246 CrossRef CAS.
- M. H. Groothaert, P. J. Smeets, B. F. Sels, P. A. Jacobs and R. A. Schoonheydt, J. Am. Chem. Soc., 2005, 127, 1394–1395 CrossRef CAS PubMed.
- A. I. Olivos-Suarez, À. Szécsényi, E. J. M. Hensen, J. Ruiz-Martinez, E. A. Pidko and J. Gascon, ACS Catal., 2016, 6, 2965–2981 CrossRef CAS.
- Z.-J. Zhao, A. Kulkarni, L. Vilella, J. K. Nørskov and F. Studt, ACS Catal., 2016, 6, 3760–3766 CrossRef CAS.
- E. M. Alayon, M. Nachtegaal, M. Ranocchiari and J. A. van Bokhoven, Chem. Commun., 2012, 48, 404–406 RSC.
- S. Grundner, M. A. Markovits, G. Li, M. Tromp, E. A. Pidko, E. J. Hensen, A. Jentys, M. Sanchez-Sanchez and J. A. Lercher, Nat. Commun., 2015, 6, 7546 CrossRef PubMed.
- B. Mélanie, G. Anne and D. Jullien, Angew. Chem., Int. Ed., 2012, 51, 10712–10723 CrossRef PubMed.
- H. V. Le, S. Parishan, A. Sagaltchik, H. Ahi, A. Trunschke, R. Schomäcker and A. Thomas, Chem. – Eur. J., 2018, 24, 12592–12599 CrossRef CAS PubMed.
- G. Li, P. Vassilev, M. Sanchez-Sanchez, J. A. Lercher, E. J. M. Hensen and E. A. Pidko, J. Catal., 2016, 338, 305–312 CrossRef CAS.
- Y. Li, S. Chen, Q. Zhang and Y. Wang, Chem. Lett., 2006, 35, 572–573 CrossRef CAS.
- Y. Li, D. An, Q. Zhang and Y. Wang, J. Phys. Chem. C, 2008, 112, 13700–13708 CrossRef CAS.
- E. M. Alayon, M. Nachtegaal, M. Ranocchiari and J. A. van Bokhoven, Chimia, 2012, 66, 668–674 CrossRef CAS PubMed.
- J. P. Perdew, K. Burke and M. Ernzerhof, Phys. Rev. Lett., 1996, 77, 3865–3868 CrossRef CAS PubMed.
- G. Kresse and J. Furthmuller, Phys. Rev. B: Condens. Matter Mater. Phys., 1996, 54, 11169–11186 CrossRef CAS PubMed.
- W. Kohn and L. J. Sham, Phys. Rev. A, 1965, 140, A1133–A1138 CrossRef.
- P. E. Blöchl, Phys. Rev. B: Condens. Matter Mater. Phys., 1994, 50, 17953–17979 CrossRef PubMed.
- G. Kresse and D. Joubert, Phys. Rev. B: Condens. Matter Mater. Phys., 1999, 59, 1758–1775 CrossRef CAS.
- M. Nolan and S. D. Elliott, Phys. Chem. Chem. Phys., 2006, 8, 5350 RSC.
- A. K. Mishra, A. Roldan and N. H. de Leeuw, J. Phys. Chem. C, 2016, 120, 2198–2214 CrossRef CAS.
- K. K. Irikura, in Computational Thermochemistry, American Chemical Society, 1998, ch. 22, vol. 677, pp. 402–418 Search PubMed.
- M. W. Chase, NIST-JANAF Thermodynamical Tables, Monograph 9, J. Phys. Chem. Ref. Data, 1998, 1–1951 Search PubMed.
- C. Sarkar, S. C. Shit, D. Q. Dao, J. Lee, N. H. Tran, R. Singuru, K. An, D. N. Nguyen, Q. V. Le, P. N. Amaniampong, A. Drif, F. Jerome, P. T. Huyen, T. T. N. Phan, D.-V. N. Vo, N. Thanh Binh, Q. T. Trinh, M. P. Sherburne and J. Mondal, Green Chem., 2020, 22, 2049–2068 RSC.
Footnote |
| † KB and QTT equally contributed to this study. |
| This journal is © The Royal Society of Chemistry 2023 |

