c-Axis-oriented sheet-like Cu/AEI zeolite contributes to continuous direct oxidation of methane to methanol†
Peipei
Xiao
a,
Yong
Wang
a,
Kengo
Nakamura
a,
Yao
Lu
a,
Junko N.
Kondo
 a,
Hermann
Gies
 ab and
Toshiyuki
Yokoi
 *a
*a
aInstitute of Innovative Research, Tokyo Institute of Technology, 4259 Nagatsuta, Midori-ku, Yokohama 226-8503, Japan. E-mail: yokoi@cat.res.titech.ac.jp
bInstitute of Geology, Mineralogy und Geophysics, Ruhr-University Bochum, Bochum 44780, Germany
First published on 25th July 2023
Abstract
In the continuous direct oxidation of methane to methanol (cDMTM), suppression of tandem reactions of the produced methanol to olefins is one of the key problems that must be solved to improve the methanol formation rate, selectivity, and catalytic stability. Herein, a strategy to reduce the thickness along the c-axis of AEI-type crystals was adopted to fulfill a short diffusion path along the straight channel. A c-axis-oriented sheet-like Cu-exchanged AEI zeolite (Cu/AEI) was prepared by adding C16-cationic surfactant into the synthesis gel. The effect of the thickness of the straight channels in the c-axis on the catalytic properties was investigated. Comparative results demonstrated that the sheet-like Cu/AEI zeolite exhibited a higher methanol formation rate and reaction performance with greater stability compared to the typical cubic-shaped zeolite. This advantage was ascribed to the decreased straight channel length that significantly facilitates the diffusion of reactants and products, decreases the accessibility of acid sites, and thus suppresses the secondary reaction of methanol to olefins on the Brønsted acid sites. Furthermore, the influence of the acid content in the framework of the cubic crystal AEI zeolite was investigated by means of post-calcination at high temperature. Thus, lower methanol formation rates and decreased stability were obtained with post-calcined Cu/AEI zeolites as compared to sheet-like Cu/AEI zeolite. The acidic property of the sheet-like Cu/AEI zeolite was optimized by post-treatments involving dealumination followed by desilication. Thus, treated sheet-like Cu/AEI zeolite achieved a methanol formation rate of 34 μmol g−1 min−1 (2022 μmol g−1 h−1) (i.e., space time yield (STY)) with 77% selectivity, which was higher than that for the cubic zeolite (28 μmol g−1 min−1, 49%) and the original sheet-like Cu/AEI zeolite (33 μmol g−1 min−1, 45%). This improvement was caused by the modified acidic properties and the introduction of secondary pores.
1. Introduction
There has been a great deal of academic and industrial research on the continuous direct oxidation of methane to methanol (cDMTM) in recent decades.1–3 Although diverse catalysts have been dedicated to this process, the Cu-exchanged zeolites have been considered the promising ones.1,2,4 Binuclear Cu centers have been widely recognized as active sites, being inspired by natural biocatalytic enzyme systems.1,2,4 It is well known that the topology structure, Si/Al ratio, and Al distribution have a great influence on the activity of methane oxidation.5 However, the influence of the morphology of zeolites on the catalytic performance in cDMTM has not yet fully been investigated.van Bokhoven and co-workers merely reported the impact of omega zeolite (MAZ) morphology on the methanol yield in the stepwise conversion of methane reaction.6 A greater methanol yield was achieved with the larger crystal Cu/MAZ zeolite despite the similarity of the other physicochemical properties, which was contrary to normal. Apart from this, the effect of zeolite morphology on the reaction performance of continuous methane oxidation has seldom been reported. It has been widely researched in other reactions such as methane to olefins (MTO),7–12 alkylation of benzene,13 cracking,14 syngas to olefins,15,16 Beckmann rearrangement of cyclohexanone oxime,17 and epoxidation of 1-hexene.18 In addition, research has been performed to determine the influence of morphology on tandem reactions. Specifically, in the reactions of CO or CO2 hydrogenation to aromatics over the metal oxides/ZSM-5 bifunctional catalyst via a tandem reaction coupling approach, the aromatic distribution was controlled by altering the crystal size of ZSM-5 along the b-axis.16,19–21
It is well accepted that the crystal morphology of zeolite plays an indispensable role in determining the catalytic activity. By controlling the length of channels, it is possible to affect the diffusion paths. The path length through the zeolite crystal is directly linked to diffusional problems, and can cause an increase in secondary reactions as well as subsequent carbon deposition inside the channels and cages that ultimately is responsible for catalyst deactivation, i.e., catalyst lifetime.22 Therefore, great efforts have been expended toward the fabrication of zeolite crystals with desirable morphologies, and breakthrough progress has been achieved.
The most common example is the strategy of decreasing the diffusion path along the straight channel (b-axis) for MFI-type zeolites. It was first reported by Ryoo and co-workers, who prepared ZSM-5 zeolites with multilamellar stacking 20–40 nm in thickness and a unilamellar structure corresponding to a single-unit-cell thickness along the b-axis using a self-made diquaternary ammonium-type surfactant.23–25 This resulted in a high surface area, and also effectively eliminated the diffusion problem of bulky molecules, thereby leading to a much higher catalytic activity as compared to conventional ZSM-5 in the cracking of branched polyethylene and the aldol condensation of benzaldehyde and 2-hydroxy acetophenone.23,24,26 This method has been used to successfully synthesize MFI,27 beta,27 MRE,28 MTW,27 MOR,9 and many other zeolites.
These zeolites exhibited catalytic potential in the Fischer–Tropsch reaction,29 Pechmann condensation reaction for bulky molecules,30 and glycerol etherification with tert-butyl alcohol.9,31 However, these zeolitic materials are synthesized using highly elaborate and complex structure-directing agents (SDAs),24,32,33 or by complicated swelling, pillaring, and exfoliation procedures.34 From a practical point of view and taking into account the environment, inexpensive additives such as NH4F (ref. 35 and 36) and urea15,17 have widely been employed to modify the crystal morphology of different types of zeolites.22,37
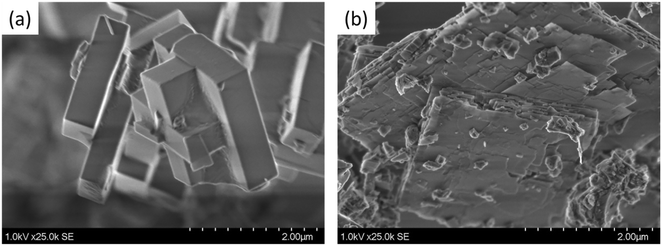
Recently, we adopted the commercially available typical surfactant cetyltrimethylammonium bromide (CTAB) as a crystal growth inhibitor (CGI) to synthesize an AEI zeolite with sheet-like crystals in the c-axis orientation.38 The acidic AEI zeolites were applied in the propene to butene reaction, and the sheet-like AEI zeolite exhibited a higher selectivity for iso-butene and a longer catalytic lifetime as compared to the cubic sample.
In this study, c-axis-oriented sheet-like and typical cubic-shaped AEI zeolites were hydrothermally prepared in the presence and absence of CTAB, respectively. The obtained AEI zeolites were treated in Cu(NO3)2 solution to attain Cu-exchanged AEI zeolite (Cu/AEI) containing Brønsted acid sites (BAS) and Cu sites. The bifunctional Cu/AEI zeolites with different crystal morphologies were used as catalysts for cDMTM to clarify the impact of the crystal morphologies on the catalytic properties. In addition, to alter the acidic properties and/or introduce additional mesopores, post-modification involving dealumination followed by desilication was applied to the sheet-like AEI zeolite, improving the catalytic properties. We found that the environment of Cu and BAS, especially the length of the path through which reactants, methanol intermediates, and olefins passed, greatly influenced the methanol yield, selectivity, and catalytic stability.
2. Experiments
AEI-type aluminosilicate zeolites with cubic and sheet-like morphology were hydrothermally synthesized according to our previous report38 without or with the presence of cetyltrimethylammonium bromide (CTAB) as a CGI. Specifically, a gel with the molar composition of 1.0 SiO2![[thin space (1/6-em)]](https://www.rsc.org/images/entities/char_2009.gif) :
:![[thin space (1/6-em)]](https://www.rsc.org/images/entities/char_2009.gif) 0.033 Al2O3
0.033 Al2O3![[thin space (1/6-em)]](https://www.rsc.org/images/entities/char_2009.gif) :
:![[thin space (1/6-em)]](https://www.rsc.org/images/entities/char_2009.gif) 0.18 OSDA
0.18 OSDA![[thin space (1/6-em)]](https://www.rsc.org/images/entities/char_2009.gif) :
:![[thin space (1/6-em)]](https://www.rsc.org/images/entities/char_2009.gif) 0.185 NaOH
0.185 NaOH![[thin space (1/6-em)]](https://www.rsc.org/images/entities/char_2009.gif) :
:![[thin space (1/6-em)]](https://www.rsc.org/images/entities/char_2009.gif) 0 or 0.01 CTAB
0 or 0.01 CTAB![[thin space (1/6-em)]](https://www.rsc.org/images/entities/char_2009.gif) :
:![[thin space (1/6-em)]](https://www.rsc.org/images/entities/char_2009.gif) 20 H2O was transferred to an autoclave and crystallized at 170 °C for 3 days with a tumbling rate of 40 rpm. Herein, the FAU-type zeolite (Zeolyst, CBV720) was used as the source of SiO2 and Al2O3. After filtration, washing, and drying at 100 °C overnight, the as-prepared samples were obtained and named as-AEI-C and as-AEI-S, respectively, where C and S denote cubic and sheet-like AEI crystals without or with the presence of CTAB, respectively.
20 H2O was transferred to an autoclave and crystallized at 170 °C for 3 days with a tumbling rate of 40 rpm. Herein, the FAU-type zeolite (Zeolyst, CBV720) was used as the source of SiO2 and Al2O3. After filtration, washing, and drying at 100 °C overnight, the as-prepared samples were obtained and named as-AEI-C and as-AEI-S, respectively, where C and S denote cubic and sheet-like AEI crystals without or with the presence of CTAB, respectively.
The organic structure-directing agent (OSDA) and CTAB were removed by calcination at 550 °C for 10 h. Then, the calcined sample was ion-exchanged twice with 2.5 mol L−1 NH4NO3 aqueous solution at 80 °C for 3 h. NH4-form AEI was calcined at 550 °C for 5 h to obtain H-AEI zeolite. The exchanged Cu/AEI zeolite catalysts with various copper loadings were prepared by varying the concentration of Cu(NO3)2 solution. Typically, 1 g NH4-form AEI was ion-exchanged with 100 mL of 1, 5, or 50 mmol L−1 Cu(NO3)2 aqueous solution at 80 °C for 24 h. The solid product was washed, dried, and calcined at 550 °C for 5 h in air. The obtained samples were denoted as xCu/AEI-C and xCu/AEI-S, where x corresponds to the concentration of Cu(NO3)2 solution.
Because the Si/Al ratio of AEI-C (approximately 10) was lower than that of AEI-S (approximately 12),38 to regulate a similarly strong amount of acid, the as-AEI-C zeolite was calcined in air at higher temperatures (700 or 800 °C) to reduce the amount of framework Al. Herein, the calcined samples were named AEI-C-700 and AEI-C-800, respectively. The procedures followed were similar to those mentioned above. Finally, the obtained samples were denoted as 5Cu/AEI-C-700 and 5Cu/AEI-C-800, respectively.
To alter the acidic properties and/or introduce additional mesopores, the post-modifications including dealumination using ammonium hexafluorosilicate (AHFS) followed by desilication using NaOH solution were also applied to the AEI-S zeolite. Specifically, the calcined AEI-S zeolite was dealuminated in 0.2 mol L−1 AHFS aqueous solution at 80 °C for 2 h, and then, the suspension was filtered, washed, and dried overnight. The obtained sample was named AEI-S-A. Afterward, the AEI-S-A sample was desilicated in 0.1 mol L−1 NaOH aqueous solution at room temperature for 1 h, and the suspension was subsequently filtered, washed, and dried overnight. The obtained sample was named AEI-S-A-N. The AEI-S-A-N sample then underwent NH4 exchange, followed by Cu exchange with 5 mmol L−1 Cu(NO3)2 aqueous solution at 80 °C for 24 h. The obtained samples were named 5Cu/AEI-S-A-N after calcination at 550 °C for 5 h. The details regarding the characterization and catalytic activity test for cDMTM are provided in the ESI.†
3. Results and discussion
3.1. Catalyst characterization
| Sample | Si/Ala | S BET (m2 g−1) | V Total (cm3 g−1) | S EXT (m2 g−1) | V micro (cm3 g−1) |
|---|---|---|---|---|---|
| a By ICP-AES. b Calculated using the Brunauer–Emmett–Teller (BET) equation on the N2 adsorption isotherms. c Calculated by the t-plot method based on the adsorption isotherms. | |||||
| H-AEI-C | 10.3 | 559 | 0.27 | 10 | 0.21 |
| H-AEI-C-700 | 10.3 | 644 | 0.28 | 11 | 0.22 |
| H-AEI-C-800 | 10.3 | 645 | 0.30 | 10 | 0.24 |
| H-AEI-S | 12.7 | 430 | 0.27 | 28 | 0.15 |
| H-AEI-S-A-N | 10.9 | 488 | 0.45 | 70 | 0.15 |
| Sample | Chemical compositiona | ||
|---|---|---|---|
| Si/Al | Cu/Al | Cu (wt%) | |
| a By ICP-AES. | |||
| 1Cu/AEI-C | 10.8 | 0.01 | 0.07 |
| 5Cu/AEI-C | 10.8 | 0.05 | 0.53 |
| 50Cu/AEI-C | 10.9 | 0.16 | 1.55 |
| 1Cu/AEI-S | 12.1 | 0.02 | 0.13 |
| 5Cu/AEI-S | 12.3 | 0.09 | 0.70 |
| 50Cu/AEI-S | 12.0 | 0.19 | 1.45 |
| 5Cu/AEI-C-700 | 10.0 | 0.04 | 0.33 |
| 5Cu/AEI-C-800 | 10.8 | 0.04 | 0.24 |
| 5Cu/AEI-S-A-N | 10.9 | 0.07 | 0.62 |
The Cu speciation was also identified by NO adsorption Fourier transform infrared (FTIR) spectroscopy at −120 °C. As demonstrated in Fig. 2, the bands at 1810 and 1730 cm−1 were associated with NO bound to Cu+ sites, and the bands at 1900, 1927, and 1950 cm−1 were assigned to different Cu2+ species.40 According to Palagin et al. and our recent work,5,40 the bands at 1887 and 1900 cm−1 are related to the adsorption of a single NO molecule on the Cu(OH)+ species, while the bands at 1927 and 1950 cm−1 correspond to the adsorption of a single NO molecule on the dimeric copper species. The peak intensity is related to the amount of the corresponding copper species after normalization. Because the intensity of the band at 1950 cm−1 for 5Cu/AEI-S was stronger than that for 5Cu/AEI-C, and the intensity of the band at 1927 cm−1 for 5Cu/AEI-C was stronger than that for 5Cu/AEI-S, the intensity of the bands belonging to dicopper species for 5Cu/AEI-C and 5Cu/AEI-S were similar.
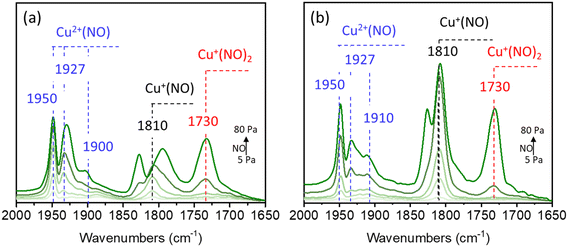 | ||
| Fig. 2 NO (5–80 Pa) adsorption FTIR spectra over (a) 5Cu/AEI-C and (b) 5Cu/AEI-S zeolite catalysts collected at −120 °C after pretreatment at 500 °C in a vacuum for 1 h. | ||
In addition, CO adsorption FTIR spectroscopy at −120 °C was adopted to simultaneously clarify the acidic and Cu sites.40–42 As revealed in Fig. 3, at low CO coverages, exclusive formation of Cu+(CO)2 at 2151 cm−1 and Cu2+CO at 2183 cm−1 was observed.40,41 Increasing the CO pressure led to the appearance of a new but weak band assigned to Cu+(CO)3 at 2196 cm−1.40,41 As the CO pressure continued to increase, the band at 2183 cm−1 blue-shifted to 2172 cm−1, which was assigned to the υC–O vibration of adsorbed CO interacting with zeolitic OH groups via weak hydrogen bonds.42
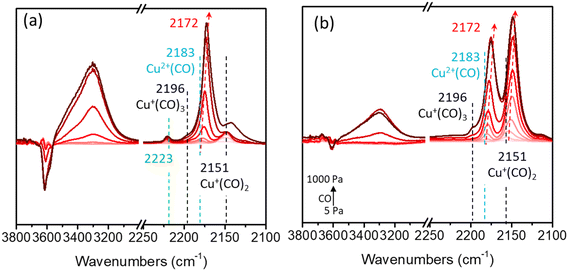 | ||
| Fig. 3 CO (5–1000 Pa) adsorption FTIR spectra over (a) 5Cu/AEI-C and (b) 5Cu/AEI-S zeolite catalysts collected at −120 °C after pretreatment at 500 °C in a vacuum for 1 h. | ||
Concomitant with the development of these bands was the appearance of a broad feature centered at 3300 and 3430 cm−1, and negative features in the vibrational region of zeolitic OH groups centered at 3600 and 3640 cm−1. The intensity of the band at 2151 cm−1 for 5Cu/AEI-S was obviously higher than that for 5Cu/AEI-C, while the intensity of the band at 2183 cm−1 for 5Cu/AEI-C was slightly higher than that for 5Cu/AEI-S, signifying different Cu speciation and locations. Additionally, 5Cu/AEI-C presented a weak band at 2230 cm−1, which was assigned to Lewis acid sites (LAS). Moreover, the BAS amount of xCu/AEI-C at 2172 cm−1 was obviously higher than that of xCu/AEI-S under the corresponding Cu content due to the greater amount of Al in the framework of the AEI-C zeolite.
| Sample | NH3-TPD (mmol g−1)a | |||
|---|---|---|---|---|
| Weak | Medium | Strong | Total | |
| a Determined by NH3-TPD; the fitting peaks of the weak, medium, and strong acid amounts were calculated at approximately 150, 300, and 400–450 °C, respectively. | ||||
| 1Cu/AEI-C | 0.45 | 0.25 | 0.51 | 1.21 |
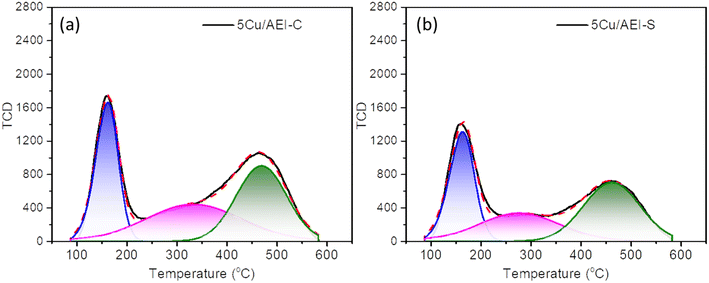
| 5Cu/AEI-C | 0.32 | 0.39 | 0.41 | 1.12 |
| 50Cu/AEI-C | 0.37 | 0.61 | 0.41 | 1.39 |
| 1Cu/AEI-S | 0.33 | 0.24 | 0.36 | 0.93 |
| 5Cu/AEI-S | 0.25 | 0.36 | 0.29 | 0.90 |
| 50Cu/AEI-S | 0.29 | 0.43 | 0.40 | 1.12 |
| 5Cu/AEI-C-700 | 0.35 | 0.43 | 0.26 | 1.04 |
| 5Cu/AEI-C-800 | 0.18 | 0.27 | 0.29 | 0.74 |
| 5Cu/AEI-S-A-N | 0.20 | 0.33 | 0.28 | 0.81 |
Obviously, for the two types of AEI zeolites, when the Cu content increased, the strong acid amount decreased due to the replacement of protons from (Si–OH–Al) by Cu2+, and the medium acid amount increased because of the cumulative Cu content. These results were in accordance with our previous work and the literature.5,44 The total acid amount of the xCu/AEI-C zeolite catalysts was higher than that of the xCu/AEI-S samples under similar Cu content due to the higher Al content of the parent AEI-C zeolite.
3.2. Catalytic performance
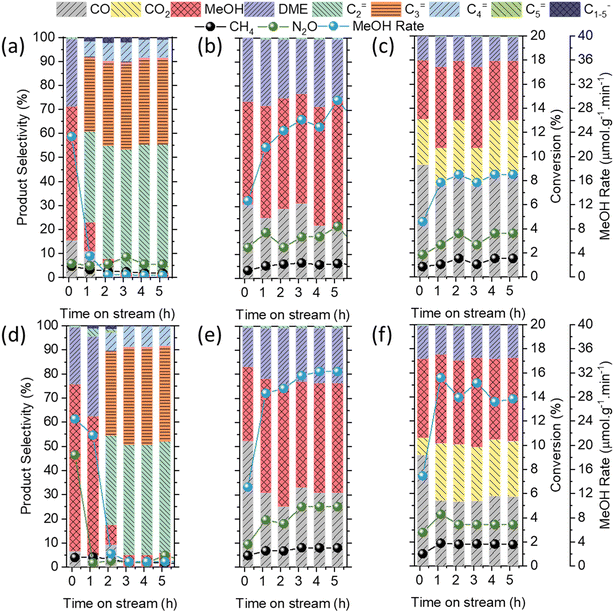
For the low Cu content Cu/AEI zeolites (1Cu/AEI), methanol was the dominant product at the initial stage, whose selectivity for 1Cu/AEI-C and 1Cu/AEI-S reached 55 and 70%, respectively (Fig. 5(a and d)). Interestingly, the methanol selectivity of 1Cu/AEI-C decreased to 10% at 1.17 h, while that of 1Cu/AEI-S remained at 57% at 1.17 h. In addition, at 5.17 h, 1Cu/AEI-C and 1Cu/AEI-S obtained olefin selectivity greater than 95%, with the C2= selectivity of 1Cu/AEI-C (approximately 53.3%) being slightly higher than that of 1Cu/AEI-S (approximately 45.8%).
The earlier formation time of 1Cu/AEI-C was due to the higher acid amount of the AEI-C zeolite, and also particle size because the sheet-like morphology of AEI-S was beneficial for the transformation of methanol between the particles. For the AEI-C zeolite, due to the large cubic particles, the intermediate methanol was merely able to transfer within the cubic zeolite, and thus, olefins formed. When 5Cu/AEI zeolites were used, the selectivity of hydrocarbon decreased, but the selectivity of CO and DME increased in comparison with 1Cu/AEI because of the condensed acid amount and increased Cu content (Fig. 5(b and e), Table S1†).
The reaction results at time-on-stream (TOS) of 5.17 h for 5Cu/AEI zeolites were compared, and a 28.2 μmol g−1 min−1 MeOH formation rate with 49.1% selectivity and 32.5 μmol g−1 min−1 MeOH formation rate with 45.4% selectivity were obtained by 5Cu/AEI-C and 5Cu/AEI-S, respectively (Fig. 5(b and e)). After a further increase in the Cu content, a 17.0 μmol g−1 min−1 MeOH formation rate with 24.7% selectivity and 27.2 μmol g−1 min−1 MeOH formation rate with 33.4% selectivity were obtained at 5.17 h by 50Cu/AEI-C and 50Cu/AEI-S, respectively (Fig. 5(c and f)). The greatly enhanced CO2 selectivity was attributable to the increased Cu content, resulting in methanol being overoxidized, which has been previously reported.45
![[thin space (1/6-em)]](https://www.rsc.org/images/entities/char_2009.gif) 000 to 30
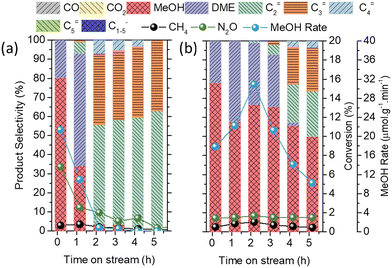
000 to 30![[thin space (1/6-em)]](https://www.rsc.org/images/entities/char_2009.gif) 000 ml g−1 h−1 by increasing the flow rate of Ar from 3 to 28 ml min−1. The 5Cu/AEI-C and 5Cu/AEI-S zeolites were used because they were two samples with suitable amounts of Cu and acid. As displayed in Fig. 6, olefins were observed on 5Cu/AEI-C and 5Cu/AEI-S within 6 h. However, the massive formation of olefins on 5Cu/AEI-C was at 2.17 h, and the selectivity of olefins reached approximately 96%. The selectivity of olefins at 5.17 h reached 100% for 5Cu/AEI-C. In the case of 5Cu/AEI-S, the maximum olefin selectivity was approximately 50% at 5.17 h.
000 ml g−1 h−1 by increasing the flow rate of Ar from 3 to 28 ml min−1. The 5Cu/AEI-C and 5Cu/AEI-S zeolites were used because they were two samples with suitable amounts of Cu and acid. As displayed in Fig. 6, olefins were observed on 5Cu/AEI-C and 5Cu/AEI-S within 6 h. However, the massive formation of olefins on 5Cu/AEI-C was at 2.17 h, and the selectivity of olefins reached approximately 96%. The selectivity of olefins at 5.17 h reached 100% for 5Cu/AEI-C. In the case of 5Cu/AEI-S, the maximum olefin selectivity was approximately 50% at 5.17 h.
In comparison with Fig. 5(b and e), the production of olefins at a high SV indicated that accelerated mass transfer between the bifunctional sites was conducive to the occurrence of a tandem reaction, but unfavorable for the yield of methanol and the catalytic stability. We considered that accelerated SV was beneficial for the mass transfer between Cu and acid sites, but sheet-like AEI zeolite was able to reduce such transfer in the zeolite crystal. Hence, we claim that sheet-like AEI zeolite was conducive to the stable production of methanol.
3.3. Impact of morphology on the cDMTM reaction
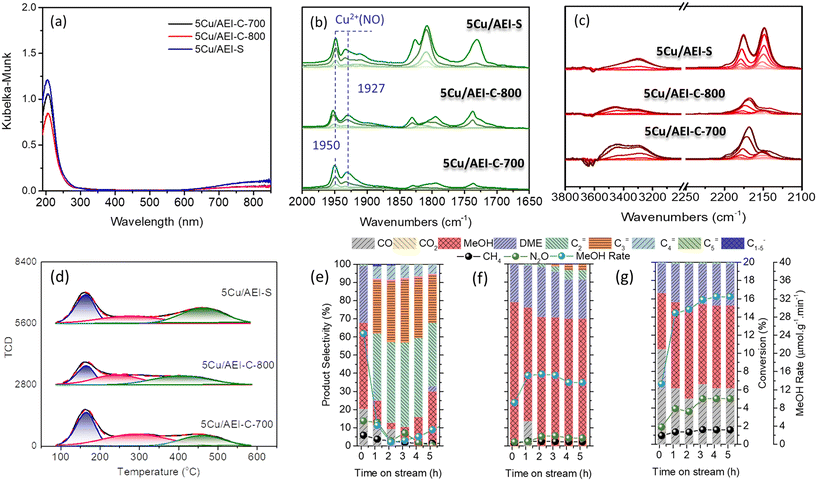
Cu/AEI-S zeolites achieved a higher methanol formation rate than Cu/AEI-C under similar Cu content (Fig. 5 and 6). This difference would be caused by two factors – the acidic properties and crystal morphology (Tables 2 and 3, and Fig. 1). To exclude the influence of acidic properties, the acid amount of AEI-C was decreased so that it was similar to that of AEI-S by post-calcination at higher temperatures. In addition, post-treatments involving dealumination and desilication were used to adjust the acid amount of AEI-S so that it was similar to that of AEI-C.Regarding Cu speciation, no marked difference in the UV-vis spectra was observed before or after post-calcination (Fig. 7a). However, the NO adsorption FTIR spectra revealed that the intensities of the bands were attributed to dicopper species at 1950 and 1927 cm−1, and the bands attributed to Cu(OH)+ at 1900 cm−1 decreased upon post-calcination compared to 5Cu/AEI-S, suggesting that Cu speciation was influenced by post-calcination (Fig. 7b). Moreover, the weakened intensity of bands belonging to Cu(CO) at 2183 cm−1 and Cu(CO)2 at 2151 cm−1 in the CO adsorption FTIR spectra in comparison with 5Cu/AEI-S suggested that there was a decrease in Cu species in the ionic sites (Fig. 7c).
When 5Cu/AEI-C-700 and 5Cu/AEI-C-800 were used in the direct oxidation of methane to methanol and the stability was compared with 5Cu/AEI-S, it was interesting to find that the reaction performance of 5Cu/AEI-C-700 was similar to that of 1Cu/AEI-C. Although a 24.7 μmol g−1 min−1 initial methanol formation rate with 47.7% selectivity was obtained, methanol was transformed to olefins on the BAS. Normally, we considered the production of olefins because the tandem reaction of methane to olefins was related to the Brønsted acid amount and the distance between Cu and acid sites. Herein, the Brønsted or strong acid amount of 5Cu/AEI-C-700 was verified as being lower than that of 5Cu/AEI-S.
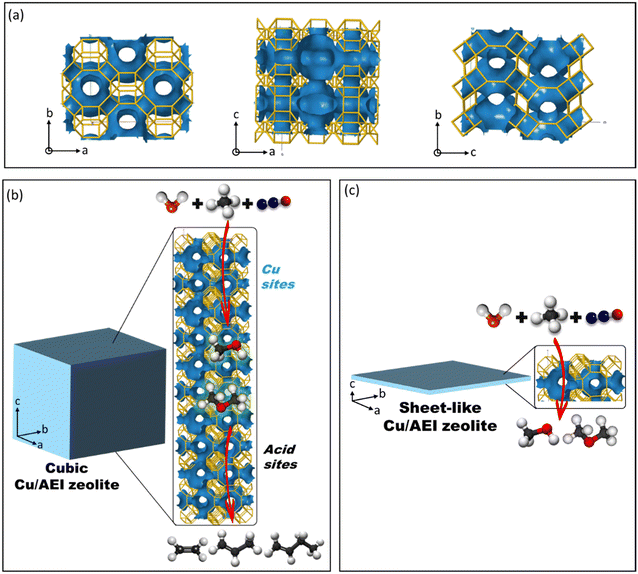
After we confirmed the reproducibility of 5Cu/AEI-C-700 in the cDMTM reaction (Fig. S12†), a possible conjecture was proposed, as seen in Scheme 1. The channel system of the AEI zeolite viewed from the c, b, a directions is exhibited in Scheme 1a. Obviously, the straight channel was observed from the c-axis. In the case of 5Cu/AEI-C-700, when methane was passed along the c-axis, methanol initially formed on the Cu sites. Thereafter, methanol continued to diffuse along the c-axis, and when the acid amount was efficient, methanol was converted to olefins on the acid sites. Finally, olefins diffused out of AEI-C zeolite and were detected by GC-FID (Scheme 1b). However, in view of the AEI-S zeolite, due to the shorter c-axis, the formed methanol from the oxidation of methane directly and quickly diffused out of the zeolite and was detected by GC-FID. Thus, no olefins were observed on the 5Cu/AEI-S and 50Cu/AEI-S zeolites, with later formation of olefins on 1Cu/AEI-S as compared to the 1Cu/AEI-C zeolite (Scheme 1c).
In the case of the 5Cu/AEI-C-800 zeolite, the maximum methanol formation rate was 15.8 μmol g−1 min−1 with 70.8% selectivity. Interestingly, approximately 8% olefin selectivity was observed at 4.17 h, even though the amount and strength of strong acid sites for 5Cu/AEI-C-800 were lower than those for 5Cu/AEI-S (Table 3). This result verified once more that the longer c-axis facilitated the tandem reaction of methanol to olefins, while a shorter c-axis contributed to methanol diffusion out of the AEI zeolite crystal and thereby suspended the continuing conversion of methanol to olefins on the acid sites.
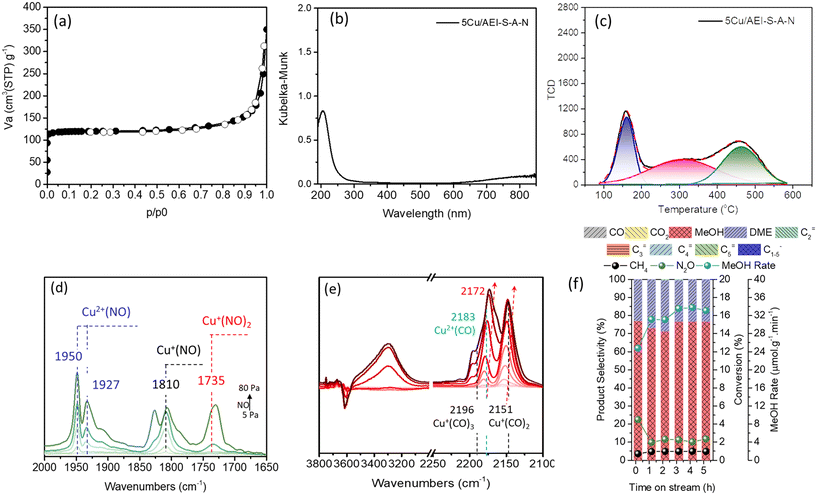
By deconvolution of the 27Al MAS NMR (Fig. S14a†), 97% Al in the framework of AEI-S-A-N was confirmed. Because the Si/Al of AEI-S-A-N measured by inductively coupled plasma-atomic emission spectroscopy (ICP-AES) was 10.9, the Al/Si of AEI-S-A-N in the framework was 0.089, which was similar to that of AEI-C (0.088). It should be noted that for the deconvoluted 29Si MAS NMR result (Fig. S14b†), the Q4(2Al) of AEI-S-A-N was 7%, which was higher than that of AEI-C (3%). In regards to the chemical composition, the 0.62 wt% Cu content of 5Cu/AEI-S-A-N was slightly higher than the 0.53 wt% of 5Cu/AEI-C. However, the amounts of weak and strong acid sites for 5Cu/AEI-S-A-N were lower than those of 5Cu/AEI-C (Table 3 and Fig. 8c), even though a similar Si/Al ratio of 5Cu/AEI-S-A-N and 5Cu/AEI-C was observed. A possible reason for this was that a portion of Al and Si in the framework of AEI-S was removed by AHFS and NaOH, respectively. Additionally, a portion of SiO2 was brought by AHFS. These two reasons jointly created a similar Si/Al ratio, but different acidity between 5Cu/AEI-S-A-N and 5Cu/AEI-C.
The Cu speciation of 5Cu/AEI-S-A-N analyzed by UV-vis, NO, and CO adsorption FTIR spectra was quite similar to that of 5Cu/AEI-S (Fig. 8(b, d and e)). Interestingly, when catalyst 5Cu/AEI-S-A-N was used in the methane oxidation reaction, a maximum 33.7 μmol g−1 min−1 with 76.7% selectivity was obtained (Fig. 8f). In comparison with 5Cu/AEI-C, we ascribed the substantially improved methanol formation rate and selectivity to the textural properties, including the decreased diffusion path along the straight channel in the c-axis and the enlarged aperture of the sheet-like crystals.
In comparison with 5Cu/AEI-S, we ascribed the noticeably upgraded methanol selectivity to the decreased Al content in the framework but the increased proportion of Q4(2Al), which was useful for the construction of active dicopper species, and the decrease in BAS. Furthermore, the enlarged aperture of the sheet-like crystals is another possible reason. Hence, the c-axis-oriented sheet-like AEI zeolite is a high-performing catalyst for the direct conversion of methane to methanol, and its reaction performance was able to further improve by the dealumination and desilication that led to the increase in the Al/Si ratio and the introduction of secondary large pores.
4. Conclusion
A c-axis-oriented sheet-like AEI zeolite and typical cubic-shaped zeolite were hydrothermally prepared in the presence and absence of CTAB, respectively, to investigate the effect of length of the straight channel along with the c-axis on the continuous direct oxidation of methane to methanol. The catalytic properties were strongly dependent on the distance along the straight channel, and the sheet-like Cu/AEI catalysts achieved a higher methanol formation rate irrespective of the Cu content. Considering the effects of the acid amount on the reaction performance, the framework Al content in the cubic AEI zeolite was reduced by the post-calcination.After adjusting the similar framework Al content of cubic and sheet-like AEI zeolites, a higher methanol formation rate was obtained with the Cu/AEI zeolite. In addition, dealumination and desilication post-treatments were performed on the sheet-like AEI zeolite, leading to the simultaneous formation of additional mesopores as well as a decrease in the amount of acid. These multiple advantages contributed to generating more methanol from methane oxidation on the active dicopper sites and promoting diffusivity in the crystals, and therefore, a high methanol formation rate and selectivity were obtained.
Based on these results, we concluded that the strategy of decreasing the straight channel to reduce mass transfer length suppressed the tandem reactions of methanol to olefins, increased the methanol formation rate, and thus significantly improved methanol selectivity and catalytic stability. Our findings will contribute to increasing the efficiency of the oxidation of methane to methanol and the diversification of applications for the c-axis-oriented sheet-like AEI zeolite.
Conflicts of interest
There are no conflicts to declare.Acknowledgements
This work was supported by a JSPS KAKENHI Grant-in-Aid for Scientific Research (B) (No. 21H01714) and JSPS KAKENHI Grant-in-Aid for Scientific Research (S) (No. 21H05011 and JP23H05454). We thank the Mitsubishi Chemical Corporation for providing 1,1,3,5-tetramethylpiperidinium hydroxide as the template.References
- K. T. Dinh, M. M. Sullivan, K. Narsimhan, P. Serna, R. J. Meyer, M. Dincă and Y. Román-Leshkov, J. Am. Chem. Soc., 2019, 141, 11641–11650 CrossRef CAS PubMed
.
- R. Xu, N. Liu, C. Dai, Y. Li, J. Zhang, B. Wu, G. Yu and B. Chen, Angew. Chem., Int. Ed., 2021, 60, 16634–16640 CrossRef CAS PubMed
.
- M. Ravi, M. Ranocchiari and J. A. van Bokhoven, Angew. Chem., Int. Ed., 2017, 56, 16464–16483 CrossRef CAS PubMed
.
- M. A. Newton, A. J. Knorpp, V. L. Sushkevich and J. A. van Bokhoven, Chem. Soc. Rev., 2020, 49, 1449–1486 RSC
.
- P. Xiao, Y. Wang, Y. Lu, T. D. Baerdemaeker, A.-N. Parvulescu, U. Müller, D. De Vos, X. Meng, F.-S. Xiao, W. Zhang, B. Marler, U. Kolb, H. Gies and T. Yokoi, Appl. Catal., B, 2023, 325, 122395 CrossRef CAS
.
- A. J. Knorpp, M. A. Newton, V. L. Sushkevich, P. P. Zimmermann, A. B. Pinar and J. A. van Bokhoven, Catal. Sci. Technol., 2019, 9, 2806–2811 RSC
.
- Y. Zhou, H. Shi, B. Wang, G. Chen, J. Yi and J. Li, Inorg. Chem. Front., 2021, 8, 2315–2322 RSC
.
- Z. Zhou, X. Wang, R. Yu, R. Jiang, Y. Gao, X. Chen and H. Hou, Adv. Powder Technol., 2023, 34, 103930 CrossRef CAS
.
- K. Lu, J. Huang, L. Ren, C. Li, Y. Guan, B. Hu, H. Xu, J. Jiang, Y. Ma and P. Wu, Angew. Chem., Int. Ed., 2020, 59, 6258–6262 CrossRef CAS PubMed
.
- W. Dai, C. Kouvatas, W. Tai, G. Wu, N. Guan, L. Li and V. Valtchev, J. Am. Chem. Soc., 2021, 143, 1993–2004 CrossRef CAS PubMed
.
- H. Chen, M. Wang, M. Yang, W. Shang, C. Yang, B. Liu, Q. Hao, J. Zhang and X. Ma, J. Mater. Sci., 2019, 54, 8202–8215 CrossRef CAS
.
- K. A. Łukaszuk, D. Rojo-Gama, S. Øien-Ødegaard, A. Lazzarini, G. Berlier, S. Bordiga, K. P. Lillerud, U. Olsbye, P. Beato, L. F. Lundegaard and S. Svelle, Catal. Sci. Technol., 2017, 7, 5435–5447 RSC
.
- J. Zhang, A. Zhou, K. Gawande, G. Li, S. Shang, C. Dai, W. Fan, Y. Han, C. Song, L. Ren, A. Zhang and X. Guo, ACS Catal., 2023, 13, 3794–3805 CrossRef CAS
.
- J. K. Reddy, K. Motokura, T. Koyama, A. Miyaji and T. Baba, J. Catal., 2012, 289, 53–61 CrossRef CAS
.
- J. Yang, K. Gong, D. Miao, F. Jiao, X. Pan, X. Meng, F. S. Xiao and X. Bao, J. Energy Chem., 2019, 35, 44–48 CrossRef CAS
.
- C. Liu, J. Su, S. Liu, H. Zhou, X. Yuan, Y. Ye, Y. Wang, W. Jiao, L. Zhang, Y. Lu, Y. Wang, H. He and Z. Xie, ACS Catal., 2020, 10, 15227–15237 CrossRef CAS
.
- Z. Shan, H. Wang, X. Meng, S. Liu, L. Wang, C. Wang, F. Li, J. P. Lewis and F. S. Xiao, Chem. Commun., 2011, 47, 1048–1050 RSC
.
- M. Zhang, S. Ren, Q. Guo and B. Shen, ChemistrySelect, 2023, 8, e202203687 CrossRef CAS
.
- C. Liu, J. Su, Y. Xiao, J. Zhou, S. Liu, H. Zhou, Y. Ye, Y. Lu, Y. Zhang, W. Jiao, L. Zhang, Y. Wang, C. Wang, X. Zheng and Z. Xie, Chem Catal., 2021, 1, 896–907 CrossRef CAS
.
- H. Tian, H. He, J. Jiao, F. Zha, X. Guo, X. Tang and Y. Chang, Fuel, 2022, 314, 123119 CrossRef CAS
.
- Z. Ma, X. Wang, X. Ma, M. Tan, G. Yang and Y. Tan, Microporous Mesoporous Mater., 2023, 349, 112420 CrossRef CAS
.
- S. Li, J. Li, M. Dong, S. Fan, T. Zhao, J. Wang and W. Fan, Chem. Soc. Rev., 2019, 48, 885–907 RSC
.
- K. Na, C. Jo, J. Kim, K. Cho, J. Jung, Y. Seo, R. J. Messinger, B. F. Chmelka and R. Ryoo, Science, 2011, 333(6040), 328–332 CrossRef CAS PubMed
.
- K. Na, M. Choi, W. Park, Y. Sakamoto, O. Terasaki and R. Ryoo, J. Am. Chem. Soc., 2010, 132, 4169–4177 CrossRef CAS PubMed
.
- M. Choi, K. Na, J. Kim, Y. Sakamoto, O. Terasaki and R. Ryoo, Nature, 2009, 461, 246–249 CrossRef CAS PubMed
.
- V. Shetti, J. Kim, R. Srivastava, M. Choi and R. Ryoo, J. Catal., 2008, 254, 296–303 CrossRef CAS
.
- K. Na, M. Choi and R. Ryoo, J. Mater. Chem., 2009, 19, 6713 RSC
.
- W. Kim, J.-C. Kim, J. Kim, Y. Seo and R. Ryoo, ACS Catal., 2013, 3, 192–195 CrossRef CAS
.
- J.-C. Kim, S. Lee, K. Cho, K. Na, C. Lee and R. Ryoo, ACS Catal., 2014, 4, 3919–3927 CrossRef CAS
.
- J.-C. Kim, R. Ryoo, M. V. Opanasenko, M. V. Shamzhy and J. Čejka, ACS Catal., 2015, 5, 2596–2604 CrossRef CAS
.
- N. Simone, W. A. Carvalho, D. Mandelli and R. Ryoo, J. Mol. Catal. A: Chem., 2016, 422, 115–121 CrossRef CAS
.
- K. Na, W. Park, Y. Seo and R. Ryoo, Chem. Mater., 2011, 23, 1273–1279 CrossRef CAS
.
- X. Shen, W. Mao, Y. Ma, D. Xu, P. Wu, O. Terasaki, L. Han and S. Che, Angew. Chem., Int. Ed., 2018, 57, 724–728 CrossRef CAS PubMed
.
- S. Choi, J. Coronas, E. Jordan, W. Oh, S. Nair, F. Onorato, D. F. Shantz and M. Tsapatsis, Angew. Chem., Int. Ed., 2008, 47, 552–555 CrossRef CAS PubMed
.
- V. Babić, S. Koneti, S. Moldovan, N. Nesterenko, J.-P. Gilson and V. Valtchev, Microporous Mesoporous Mater., 2021, 314, 110863 CrossRef
.
- K. S. Kencana, H. J. Choi, K. C. Kemp and S. B. Hong, Chem. Eng. J., 2023, 451, 138520 CrossRef CAS
.
- P. Zhu, J. Wang, F. Xia, W. Zhang, H. Liu and X. Zhang, Eur. J. Inorg. Chem., 2023, 26(9), e202200664 CrossRef CAS
.
- R. Osuga, T. Takeuchi, M. Sawada, Y. Kunitake, T. Matsumoto, J. N. Kondo, S. Yasuda, H. Gies, H. Onozuka, S. Tsutsuminai and T. Yokoi, Catal. Sci. Technol., 2021, 11, 5839 RSC
.
- P. Sazama, J. Moravkova, S. Sklenak, A. Vondrova, E. Tabor, G. Sadovska and R. Pilar, ACS Catal., 2020, 10, 3984–4002 CrossRef CAS
.
- D. Palagin, V. L. Sushkevich, A. J. Knorpp, M. Ranocchiari and J. A. van Bokhoven, J. Phys. Chem. C, 2021, 125, 12094–12106 CrossRef CAS
.
- K. Hadjiivanov and H. K
![[n with combining umlaut]](https://www.rsc.org/images/entities/char_006e_0308.gif) ozinger, J. Catal., 2000, 191, 480–485 CrossRef CAS
ozinger, J. Catal., 2000, 191, 480–485 CrossRef CAS .
- J. Szanyi, F. Gao, J. H. Kwak, M. Kollar, Y. Wang and C. H. Peden, Phys. Chem. Chem. Phys., 2016, 18, 10473–10485 RSC
.
- G. Wu, F. Hei, N. Guan and L. Li, Catal. Sci. Technol., 2013, 3, 1333–1342 RSC
.
- L. J. Lobree, I. Hwang, J. A. Reimer and A. T. Bell, J. Catal., 1999, 186, 242–253 CrossRef CAS
.
- M. A. Artsiusheuski, R. Verel, J. A. van Bokhoven and V. L. Sushkevich, ACS Catal., 2021, 11, 12543–12556 CrossRef CAS
.
- C. Li, L. Guo, P. Liu, K. Gong, W. Jin, L. Li, X. Zhu, X. Liu and B. Shen, Microporous Mesoporous Mater., 2018, 255, 242–252 CrossRef CAS
.
- Z. Qin, B. Shen, X. Gao, F. Lin, B. Wang and C. Xu, J. Catal., 2011, 278, 266–275 CrossRef CAS
.
- R. L. McLaren, C. J. Laycock, E. Brousseaub and G. R. Owen, New J. Chem., 2021, 45, 12071–12080 RSC
.
Footnote |
| † Electronic supplementary information (ESI) available: Experimental details, XRD, UV-vis, N2 adsorption and desorption, deconvolution of 29Si and 27Al MAS NMR, and deconvolution of NH3-TPD. See DOI: https://doi.org/10.1039/d3cy00584d |
| This journal is © The Royal Society of Chemistry 2023 |

