Indirect design of OCM catalysts through machine learning of catalyst surface oxygen species†
Fumiya
Nishino
a,
Hiroshi
Yoshida
 b,
Masato
Machida
 c,
Shun
Nishimura
 d,
Keisuke
Takahashi
 *e and
Junya
Ohyama
 *c
*c
aDepartment of Applied Chemistry and Biochemistry, Graduate School of Science and Technology, Kumamoto University, 2-39-1 Kurokami, Chuo-ku, Kumamoto, 860-8555, Japan
bCollege of Science and Engineering, Kanazawa University, Kakuma-cho, Kanazawa, 920-1192, Japan
cFaculty of Advanced Science and Technology, Kumamoto University, 2-39-1 Kurokami, Chuo-ku, Kumamoto, 860-8555, Japan. E-mail: ohyama@kumamoto-u.ac.jp
dGraduate School of Advanced Science and Technology, Japan Advanced Institute of Science and Technology (JAIST), 1-1 Asahidai, Nomi, 923-1292, Japan
eDepartment of Chemistry, Hokkaido University, N-15 W-8, Sapporo, 060-0815, Japan. E-mail: keisuke.takahashi@sci.hokudai.ac.jp
First published on 21st August 2023
Abstract
Catalysts for oxidative coupling of methane (OCM) were designed through machine learning of a property of surface oxygen species on the basis of the knowledge that catalytic performance for the OCM is affected by catalyst surface oxygen species. To select the property of the surface oxygen species used as a guide of catalyst design via machine learning, the relationships between the total yield of ethylene and ethane (C2 yield) and the O1s X-ray photoelectron spectral (XPS) features of the 51 catalysts prepared in our previous study were evaluated. Since a weak correlation was seen between the C2 yield and the O1s XPS peak energy of CO32− species on the catalyst surface, the CO32− peak energy was chosen as the guiding parameter of catalyst design in this work. Machine learning was then performed on the dataset consisting of the CO32− peak energy (objective variable) and the physical quantities of elements in the catalysts (descriptor) to find the important physical quantities determining the CO32− peak energy. According to the important physical quantities, catalyst compositions were predicted. Based on the predicted compositions, 28 catalysts were synthesized to verify that their CO32− peak energies were in the range where high catalytic performance can be expected. Furthermore, the catalysts are tested for the OCM reaction. As a result, Ba–In–Rb/La2O3 was found as a new highly active OCM catalyst having compatible activity to the conventional Mn–Na2WO4/SiO2 catalyst. Therefore, it was demonstrated that the indirect catalyst through machine learning of the catalyst surface property is effective for development of catalysts.
Introduction
Oxidative coupling of methane is a direct conversion reaction of CH4 to ethylene and ethane (C2 compounds), which can offer a more energetically efficient and economical process than the conventional conversion of CH4 to olefin via CO and CH3OH.1 However, the OCM has a problem that the C2 yield hardly exceeds 30%.1,2 To overcome this problem, hundreds of catalysts have been developed.1–4 Among the catalysts, Mn–Na2WO4/SiO2 shows relatively high performance for the OCM.5–7 As seen in the case with Mn–Na2WO4/SiO2, combination of elements is effective in developing the OCM catalysts. Here, data science techniques have been applied to search for good combinations of catalyst elements from a vast combinatorial space.3,4,8–15 In fact, in our previous studies, catalysts have been designed through machine learning and data mining of the direct relationship between the C2 yield and the descriptors of elements (e.g., element number, atomic weight, atomic radius, melting point, evaporation heat, electronegativity, etc.).13 On the other hand, catalytic performance is strongly affected by the catalyst surface properties. In the case of the OCM catalysts, the properties of surface oxygen species are known to have an impact on the catalytic performance.16–19 Accordingly, the OCM catalysts can also be designed by machine learning of the relationship between the surface oxygen properties and the descriptors of catalyst elements. In addition, it is expected that some of the catalyst element combinations predicted from the surface oxygen properties are the same as the ones predicted by the direct catalyst design from the relation between the catalytic performance and the descriptors of elements, but the others will be different because the properties of surface oxygen species do not completely describe the catalytic performance. Therefore, new catalyst combinations can be explored with a guide of the rational descriptors.In this study, indirect design of OCM catalysts through machine learning of a property of catalyst surface oxygen species was performed. The property of catalyst surface oxygen species used as the guide for catalyst design was selected from the features of O1s X-ray photoelectron spectra (XPS). Based on the guide of the selected surface oxygen property, OCM catalysts were predicted using machine learning and were verified by XPS measurement and the OCM reaction tests.
Methods
Catalyst preparation
OCM catalysts predicted by machine learning, M1–M2–M3/A (M1, M2, M3 = In, K, Rb, Cs, Ba, Yb, Bi, Sm, Ce, Li, W, Hf, Eu, Cu, Zn, Nd, A = SiO2, La2O3, Yb2O3, CeO2), were prepared by a wet impregnation method. In(NO3)3·3H2O, KNO3, RbNO3, CsNO3, Ba(NO3)2, Yb(NO3)3·5H2O, Bi(NO3)3·5H2O, Sm(NO3)3·6H2O, Ce(NO3)3·6H2O, LiNO3, (NH4)6H2W12O40·5H2O, HfOCl2·8H2O, Eu(NO3)3·6H2O, Cu(NO3)2·6H2O, Zn(NO3)2·6H2O, Nd(NO3)3·6H2O were used as the metal precursors. The loading amount of each of M1, M2, and M3 was 1 wt%. After impregnation, the materials were dried at 110 °C overnight and calcined in air at 1000 °C for 3 h. The metals and supports used in the M1–M2–M3/A preparation are shown in Table 1. Mn–Na2WO4/SiO2 was prepared as a reference catalyst by impregnating SiO2 in an aqueous solution containing Mn(NO3)2 and Na2WO4. After the impregnation, the material was dried overnight at 110 °C and calcined at 1000 °C for 3 h (10 °C min−1) to obtain Mn–Na2WO4/SiO2 with 1.9 wt% Mn and 5.0 wt% Na2WO4.13| M1 | M2 | M3 | A |
|---|---|---|---|
| Ba | Ce | Cs | SiO2 |
| Ba | Hf | Cs | CeO2 or Yb2O3 |
| Ba | Hf | Sm | CeO2 or Yb2O3 |
| Bi | Hf | Sm | Yb2O3 |
| Eu | Hf | Sm | Yb2O3 |
| Eu | Hf | Nd | Yb2O3 |
| Hf | In | Sm | Yb2O3 |
| Bi | In | Sm | Yb2O3 |
| Hf | In | Nd | Yb2O3 |
| Ba | Hf | — | Yb2O3 |
| Cs | Hf | — | Yb2O3 |
| Sm | Hf | — | Yb2O3 |
| Ce | Hf | — | Yb2O3 |
| Cu | Hf | — | Yb2O3 |
| Zn | Hf | — | Yb2O3 |
| Zn | W | — | Yb2O3 |
| Ba | In | Rb | La2O3 |
| In | Rb | Yb | La2O3 |
| Bi | In | Rb | La2O3 |
| Ba | In | Yb | La2O3 |
| Ba | Rb | Yb | La2O3 |
| Bi | In | Yb | La2O3 |
| In | Rb | Sm | La2O3 |
| Ce | In | Rb | La2O3 |
| Cs | In | Rb | La2O3 |
| Bi | Rb | Yb | La2O3 |
Catalyst preparation
The OCM reaction was performed in a fixed-bed flow reactor. 50 mg of catalyst (10–20 mesh) was placed in a quartz glass tube reactor (inner diameter (ID) 4 mm) and fixed with quartz wool. Prior to the reaction, a catalyst bed was pretreated at 400 °C for 10 min under a O2 flow of 8.3 mL min−1. After purging with a N2 flow of 12 mL min−1, the reaction was started by flowing a reaction gas mixture of CH4/O2/N2 = 24/7.5/3.0 mL min−1. Reaction temperature was increased to 500 °C, 600 °C, 700 °C, 800 °C, and 900 °C. The reaction gas was analyzed 15–30 min after the temperature reached to the set value. The outlet gas after cold traps at ca. 10 °C was analyzed using a gas chromatograph with a thermal conductivity detector (490 Micro GC Agilent Technologies). The carbon missing was determined by CH4 conversion – (sum of C2H4, C2H6, CO, and CO2 yield) (%).XPS measurement
XPS measurements were performed using K-Alpha (Thermo Fisher Scientific) with monochromatic X-ray irradiation AlKα (hν = 1486.6 eV). The samples were analyzed as prepared without pretreatment. Binding energy was corrected with C1s peak at 285 eV. Peak deconvolution of O1s XPS spectra was performed after background removal.Machine learning and descriptors design
Random forest regression is implemented within scikit-learn in order to evaluate the importance of descriptors.20 The number of tree is set to 100.Catalysts descriptor is designed using physical quantities from periodic table. In particular, XenonPy is used to assign the physical quantity in order to define catalysts.21 Here, catalyst descriptor is designed by weighted average physical quantities based on the following equation: ∑(Pi × Ci), where Pi is a physical quantity of element i and Ci is its composition (mol%).
Results and discussion
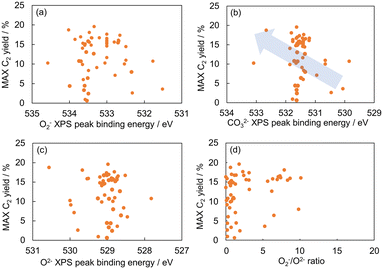
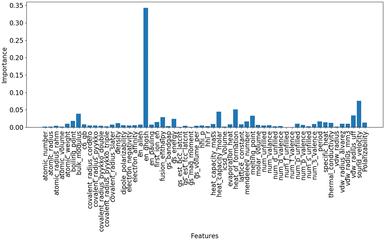
The relationship between the C2 yield and the O1s XPS spectra of the 51 OCM catalysts prepared in our previous study was examined to find property of surface oxygen species related to the catalytic activity for the OCM reaction (Table S1†).9 Each of the O1s XPS spectra was deconvoluted into three peaks, which are assignable to superoxide (O2−), carbonate (CO32−) and lattice oxygen (O2−) in order from high energy to low energy according to the literature.16,17 The relationship between the C2 yield and the peak binding energy of each oxygen species is presented in Fig. 1(a)–(c). Although all the three plots do not show strong correlations, the plot in Fig. 1(b) exhibits better correlation than the those in Fig. 1(a) and (c). Thus, the CO32− species can be a descriptor of the OCM catalyst. The correlation between the O2−/O2− area ratio and the C2 yield was also investigated as presented in Fig. 1(d) because the O2−/O2− area ratio has been suggested to be a descriptor of the C2 yield in the literature.17 As a result, the CO32− peak energy exhibited a better correlation with the C2 yield than the O2−/O2− area ratio in the catalyst dataset of this study. Although the correlation in Fig. 1(b) is weak, the catalyst design based on the CO32− peak energy is considered reasonable because the CO32− peak energy can be related to the surface basicity, which contributes to the catalytic performance. Thus, the CO32− peak energy was selected as the guiding parameter for catalyst design. Since there is a rough trend to increase the C2 yield with an increase of the CO32− peak binding energy, a high CO32− peak binding energy can guide the design of OCM catalysts.Random forest regression was performed on the dataset consisting of “∑(Pi × Ci)” as the descriptor variables and CO32− peak energy as the objective variable to identify the important physical quantities of catalyst elements representing the CO32− peak energy. The importance of descriptor variables is demonstrated in Fig. 2. Ghosh's scale of electronegativity (en_ghosh) and sound velocity have high importance. It should be noted that Ghosh's scale of electronegativity and sound velocity are not considered to directly relate to the CO32− peak energy but indirectly represent some factors determining the CO32− peak energy.
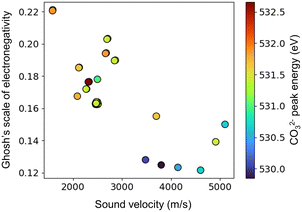
Here, en_ghosh and sound velocity against CO32− are visualized in Fig. 3. It shows that high en_ghosh and low sound velocity tend to result high CO32− energy peak. One can hypothesize that catalysts having high en_ghosh and low sound velocity could result high C2 yield based on the fact high CO32− peak results high C2 yield. Therefore, catalysts having high en_ghosh and low sound velocity are explored from the calculated en_ghosh and sound velocities of a variety of element combinations using ∑(Pi × Ci). The element combinations are created by selecting three elements from the 33 elements for M1, M2, and M3: Li, Na, Mg, Al, Si, Ni, K, Ca, Ti, V, Mn, Fe, Co, Cu, Zn, Rb, Sr, Y, Zr, Mo, Pd, In, Cs, Ba, La, Ce, Nd, Sm, Eu, Yb, Hf, W, Bi. These elements are selected from the elements found in the literature to find new combinations.2 Here, 180![[thin space (1/6-em)]](https://www.rsc.org/images/entities/char_2009.gif) 048 combinations of M1, M2, M3, and support (33C3 (M1, M2, M3 combinations) × 33 (support) = 180
048 combinations of M1, M2, M3, and support (33C3 (M1, M2, M3 combinations) × 33 (support) = 180![[thin space (1/6-em)]](https://www.rsc.org/images/entities/char_2009.gif) 048) where the mol% is set to 2, 4, 2, and 92, respectively are created and weighted average of en_ghosh and sound velocity are calculated (ESI† Table A). Created catalysts combinations are then visualized as shown in Fig. 4. It must be noted that mol% of support is set to 92 which has a large impact on weighted average, therefore, data are aggregated by support. As it can be seen in Fig. 5, catalysts containing Si, Ce, Bi, Yb, and Sm in supports show high en_ghosh and low sound velocity. Based on the data, catalysts listed in Table 2, which have high en_ghosh and low sound velocity, are designed by randomly selecting a Si-based catalyst having ≥0.177 en_ghosh and ≤2190 of sound velocity, two Ce-based catalysts having ≥0.167 en_ghosh and ≤2110 of sound velocity, and eight Yb-based catalysts having ≥0.218 of en_ghosh and ≤1700 of sound velocity. In addition, La-based catalysts are designed by selecting combinations having ≥0.161 of en_ghosh and ≤2404 of sound velocity since La-based catalysts are known to have relatively high activity for the OCM.13,22 It should be noted that the prediction in this indirect design will not offer accurate or pinpoint prediction of metals–support combinations having high C2 yield because the prediction is based on the weak trend between the CO32− peak energy and the C2 yield. However, the predicted catalyst group by this indirect method may contain good catalysts, which may be different from catalysts the direct prediction can find.
048) where the mol% is set to 2, 4, 2, and 92, respectively are created and weighted average of en_ghosh and sound velocity are calculated (ESI† Table A). Created catalysts combinations are then visualized as shown in Fig. 4. It must be noted that mol% of support is set to 92 which has a large impact on weighted average, therefore, data are aggregated by support. As it can be seen in Fig. 5, catalysts containing Si, Ce, Bi, Yb, and Sm in supports show high en_ghosh and low sound velocity. Based on the data, catalysts listed in Table 2, which have high en_ghosh and low sound velocity, are designed by randomly selecting a Si-based catalyst having ≥0.177 en_ghosh and ≤2190 of sound velocity, two Ce-based catalysts having ≥0.167 en_ghosh and ≤2110 of sound velocity, and eight Yb-based catalysts having ≥0.218 of en_ghosh and ≤1700 of sound velocity. In addition, La-based catalysts are designed by selecting combinations having ≥0.161 of en_ghosh and ≤2404 of sound velocity since La-based catalysts are known to have relatively high activity for the OCM.13,22 It should be noted that the prediction in this indirect design will not offer accurate or pinpoint prediction of metals–support combinations having high C2 yield because the prediction is based on the weak trend between the CO32− peak energy and the C2 yield. However, the predicted catalyst group by this indirect method may contain good catalysts, which may be different from catalysts the direct prediction can find.
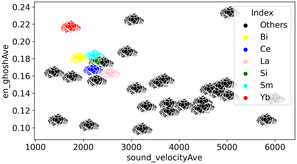 | ||
Fig. 4 Created 180![[thin space (1/6-em)]](https://www.rsc.org/images/entities/char_2009.gif) 048 catalysts combination of Ghosh's scale of electronegativity (en_ghosh) and sound velocity. 048 catalysts combination of Ghosh's scale of electronegativity (en_ghosh) and sound velocity. | ||
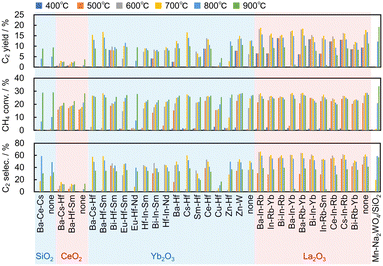 | ||
| Fig. 5 Catalytic performance of the 28 predicted catalysts for the OCM reaction together with only supports and Mn–Na2WO4/SiO2 for comparison. | ||
| M1 | C1 | M2 | C2 | M3 | C3 | A | CA | en_ghosh | Sound velocity (m s−1) |
|---|---|---|---|---|---|---|---|---|---|
| Ba | 0.02 | Ce | 0.04 | Cs | 0.02 | Si | 0.92 | 0.177 | 2184 |
| Ba | 0.02 | Cs | 0.04 | Hf | 0.02 | Ce | 0.92 | 0.168 | 2109 |
| Ba | 0.02 | Cs | 0.04 | Sm | 0.02 | Ce | 0.92 | 0.167 | 2094 |
| Ba | 0.02 | Cs | 0.04 | Hf | 0.02 | Yb | 0.92 | 0.218 | 1637 |
| Ba | 0.02 | Hf | 0.04 | Sm | 0.02 | Yb | 0.92 | 0.220 | 1651 |
| Hf | 0.02 | In | 0.04 | Sm | 0.02 | Yb | 0.92 | 0.219 | 1615 |
| Hf | 0.02 | In | 0.04 | Nd | 0.02 | Yb | 0.92 | 0.219 | 1618 |
| Bi | 0.02 | In | 0.04 | Sm | 0.02 | Yb | 0.92 | 0.218 | 1590 |
| Bi | 0.02 | Hf | 0.04 | Sm | 0.02 | Yb | 0.92 | 0.220 | 1654 |
| Eu | 0.02 | Hf | 0.04 | Nd | 0.02 | Yb | 0.92 | 0.220 | 1679 |
| Eu | 0.02 | Hf | 0.04 | Sm | 0.02 | Yb | 0.92 | 0.220 | 1676 |
| Ba | 0.02 | Hf | 0.04 | Yb | 0.02 | Yb | 0.92 | 0.220 | 1641 |
| Cs | 0.02 | Hf | 0.04 | Yb | 0.02 | Yb | 0.92 | 0.220 | 1652 |
| Cu | 0.02 | Hf | 0.04 | Yb | 0.02 | Yb | 0.92 | 0.220 | 1680 |
| Hf | 0.02 | Yb | 0.04 | Zn | 0.02 | Yb | 0.92 | 0.220 | 1656 |
| Hf | 0.02 | Sm | 0.04 | Yb | 0.02 | Yb | 0.92 | 0.220 | 1638 |
| Ce | 0.02 | Hf | 0.04 | Yb | 0.02 | Yb | 0.92 | 0.220 | 1651 |
| W | 0.02 | Yb | 0.04 | Zn | 0.02 | Yb | 0.92 | 0.220 | 1699 |
| Ba | 0.02 | In | 0.04 | Rb | 0.02 | La | 0.92 | 0.162 | 2392 |
| In | 0.02 | Rb | 0.04 | Yb | 0.02 | La | 0.92 | 0.162 | 2392 |
| Bi | 0.02 | In | 0.04 | Rb | 0.02 | La | 0.92 | 0.163 | 2396 |
| Ba | 0.02 | In | 0.04 | Yb | 0.02 | La | 0.92 | 0.164 | 2397 |
| Ba | 0.02 | Rb | 0.04 | Yb | 0.02 | La | 0.92 | 0.162 | 2400 |
| Bi | 0.02 | In | 0.04 | Yb | 0.02 | La | 0.92 | 0.165 | 2401 |
| In | 0.02 | Rb | 0.04 | Sm | 0.02 | La | 0.92 | 0.161 | 2402 |
| Ce | 0.02 | In | 0.04 | Rb | 0.02 | La | 0.92 | 0.162 | 2402 |
| Cs | 0.02 | In | 0.04 | Rb | 0.02 | La | 0.92 | 0.162 | 2403 |
| Bi | 0.02 | Rb | 0.04 | Yb | 0.02 | La | 0.92 | 0.162 | 2404 |
The catalysts were actually prepared based on the predicted elements listed in Table 2. The loading amount of each element was set to 1 wt%. Although the loading amount (1 wt%) is smaller than those calculated from the compositions in the prediction (2 or 4 mol%), the surface composition of the catalysts prepared by the impregnation method are considered to be compatible to or greater than the compositions used in the prediction. As a result, a total of 28 catalysts were prepared based on the prediction (Table 1). To verify the predictions, O1s XPS spectra of the 28 catalysts were measured. All the O1s XPS spectra are shown in Fig. S1.† Each of the spectra was deconvoluted into three peaks to evaluate the CO32− peak energy (Fig. S2†). As a result, the CO32− peak energies of all the 28 catalysts were larger than 531.2 eV (Table S2†), which means that the 28 catalysts are in the high energy side of Fig. 1. Therefore, the predictions in Table 2 were verified.
Fig. 5 shows the results of the OCM reaction over the 28 catalysts together with only supports and Mn–Na2WO4/SiO2 for comparison. The experimental error was evaluated by five blank (no catalyst) tests, which gave 9.7 ± 0.9% of the C2 yield at 900 °C. The La2O3-based catalysts presented <5% of the carbon missing at all reaction temperatures. The SiO2-based catalysts exhibited <5% at ≤800 °C and 10–15% at 900 °C. The Yb2O3- and CeO2-based catalysts showed <5% at ≤800 °C and 5–10% at 900 °C. The increase of the carbon missing at 900 °C and by using the SiO2-based catalyst might be due to coke formation.
The La2O3- and Yb2O3-based catalysts showed higher activity at lower temperatures than those supported on SiO2 and CeO2. More importantly, several predicted catalysts exhibited comparable C2 yields to that of Mn–Na2WO4/SiO2. Specifically, the most active catalyst was Ba–In–Rb/La2O3, which gave 19% C2 yield, 28% CH4 conversion, and 69% C2 selectivity at 700 °C, while the reference catalyst Mn–Na2WO4/SiO2 gave 19% C2 yield, 34% CH4 conversion, and 57% C2 selectivity at 900 °C. Therefore, Ba–In–Rb/La2O3 exhibited comparable or better catalytic performance to Mn–Na2WO4/SiO2 at lower temperature. This demonstrates that the catalyst design by machine learning of catalyst surface properties is effective for development of catalysts.
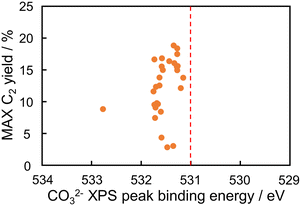
The maximum C2 yields of the predicted catalysts at 400–900 °C were plotted against their CO32− peak binding energies in Fig. 6. The figure does not show a correlation because of the limited kinds of catalysts in the verification experiment: the left lower data in the figure is derived from SiO2 supported catalyst, and the other data are La2O3, Yb2O3, and CeO2 supported catalysts. This result suggests that the CO32− peak binding energy is not the only descriptor of the OCM reaction. This is consistent with the rough trend in Fig. 1(b). However, the predicted catalysts designed from the not-strong descriptor contained Ba–In–Rb/La2O3 having high catalytic performance. This result shows that the indirect catalyst design is effective in development of catalysts.
Conclusions
The OCM catalysts were developed through machine learning of property of their surface oxygen species. In this study, the CO32− peak energy was selected as the property of the surface oxygen species contributing to the OCM catalysts based on the rough trend of the C2 yield increasing with the CO32− peak energy in the data of the previously reported catalysts. Machine learning was then performed to find as the important physical quantities of catalyst elements representing the CO32− peak energy. Based on the relation between CO32− peak energy and the important physical quantities, the catalyst compositions resulting high CO32− peak energy were designed and the 28 catalysts were experimentally prepared. The O1s XPS spectral analysis verified that all the 28 catalysts have relatively high CO32− peak energy. Furthermore, Ba–In–Rb/La2O3, one of the predicted catalysts, exhibited compatible C2 yield with a higher selectivity at lower reaction temperature compared to the conventional Mn–Na2WO4/SiO2 catalyst. The results suggest that the indirect design of catalyst through machine learning of catalyst surface property is effective in developing catalysts. This means that, if one has an understanding or a hypothesis about how catalyst surface properties affect a target catalytic reaction and there is appropriate database of catalyst properties, one can obtain catalyst designs in a similar way to the indirect catalyst design method performed in this study.Author contributions
The manuscript was written through contributions of all authors. All authors have given approval to the final version of the manuscript.Conflicts of interest
There are no conflicts to declare.Acknowledgements
This work was supported by the Japan Science and Technology Agency (JST) CREST (grant no. JPMJCR17P2).References
- E. V. Kondratenko, T. Peppel, D. Seeburg, V. A. Kondratenko, N. Kalevaru, A. Martin and S. Wohlrab, Catal. Sci. Technol., 2017, 7, 366–381 RSC.
- U. Zavyalova, M. Holena, R. Schlögl and M. Baerns, ChemCatChem, 2011, 3, 1935–1947 CrossRef CAS.
- T. N. Nguyen, T. T. P. Nhat, K. Takimoto, A. Thakur, S. Nishimura, J. Ohyama, I. Miyazato, L. Takahashi, J. Fujima, K. Takahashi and T. Taniike, ACS Catal., 2020, 10, 921–932 CrossRef CAS.
- S. Mine, M. Takao, T. Yamaguchi, T. Toyao, Z. Maeno, S. M. A. Hakim Siddiki, S. Takakusagi, K.-i. Shimizu and I. Takigawa, ChemCatChem, 2021, 13, 3636–3655 CrossRef CAS.
- S. Arndt, T. Otremba, U. Simon, M. Yildiz, H. Schubert and R. Schomäcker, Appl. Catal., A, 2012, 425–426, 53–61 CrossRef CAS.
- J. Ohyama, S. Nishimura and K. Takahashi, ChemCatChem, 2019, 11, 4307–4313 CrossRef CAS.
- D. Kiani, S. Sourav, J. Baltrusaitis and I. E. Wachs, ACS Catal., 2019, 9, 5912–5928 CrossRef CAS.
- K. Takahashi, J. Ohyama, S. Nishimura, J. Fujima, L. Takahashi, T. Uno and T. Taniike, Chem. Commun., 2023, 59, 2222–2238 RSC.
- K. Takahashi, I. Miyazato, S. Nishimura and J. Ohyama, ChemCatChem, 2018, 10, 3223–3228 CrossRef CAS.
- L. Takahashi, T. N. Nguyen, S. Nakanowatari, A. Fujiwara, T. Taniike and K. Takahashi, Chem. Sci., 2021, 12, 12546–12555 RSC.
- S. Nishimura, S. D. Le, I. Miyazato, J. Fujima, T. Taniike, J. Ohyama and K. Takahashi, Catal. Sci. Technol., 2022, 12, 2766–2774 RSC.
- K. Sugiyama, T. N. Nguyen, S. Nakanowatari, I. Miyazato, T. Taniike and K. Takahashi, ChemCatChem, 2021, 13, 952–957 CrossRef CAS.
- J. Ohyama, T. Kinoshita, E. Funada, H. Yoshida, M. Machida, S. Nishimura, T. Uno, J. Fujima, I. Miyazato, L. Takahashi and K. Takahashi, Catal. Sci. Technol., 2021, 11, 524–530 RSC.
- K. Suzuki, T. Toyao, Z. Maeno, S. Takakusagi, K.-i. Shimizu and I. Takigawa, ChemCatChem, 2019, 11, 4537–4547 CrossRef CAS.
- K. Takahashi, L. Takahashi, S. D. Le, T. Kinoshita, S. Nishimura and J. Ohyama, J. Am. Chem. Soc., 2022, 144, 15735–15744 CrossRef CAS.
- V. J. Ferreira, P. Tavares, J. L. Figueiredo and J. L. Faria, Ind. Eng. Chem. Res., 2012, 51, 10535–10541 CrossRef CAS.
- J. Xu, Y. Zhang, X. Xu, X. Fang, R. Xi, Y. Liu, R. Zheng and X. Wang, ACS Catal., 2019, 9, 4030–4045 CrossRef CAS.
- I. Kim, G. Lee, H. B. Na, J.-M. Ha and J. C. Jung, Mol. Catal., 2017, 435, 13–23 CrossRef CAS.
- P. Wang, G. Zhao, Y. Wang and Y. Lu, Sci. Adv., 2017, 3, e1603180 CrossRef PubMed.
- F. Pedregosa, G. Varoquaux, A. Gramfort, V. Michel, B. Thirion, O. Grisel, M. Blondel, P. Prettenhofer, R. Weiss, V. Dubourg, J. Vanderplas, A. Passos, D. Cournapeau, M. Brucher, M. Perrot and E. Duchesnay, J. Mach. Learn. Res., 2011, 12, 2825–2830 Search PubMed.
- H. Yamada, C. Liu, S. Wu, Y. Koyama, S. Ju, J. Shiomi, J. Morikawa and R. Yoshida, ACS Cent. Sci., 2019, 5, 1717–1730 CrossRef CAS PubMed.
- Q. Zhou, Z.-Q. Wang, Z. Li, J. Wang, M. Xu, S. Zou, J. Yang, Y. Pan, X.-Q. Gong, L. Xiao and J. Fan, ACS Catal., 2021, 11, 14651–14659 CrossRef CAS.
Footnote |
| † Electronic supplementary information (ESI) available: O1s XPS data; supplementary Tables A and B listing predicted element combinations. See DOI: https://doi.org/10.1039/d3cy00587a |
| This journal is © The Royal Society of Chemistry 2023 |

