 Open Access Article
Creative Commons Attribution 3.0 Unported Licence
The potential of near real-time monitoring of β-D-glucuronidase activity to establish effective warning systems in urban recreational waters†
Konstantinos F.
Makris
 *ab,
Bas
Hoefeijzers
c,
Laura
Seelen
 d,
Remy
Schilperoort
 a and
Jeroen G.
Langeveld
ab
aPartners4UrbanWater, Nijmegen, The Netherlands. E-mail: kostas.makris@urbanwater.nl
bDepartment of Water Management, Faculty of Civil Engineering and Geosciences, Delft University of Technology, Delft, The Netherlands
cMunicipality of Breda, Breda, The Netherlands
dWaterboard Brabantse Delta, Breda, The Netherlands
First published on 31st July 2023
Abstract
Urban water is a crucial element of cities for the purpose of events and recreation, raising concern over the water quality and related hygienic safety. In this study, a near real-time monitoring system of the β-D-glucuronidase activity, the BACTcontrol, was tested in the canals of Breda city in the Netherlands in order to gain insight in its suitability to constitute part of an effective warning system for urban surface waters. Additionally, the qPCR method was also evaluated as a complementary method aiming at determining the E. coli or Bacteroides bacteria, while conventional culture-based measurements aiming at E. coli served as a reference. Analysis of the results obtained via monitoring and sampling during three consecutive bathing seasons revealed that the BACTcontrol demonstrated a timely but short response, implying that it was capable of detecting contamination peaks but not indicating when the water was hygienically safe again. This gap could be filled with qPCR measurements, which proved to provide reliable and fast results. Therefore, the combination of the BACTcontrol with qPCR measurements offers the opportunity to build an effective strategy concerning the use of urban surface waters for recreational purposes, based on timely information on the emergence and duration of contamination events.
Water impactNear-real time monitoring of the enzymatic activity of E. coli provides a sharp but short response to contamination events concerning urban surface waters. Therefore, it is suitable to decide on imposing bans on bathing/recreation, but it is not suitable to decide if the water quality has recovered. Mobile qPCR could be complementarily used to fill in this gap. |
1 Introduction
Urban surface water has numerous functions, including hydrological, urban planning and ecological. Within several EU countries urban water quality has improved in recent decades and as a result citizens increasingly turn to the urban surface water for recreation, especially during the more frequent heat waves. In addition, limited travelling during the COVID 19 pandemic has spurred local water recreation during holidays.Nonetheless, combined sewer systems pose a potential threat to human health, since the spillage of sewer overflows is one of the dominant contamination sources of urban surface waters,1 while peak contamination events occur after intense precipitation.2 CSO discharges are intermittent in nature, causing irregular peak loads to receiving urban water systems. The impact of the CSO discharges on the hygienic water quality depends on the CSO load and the characteristics of the receiving water system.3 In fast flowing brooks the effect of the CSO discharge will move quickly downstream, while in nearly stagnant urban waters, such as Dutch urban canals, the hydraulic retention times could be in the order of days up to weeks, resulting in a prolonged period of poor hygienic water quality. In that period, due to sedimentation and dying off of pathogens the hygienic water quality will gradually recover.
With the increased use, public health authorities increasingly feel the need to advise the public on the safety of urban surface waters for recreational activities, while organizers of the increasingly popular city swims4 also want to know the hygienic water quality as they are responsible for the safety of the participants. Recent research has shown that in some cases a large proportion of participants to city swims developed gastroenteritis due to earlier CSO discharges.4,5 According to relevant guidelines (e.g. 2006/7/EC),6 the adverse effects on water quality are evaluated based on certain fecal indicators, such as Escherichia coli (E. coli) and intestinal enterococci (int. enterococci). Other indicators can also be used, like viruses.7 Conventional culture-based techniques for estimating bacteria concentrations typically take one to three days in the lab before the authorities or water event organizers can be informed on the hygienic water quality. This makes the conventional method unsuitable as a source of information in situations where the hygienic water quality is strongly affected by irregular and often unmonitored CSO discharges.
The need for a rapid test for hygienic water quality has led to the exploration of alternatives, such as rapid enzyme assays8,9 and molecular assays,10,11 which allow for same-day input for decision making. Among the enzyme assay methods, the β-D-glucuronidase (GLUC) and β-D-galactosidase are enzymes used for the detection of E. coli and coliform bacteria, respectively. Scientific findings indicate high correlations between the GLUC activity and typical membrane filtration techniques in samples from freshwater,12–14 creek water,15 and wastewater.13 Reported automated fluorometric prototypes include the TECTA™ B16 system16 and the ColiSense device.15 It is commonly observed that the GLUC activity overestimates the concentration of E. coli especially at low contaminated waters, due to the existence of viable but not culturable (VBNC) bacteria.13
Based on the strong correlations found between the GLUC activity and E. coli colonies, researchers have focused the last decade on automated real-time monitoring of the GLUC activity. Stadler et al.17 compared the potential of two different online bacteria monitoring systems, the ColiMinder and the BACTcontrol, at sediment laden streams. The results indicated a low correlation with respect to culture-based analysis, implying that the monitoring of GLUC activity is not a good proxy. Similar conclusions were drawn also regarding the use of the BACTcontrol (or Coli-Guard) at two ground water resources.18 Burnet et al.19 used the ColiMinder to measure the GLUC activity at the influent of an urban drinking water treatment plant. Although the estimated correlation strength between the GLUC activity and E. coli was generally weak, simultaneous peaks were observed during intermittent contamination events. In another study20 in which the ColiMinder was utilized at a karst spring, similar results were obtained: the correlation coefficient was found to be low in general (0.56), but it increased during rainfall events (0.69). Additionally, Cazals et al.21 monitored the GLUC activity via a ColiMinder system in recreational waters at four locations along rivers, and found site-dependent relationships between the enzymatic activity and E. coli. Therefore, the online monitoring of the GLUC activity seems to serve as an alternative to conventional laboratory methods mainly at high levels of contamination or during CSO induced peaks.
This study explores the potential of monitoring the β-D-glucuronidase activity with a BACTcontrol system in order to establish early warning systems regarding the microbiological status of urban surface waters. The main objective is to assess whether the used technique is capable of timely capturing both the contamination peak and the recovery time so that bans on water recreation are applied only as long as they are actually needed. The results derive from a 3-years monitoring program in the canal network of the city of Breda in the Netherlands. Culture-based enumeration of bacteria is used as a reference, while quantitative polymerase chain reaction (qPCR) measurements are used complementary. The combination and comparison of the applied methods offer a comprehensive evaluation of the near real-time monitoring of the GLUC activity for urban surface waters, highlighting points of attention for effective warning systems.
2 Materials and methods
2.1 Site description
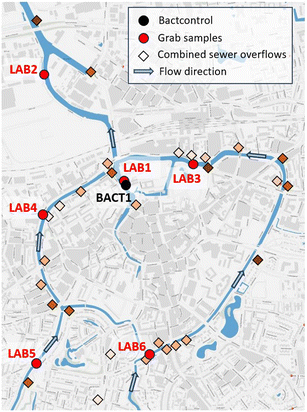
The water quality research took place in the urban water system of Breda, the Netherlands. The historic inner city of Breda is surrounded by large urban canals (Fig. 1). The canals are fed mainly by two small low land streams, the Aa of Weerijs and the Bovenmark, draining the mainly agricultural catchment south of Breda. The sewer system of Breda serves approximately 150![[thin space (1/6-em)]](https://www.rsc.org/images/entities/char_2009.gif) 000 inhabitants and consists mainly of combined (1525 ha) and separate sewer systems (975 ha). The combined sewers discharge during heavy rainfall via 73 CSOs to the receiving water bodies. Fig. 1 shows the locations of CSOs around the city center and their expected overflow discharge potential during uniform precipitation events (darker brown indicates a higher discharge potential). The simulations are performed with a well-calibrated hydrodynamic model of the sewer system in InfoWorks®, which is developed by the municipality of Breda. In addition, the sewer system of Breda comprises 150 pumping stations. In general, the municipality is actively promoting the recreational use of the urban water system and hosts on a regular basis city swims and other water-related activities.
000 inhabitants and consists mainly of combined (1525 ha) and separate sewer systems (975 ha). The combined sewers discharge during heavy rainfall via 73 CSOs to the receiving water bodies. Fig. 1 shows the locations of CSOs around the city center and their expected overflow discharge potential during uniform precipitation events (darker brown indicates a higher discharge potential). The simulations are performed with a well-calibrated hydrodynamic model of the sewer system in InfoWorks®, which is developed by the municipality of Breda. In addition, the sewer system of Breda comprises 150 pumping stations. In general, the municipality is actively promoting the recreational use of the urban water system and hosts on a regular basis city swims and other water-related activities.
2.2 Conducted analyses
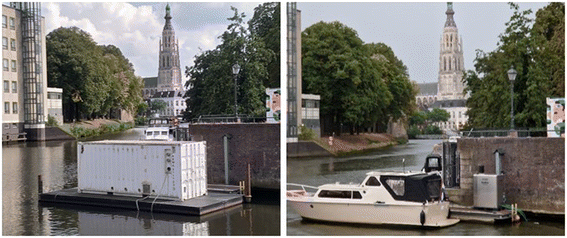
Furthermore, the BACTcontrol can measure with an adjustable, variable measurement frequency. A short measurement interval increases the chance of a clogged filter and, hence, an invalid or unrecorded measurement. On the other hand, a long interval could lead to the non-observation of a peak. The selection of a measurement frequency was therefore a trade-off between required information and practically feasible measurement results, leading to a chosen frequency of one measurement every 90–180 minutes. Therefore, the measuring interval in this research was variable with the prerequisite of at least one measurement every 3 hours. Fig. 2 shows the installation of the BACTcontrol in the canals of Breda in its original form in 2020 (left image) and its development to a small measurement cabinet in 2022 (right image).
2.3 Water quality criteria and sampling strategy
The water quality requirements for official bathing locations are established in Europe through the Directive 2006/7/EC. The Directive requires that the water quality is monitored during the bathing season via (at least) monthly sampling in order to determine the E. coli and/or int. enterococci bacteria concentrations. At the end of each bathing season, the water quality is assessed based on the measurements of the last four years, and the water quality is evaluated as ‘poor’, ‘sufficient’, ‘good’ or ‘excellent’. In addition to the quality assessment suggested by the Directive, hygienic safety limits are established in the Netherlands for acute risks.24 In particular, the signal value is 1800 CFU/100 ml for E. coli and 400 CFU/100 ml for int. enterococci. Additionally, a manual for water recreation and water events in the Netherlands has been developed,25 in order to facilitate water recreation at unofficial bathing locations. The manual uses the same signal value for individual samples for E. coli at 1800 CFU/100 ml. Hence, while the Directive focuses on the assessment of the average water quality, the Dutch guidelines refer to individual measurements.In this article, the values given in the Dutch guidelines are chosen as hygienic safety limits, since they adhere better to the concept of near real-time monitoring and early warning. Additionally, it is assumed that the same limit values correspond to the MPN method (i.e. 1800 MPN/100 ml for E. coli and 400 MPN/100 ml for int. enterococci).
The water quality was researched from May until October in the years 2020, 2021 and 2022. The monitoring program of 2020 consisted of: i) enumeration of the E. coli and int. enterococci concentrations in two samples per week manually obtained at 6 locations (LAB 1-LAB 6), and ii) (semi)-continuous measurements with BACTcontrol at location BACT 1 (same as LAB 1) where a small port is located. Based on the results obtained in 2020, modifications were made for the 2021 sampling and testing approach: i) two samples per week manually obtained at location LAB 1 (independently of precipitation events) and tested in the laboratory with the MPN method, ii) (semi)-continuous measurements with BACTcontrol at the same location as the previous year (BACT 1), and iii) the use of a sampling cabinet (including four bottles for 24-hour time-proportional samples) at LAB 1 location, which was utilized in case a significant peak was detected with the BACTcontrol at location BACT 1. This facilitated the estimation of the actual recovery time of the canals within the imposed hygienic limits in comparison with the recovery time suggested by the enzymatic activity recorded by the BACTcontrol. The third measurement round in 2022 was identical to the 2021 round, excluding the culture-based analysis of individual samples. The samples were obtained close to the shore of the canal (circa 1 m), except for the location BACT1/Lab1 in 2020 which was about 4 m away from the shore due to the floating platform of the BACTcontrol system. Precipitation data was obtained from a rain radar (available by Hydronet) during all measuring rounds, exploring the response of the used methods to rainfall events which could lead to sewer overflows.
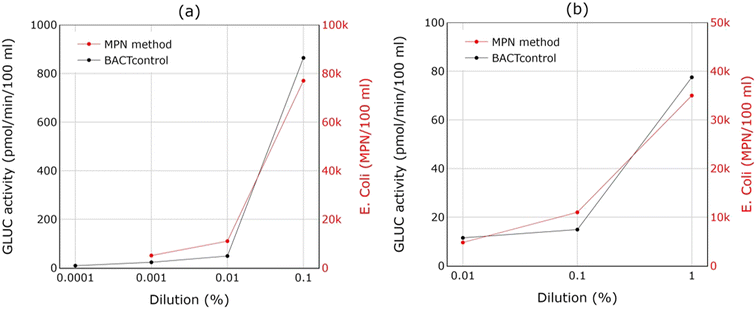
Two additional analyses were conducted, independently of the monitoring program: i) spike tests, and ii) qPCR measurements. In detail, spike tests were performed in order to compare the response of the BACTcontrol with respect to the MPN method. For this purpose, both methods were applied on different dilutions (0.0001–1%) of fresh sewage from Breda to local surface water. This offered the opportunity to verify the response of the enzymatic activity to increasing E. coli concentrations. Additionally, qPCR measurements of E. coli and Bacteroides were performed and compared with the MPN method for six dilution series (0.1, 0.01, and 0.001%) of sewage into surface water, in order to test the applicability of qPCR as a complementary technique to the BACTcontrol. An overview of the measurement periods and respective applied methods is given in Table 1.
| Measurement period | Applied method |
|---|---|
| 1st (2020) | MPN method at 6 locations (LAB 1 – LAB 6) |
| BACTcontrol at location BACT 1 | |
| 2nd (2021) | MPN method at location LAB 1 |
| BACTcontrol at location BACT 1 | |
| MPN method on 24 hour samples from location LAB 1 | |
| 3rd (2022) | BACTcontrol at location BACT 1 |
| MPN method on 24 hour samples from location LAB 1 | |
| General | BACTcontrol and MPN method on dilution series (spike tests) |
| Mobile qPCR and MPN method on dilution series |
3 Results and discussion
3.1 E. coli and GLUC activity measurements
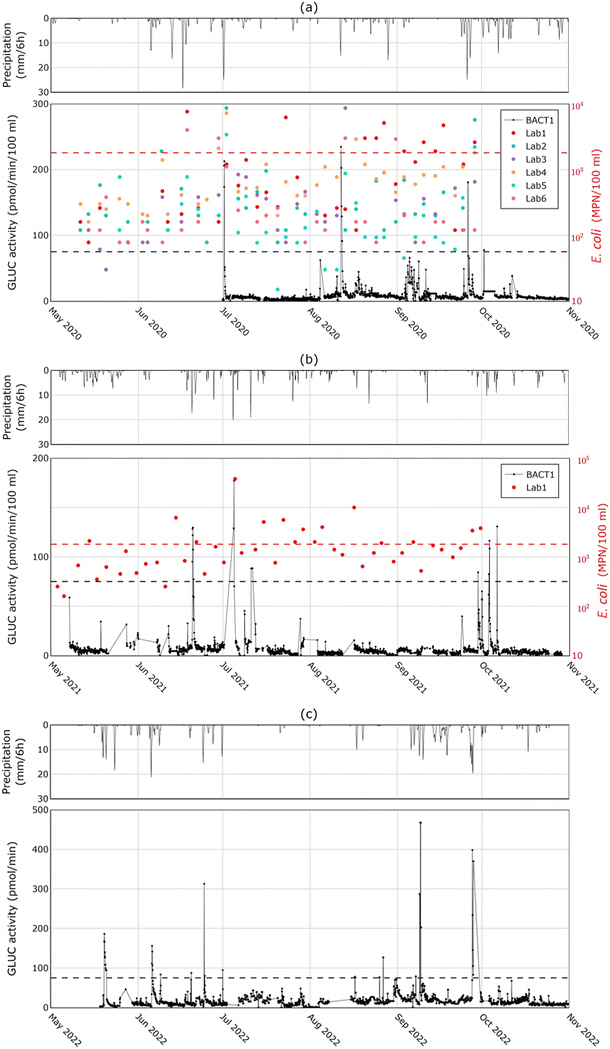
Fig. 3a presents the culture-based measurements for E. coli at locations LAB 1 – LAB 6 and the BACTcontrol measurements at location BACT 1 in 2020. Precipitation data is also given to explore the response to potential overflows. The results reveal that the E. coli concentration in the canals frequently exceeds the hygienic limits (dashed lines). Additionally, it is observed that relatively large showers (>20 mm/6 h) lead to a noticeable adverse impact on the water quality at almost all measurement locations, implying that during such events the deterioration of the water quality of the canals is wide-spread. This is the case, for instance, on 18 June, 1 July and 13 August 2020. It can also be noted that the E. coli concentration at location LAB 1 is regularly above the established limit, also for samples which were obtained at days without (significant) precipitation events. A possible reason is that there is a small port at this location, which is expected to affect the water quality. Additional potential origins of higher E. coli values in the canals during dry weather conditions include the discharges of illicit connections, and feces of ruminants, dogs and birds.26 Furthermore, the hygienic limit for int. enterococci is also exceeded regularly during major showers (Fig. S1 in ESI†). A direct relationship between the results from the BACTcontrol and int. enterococci cannot be established due to the substrate reagent (MUG) used in the BACTcontrol system. If int. enterococci was the target bacterium, then 4-methylumbelliferyl-β-D-glucopyranoside (MUGlu) should be used as a substrate in the BACTcontrol and the enzymatic activity of β-D-glucosidase (GLUCAN) would be measured.Fig. 3a also shows the measurements of BACTcontrol over approximately four months in 2020. Storm events between 10 and 20 mm/6 h do not have a consistent response. For instance, there is a response to events on 11 August and 26 September, but not on 28 August and 7 October. With rain events smaller than 10 mm/6 h, the response is absent or very limited. This is in line with the fact that the combined sewer system in Breda has around 9 mm of storage and 0.7 mm h−1 pump over-capacity, which implies that CSOs could spill with precipitation events that exceed this capacity. The average annual CSO frequency is 5 times per year. Furthermore, a relatively high variation in the enzymatic activity was observed in the measurements of August and early September 2020, although no or a limited amount of precipitation was recorded. Such variations may originate from the disruptive effect of algae and/or increased concentrations of other contaminants, or even by increased E. coli concentrations due to recreational activities around the port. In the same period, analysis on individual samples revealed indeed reduced transparency and an increased chlorophyll content (Fig. S2 in ESI†), measured according to NEN 6520,27 which hint on the possible effect of algae. A higher enzymatic activity during such periods can also be found in other studies.20,28 Based on the obtained measurements, a value of 75 pmol min−1/100 ml was determined as an appropriate alarm value. It exceeds the measured background GLUC activity and is well below the values reached during contamination periods.
Fig. 3b and c present the BACTcontrol measurements in 2021 and 2022, respectively. In the graph, the same pattern as in 2020 can be observed: rainfall events of 10 to 20 mm/6 h result in an increase of the enzymatic activity only in case of triggered sewer overflows, while smaller rainfall events usually cause no significant variations. On several days (20 June and 4 July 2021, and 1 July and 25 September 2022) the measurements exceed the limit value for rain events higher than 10 mm/6 h. This implies again that the sewer storage was exceeded.
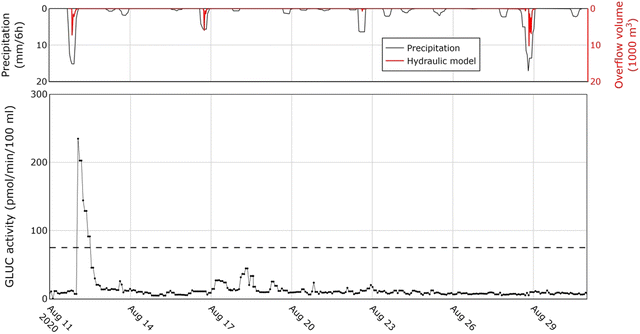
The comparison between the findings of the applied methods indicates that the BACTcontrol is capable of providing an early warning during rainfall events that lead to E. coli concentrations exceeding the established hygienic limit. Higher precipitation levels result in peaks of the enzymatic activity and higher concentrations of E. coli, even though grab samples were obtained several days earlier and/or later than the peaks based on an independent sampling schedule. This gap in sampling is handled in the next section by comparing the BACTcontrol peaks with individual and 24-hour culture-based measurements on a smaller temporal scale. Moreover, the limited response to smaller precipitation events illustrates that the water quality is mainly determined by sewer overflows that only discharge during large showers, rather than by stormwater outlets (with associated illicit household connections) that already discharge during small rainfall events. Nonetheless, there is a distinct case in which the rain radar measured a significant event on 28 August 2020, but there was no response observed in the BACTcontrol measurements (Fig. 4). In order to verify whether there was an actual overflow, a detailed hydraulic model of the canal system in InfoWorks® was fed with the available precipitation measurements. The model revealed that a significant overflow occurred and the BACTcontrol failed to respond. On the contrary, the BACTcontrol responded well to the overflow of 12 August 2020. On the 16 August 2020, there is also an overflow according to the model. In this case, the BACTcontrol has responded although the GLUC activity remained under the limit value.
3.2 Recovery time of water quality
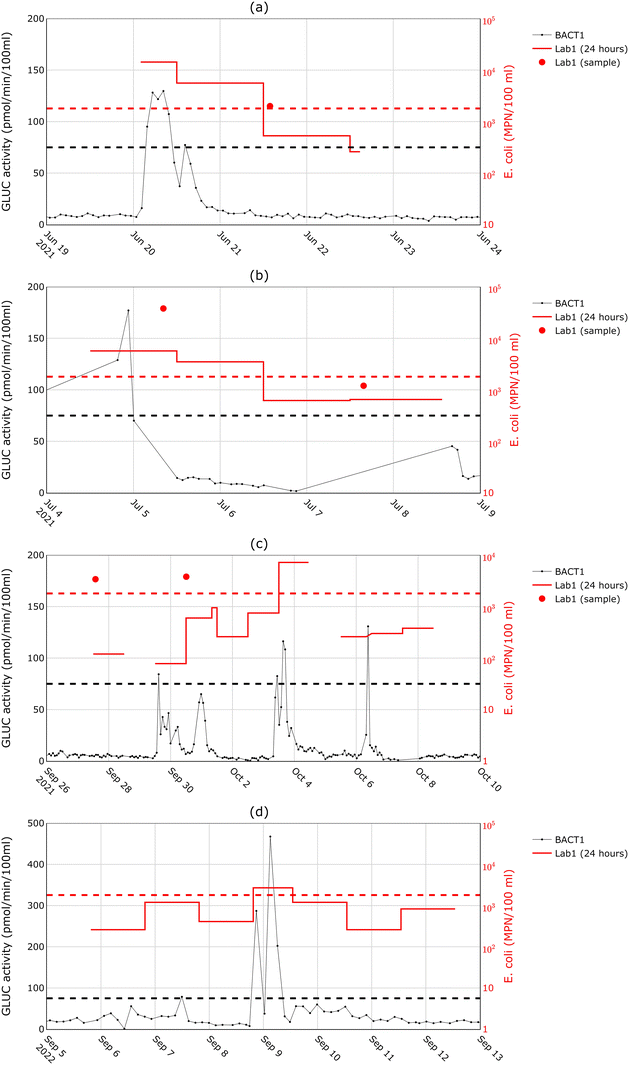
Further analysis of the BACTcontrol measurements of 2020 (Fig. 3a) indicated that even when the enzymatic activity reached high values (>180 pmol min−1/100 ml), implying high E. coli concentrations, it returned to background levels within less than one day. However, culture-based measurements demonstrated E. coli concentrations well above the hygienic limit two to seven days after the contamination event. The response of the BACTcontrol is apparently too short to monitor the long-term presence of E. coli in surface water, as the strong enzymatic activity of bacteria in surface water decreases rapidly. This effect was also observed for increased incubation periods in van Bel et al.,29 and suggests that the BACTcontrol can signal the discharge of fresh sewage, but not the return of water quality to acceptable levels.To better study the performance of the BACTcontrol during surface water recovery after a wastewater discharge, a different monitoring approach was applied in 2021 and 2022. If a large peak was detected by the BACTcontrol, a sampling cabinet was immediately deployed to collect multiple 24-hour composite (time-proportional) samples. Also, several grab samples were collected. Fig. 5 presents examples of the comparison between the results of BACTcontrol, the 24-hour sampling and grab samples. Fig. 5a and b show the measurement results after significant rain events (17 mm/6 h and 20 mm/6 h, respectively). The enzymatic activity decreases faster than the concentration of E. coli in the 24-hour and grab samples, which remain above the limit value for up to two to three days. A similar difference between the enzymatic activity and bacterial concentrations can also be found in the literature,30 although the authors did not mention that this is a systematic effect. Fig. 5c shows the same comparison between the measurement techniques during a period of consecutive showers. The peaks of the BACTcontrol on 29 September 2021 are confirmed by the grab sample but not by the 24-hour measurement. The BACTcontrol peak on 3 October 2021 is confirmed by the 24-hour results, while on 6 October 2021 the BACTcontrol seems to have generated a false alarm. The measurements of 9 September 2022 (Fig. 5d) show a situation in which the recovery time was found to be short by both methods, since a day after the shower both measured indicators already fell below their respective hygienic limits.
The data in Fig. 5 shows that, although the increase of enzymatic activity after sewer overflows into surface water is relatively short, it is long enough to be observed with a standard measuring interval of 90–180 minutes as the one used in this study. It also becomes clear that the decrease in enzymatic activity to background values occurs in most cases sooner than the decrease of E. coli concentrations. This implies that establishing a direct relationship between the GLUC activity and the E. coli concentration would be impossible in this research, since the individual sampling occurred at predefined days, independently of the overflow occurrences. The BACTcontrol seems to be suitable for detecting contamination peaks of surface water quickly and with a certain reliability, but it is not suitable for indicating when the water is hygienically safe again. This observation led to the exploration of another method to cover this gap, the mobile qPCR.
3.3 Mobile qPCR measurements
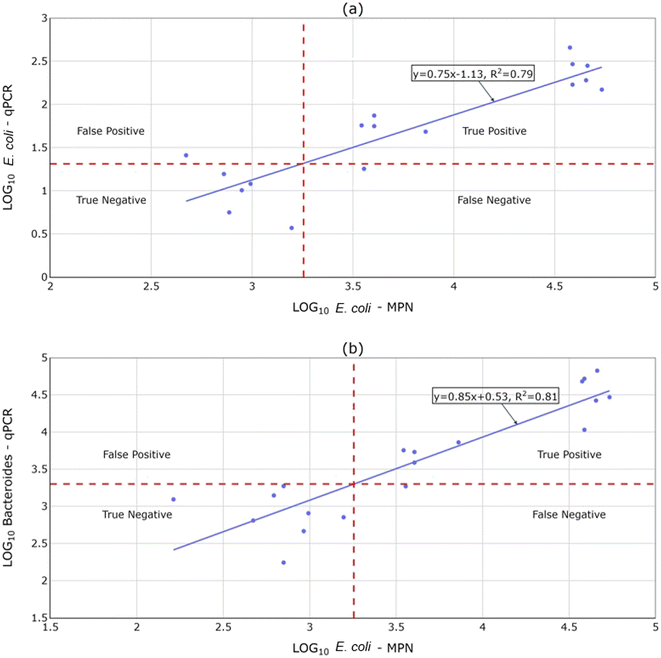
The mobile qPCR was tested as a fast method to be used complementarily with the BACTcontrol, due to the short response of the latter. Fig. 6a shows the relationship between the logarithms of mobile qPCR and culture-based measurements for E. coli and Fig. 6b shows the relationship between the logarithms of mobile qPCR measurements for Bacteroides and culture-based measurements for E. coli. The results are obtained via six dilution series (0.1, 0.01, and 0.001%) of fresh sewage from Breda to local surface water. A linear regression model for each set of measurements was established based on the ordinary least square method. The derived regressions were then used to determine the hygienic limits for the qPCR test based on the known hygienic limit for culture-based methods (1800 MPN/100 ml). The results show that the qPCR method yielded only one false negative and one false positive result for E. coli and one false negative result for Bacteroides. Additionally, the use of Bacteroides offers a slightly more representative linear regression and higher sensitivity for the qPCR method. These results suggest the capability of the qPCR to evaluate the hygienic quality of surface waters, despite its higher uncertainty than conventional methods.2 Finally, it should be stressed that some samples yielded invalid measurements irrespectively of the used fecal indicator. This was probably caused by inhibition due to other present contaminants, which could be tackled by diluting the sample.3.4 Efficiency aspect of the BACTcontrol
| E. coli (MPN method) | |||
|---|---|---|---|
| Below limit | Above limit | ||
| a This is based on the culture-based result via regular sampling. The 24-hour sample showed an E. coli concentration below the limit. | |||
| BACTcontrol | Below limit | 1 October 2021 | 22 June 2022 |
| Above limit | 6 October 2021 | 20 June 2021 (on 4th day <1.800 MPN/100 ml) | |
| 1 July 2022 | 5 July 2021 (on 3rd day <1.800 MPN/100 ml) | ||
| 29 September 2021a | |||
| 3 October 2021 | |||
| 24 June 2022 | |||
| 9 September 2022 (on 2nd day <1.800 MPN/100 ml) | |||
The responsiveness of the BACTcontrol was further assessed by applying the BACTcontrol and MPN method to the same samples. Fig. 7 shows the GLUC activity and the measured E. coli concentration for two individual tests of dilution rates of fresh sewage to surface water: a) 0.001–0.1%, and b) 0.01–1%. These spike tests show that the BACTcontrol led to comparable results for fresh wastewater discharges into surface waters. Similar findings are found in the dilution tests for surface water performed by van Bel et al.29
4 Conclusions
The capability of BACTcontrol for the near real-time monitoring of the β-D-glucuronidase activity was studied during a monitoring program that lasted for three bathing seasons in the canals of Breda in the Netherlands. The results revealed that the BACTcontrol provided a strong response to rainfall events which surpassed the storage and pump over-capacity of the system, as a result of sewer overflows which led to the emission of fecal material. The sensitivity of the BACTcontrol to increased E. coli was also verified by spike tests, in which the BACTcontrol closely followed the pattern of the estimated E. coli concentrations at various dilution ratios of fresh sewage to surface water. The BACTcontrol showed a higher background variation during summer months at a relatively higher water temperature, which was related to the general decline in water quality in summer as a result of an increase in the chlorophyll-a content.However, the BACTcontrol missed one significant contamination event during the monitoring period. Furthermore, the data yield of the BACTcontrol was also often affected by blockages and data communication issues. A significant observed issue was that the enzymatic activity of the E. coli in the studied area decreased rapidly (within less than one day), and hence the BACTcontrol could not be used to evaluate whether the quality of surface water had already returned to acceptable levels. Grab samples and 24-hour samples obtained around the contamination peaks showed that the recovery time of the surface water after a sewer overflow could be much longer than indicated by the BACTcontrol. For quick assessment of hygienic quality during these recovery periods, a mobile qPCR was tested as a complementary technique to BACTcontrol. The qPCR results showed a good correlation with standard methods. However, the use of mobile qPCR did not always result in a valid measurement due to hindrance by numerous contaminants present in the samples. Dilution of the sample could be implemented to avoid inhibition.
Overall, the combination of the BACTcontrol and mobile qPCR techniques could provide the appropriate input for establishment of an effective warning system for monitoring the hygienic quality of urban surface waters and for the issuing of relevant bans on the use of (recreational) waters timely and only when it is actually needed.
Conflicts of interest
There are no conflicts to declare.Acknowledgements
The authors would like to acknowledge Joep Appels and his team at Microlan for delivering and operating the BACTcontrol, Rinske Sonneveld and her team at AQUON for sampling and lab analysis of the urban water quality and performing the qPCR tests.References
- M.-H. Anne-Sophie, S. M. Dorner, S. Sauvé, K. Aboulfadl, M. Galarneau and P. Servais, et al., Temporal analysis of E. coli, TSS and wastewater micropollutant loads from combined sewer overflows: implications for management, Environ. Sci.: Processes Impacts, 2015, 17(5), 965–974 RSC.
- J.-B. Burnet, Q. T. Dinh, S. Imbeault, P. Servais, S. Dorner and M. Prévost, Autonomous online measurement of β-D-glucuronidase activity in surface water: is it suitable for rapid E. coli monitoring?, Water Res., 2019, 152, 241–250 CrossRef CAS PubMed.
- M. A. House, J. B. Ellis, E. E. Herricks, T. Hvitved-Jacobsen, J. Seager and L. Lijklema, et al., Urban drainage-impacts on receiving water quality, Water Sci. Technol., 1993, 27(12), 117–158 CrossRef CAS.
- F. M. Schets, J. F. Schijven and A. M. de Roda Husman, Exposure assessment for swimmers in bathing waters and swimming pools, Water Res., 2011, 45(7), 2392–2400 CrossRef CAS PubMed.
- R. Joosten, G. Sonder, S. Parkkali, D. Brandwagt, E. Fanoy and L. Mughini-Gras, et al., Risk factors for gastroenteritis associated with canal swimming in two cities in the Netherlands during the summer of 2015: A prospective study, PLoS One, 2017, 12(4), e0174732 CrossRef PubMed.
- European Commission, Directive 2006/7/EC of the European Parliament and of the Council of 15 February 2006 concerning the management of bathing water quality and repealing Directive 76/160/EEC, Official Journal of the European Union L, 2006, 327, 37–51 Search PubMed.
- J. Wu, S. Long, D. Das and S. Dorner, Are microbial indicators and pathogens correlated? A statistical analysis of 40 years of research, J. Water Health, 2011, 9(2), 265–278 CrossRef CAS PubMed.
- A. H. Farnleitner, L. Hocke, C. Beiwl, G. Kavka and R. L. Mach, Hydrolysis of 4-methylumbelliferyl-β-D-glucuronide in differing sample fractions of river waters and its implication for the detection of fecal pollution, Water Res., 2002, 36(4), 975–981 CrossRef CAS PubMed.
- L. Fiksdal and I. Tryland, Application of rapid enzyme assay techniques for monitoring of microbial water quality, Curr. Opin. Biotechnol., 2008, 19(3), 289–294 CrossRef CAS PubMed.
- Y. Cao, M. Sivaganesan, C. A. Kelty, D. Wang, A. B. Boehm and J. F. Griffith, et al., A human fecal contamination score for ranking recreational sites using the HF183/BacR287 quantitative real-time PCR method, Water Res., 2018, 128, 148–156 CrossRef CAS PubMed.
- C. P. Fernández-Baca, C. M. Spirito, J. S. Bae, Z. M. Szegletes, N. Barott and D. J. Sausele, et al., Rapid qPCR-based water quality monitoring in New York state recreational waters, Front. Water, 2021, 3, 711477 CrossRef.
- A. Farnleitner, L. Hocke, C. Beiwl, G. Kavka, T. Zechmeister and A. Kirschner, et al., Rapid enzymatic detection of Escherichia coli contamination in polluted river water, Lett. Appl. Microbiol., 2001, 33(3), 246–250 CrossRef CAS PubMed.
- T. Garcia-Armisen, P. Lebaron and P. Servais, β-d-glucuronidase activity assay to assess viable Escherichia coli abundance in freshwaters, Lett. Appl. Microbiol., 2005, 40(4), 278–282 CrossRef CAS PubMed.
- I. George, M. Petit and P. Servais, Use of enzymatic methods for rapid enumeration of coliforms in freshwaters, J. Appl. Microbiol., 2000, 88(3), 404–413 CrossRef CAS PubMed.
- B. Heery, C. Briciu-Burghina, D. Zhang, G. Duffy, D. Brabazon and N. O'Connor, et al., ColiSense, today's sample today: A rapid on-site detection of β-D-Glucuronidase activity in surface water as a surrogate for E. coli, Talanta, 2016, 148, 75–83 CrossRef CAS PubMed.
- A. J. Bramburger, R. S. Brown, J. Haley and J. J. Ridal, A new, automated rapid fluorometric method for the detection of Escherichia coli in recreational waters, J. Great Lakes Res., 2015, 41(1), 298–302 CrossRef CAS.
- P. Stadler, G. Blöschl, W. Vogl, J. Koschelnik, M. Epp and M. Lackner, et al., Real-time monitoring of beta-d-glucuronidase activity in sediment laden streams: A comparison of prototypes, Water Res., 2016, 101, 252–261 CrossRef CAS PubMed.
- G. Ryzinska-Paier, T. Lendenfeld, K. Correa, P. Stadler, A. Blaschke and R. Mach, et al., A sensitive and robust method for automated on-line monitoring of enzymatic activities in water and water resources, Water Sci. Technol., 2014, 69(6), 1349–1358 CrossRef CAS PubMed.
- J.-B. Burnet, É. Sylvestre, J. Jalbert, S. Imbeault, P. Servais and M. Prévost, et al., Tracking the contribution of multiple raw and treated wastewater discharges at an urban drinking water supply using near real-time monitoring of β-d-glucuronidase activity, Water Res., 2019, 164, 114869 CrossRef CAS PubMed.
- A. Ender, N. Goeppert, F. Grimmeisen and N. Goldscheider, Evaluation of β-d-glucuronidase and particle-size distribution for microbiological water quality monitoring in Northern Vietnam, Sci. Total Environ., 2017, 580, 996–1006 CrossRef CAS PubMed.
- M. Cazals, R. Stott, C. Fleury, F. Proulx, M. Prévost and P. Servais, et al., Near real-time notification of water quality impairments in recreational freshwaters using rapid online detection of β-D-glucuronidase activity as a surrogate for Escherichia coli monitoring, Sci. Total Environ., 2020, 720, 137303 CrossRef CAS PubMed.
- ISO 9308-3, Water quality — Detection and enumeration of Escherichia coli and coliform bacteria — Part 3: Miniaturized method (Most Probable Number) for the detection and enumeration of E. coli in surface and waste water, CEN, Brussels, 1998 Search PubMed.
- ISO 7899-1, Water quality — Detection and enumeration of intestinal enterococci — Part 1: Miniaturized method (Most Probable Number) for surface and waste water, CEN, Brussels, 1998 Search PubMed.
- Stuurgroep Water, Decision memorandum working method for individual measurements and measurement frequency for microbiological parameters in the Bathing Water Directive (Beslisnotitie werkwijze individuele metingen en meetfrequentie microbiologische parameters zwemwaterrichtlijn), 2013 Search PubMed.
- E. J. T. M. Leenen, Handbook for events in, on, with, above and around water. STOWA 2019-04A (Handreiking voor evenementen in, op, met, boven en rondom water. STOWA 2019-04A), Stichting Toegepast Onderzoek Waterbeheer, 2019 Search PubMed.
- M. Hootsmans, DNA source detection in the city canals of Breda. 2019.058 (DNA bronopsporing in stadsingels van Breda. 2019.058), KWR, 2019 Search PubMed.
- NEN 6520, Water – Spectrophotometric determination of chlorophyll-a content, Koninklijk Nederlands Normalisatie Instituut, 2011 Search PubMed.
- P. Stadler, G. Blöschl, L. Nemeth, M. Oismüller, M. Kumpan and J. Krampe, et al., Event-transport of beta-d-glucuronidase in an agricultural headwater stream: Assessment of seasonal patterns by on-line enzymatic activity measurements and environmental isotopes, Sci. Total Environ., 2019, 662, 236–245 CrossRef CAS PubMed.
- N. van Bel, B. van der Zaan, A. de Jong, J. Langeveld, A. Hommes and L. Heijnen, Rapid detection of faecal contamination in bathing water (Snelle detectie fecale besmetting in zwemwater), Stichting Toegepast Onderzoek Waterbeheer, 2023 Search PubMed.
- L. M. Mendoza, N. Mladenov, A. M. Kinoshita, F. Pinongcos, M. E. Verbyla and R. Gersberg, Fluorescence-based monitoring of anthropogenic pollutant inputs to an urban stream in Southern California, USA, Sci. Total Environ., 2020, 718, 137206 CrossRef CAS PubMed.
Footnote |
| † Electronic supplementary information (ESI) available. See DOI: https://doi.org/10.1039/d3ew00141e |
| This journal is © The Royal Society of Chemistry 2023 |

