 Open Access Article
Creative Commons Attribution 3.0 Unported Licence
Structure and thermal property relationships in the thermomaterial di-n-butylammonium tetrafluoroborate for multipurpose cooling and cold-storage†
Javier
García-Ben‡
 a,
Juan Manuel
Bermúdez-García‡
 a,
Richard J. C.
Dixey
 b,
Ignacio
Delgado-Ferreiro
 a,
Antonio Luis
Llamas-Saiz
 c,
Jorge
López-Beceiro
d,
Ramón
Artiaga
d,
Alberto
García-Fernández
 e,
Ute B.
Cappel
 e,
Bruno
Alonso
 f,
Socorro
Castro-García
 a,
Anthony E.
Phillips
 b,
Manuel
Sánchez-Andújar
 *a and
María Antonia
Señarís-Rodríguez
 *a
*a
aUniversity of A Coruna, QUIMOLMAT Group, Dpt. Chemistry, Faculty of Science and Centro Interdisciplinar de Química e Bioloxía (CICA), Zapateira, 15071 A Coruña, Spain. E-mail: m.andujar@udc.es; m.señaris.rodriguez@udc.es
bSchool of Physical and Chemical Sciences, Queen Mary University of London, London E1 4NS, UK
cResearch Infrastructures Area, X-ray Unit, University of Santiago de Compostela, 15782 Santiago de Compostela, Spain
dUniversidade da Coruña, Campus Industrial de Ferrol, CITENI-Grupo Proterm, Campus de Esteiro, 15403 Ferrol, Spain
eDivision of Applied Physical Chemistry, Department of Chemistry, KTH Royal Institute of Technology, SE-100 44 Stockholm, Sweden
fICGM, CNRS, Université de Montpellier, ENSCM, 34095 Montpellier Cedex 5, France
First published on 16th September 2023
Abstract
Nowadays around 46% of food production around the world requires refrigeration, which is generally provided either by active vapour-compression (based on refrigerants with liquid–gas transitions) or passive cold-storage (based on solid-to-liquid phase change materials, SL-PCMs). However, in order to avoid fluid losses during the transitions, new thermomaterials with solid–solid transitions are desired for both applications. In this work, we find that [DBA][BF4] (DBA = di-n-butylammonium) is a promising thermomaterial with solid–solid phase transitions. This compound presents thermal properties of great interest not only for active barocaloric refrigeration, but also for passive cold-storage, which make this a unique multipurpose thermomaterial. The observed cold-storage capacity is very close to that of commercial SL-PCMs (E ∼ 135 kJ kg−1), while the pressure-induced thermal changes (ΔS ∼ [200–270] J K−1 kg−1) are superior to those of most barocaloric materials, operating under lower pressures (p ∼ [500–1000] bar). Moreover, the operating temperature range of this material is very adequate for food preservation (250–310 K), which is a great advantage over most barocaloric materials. Beyond the thermal properties, we perform deep structural characterization, which reveals a progressive structural disorder of the [DBA]+ cations and [BF4]− anions as the origin of such thermal properties, which will help the future rational design of enhanced thermomaterials.
1. Introduction
There is clear interest in finding new alternatives for our cooling systems to increase their energy efficiency and decrease the carbon emissions associated with this sector. This is especially important since around 20% of the global electric energy consumption is already devoted to refrigeration,1 both at the industrial and domestic levels, with the aim of preserving food and medicines, achieving body comfort temperature, cooling electronics, and so on.2 Unfortunately, this extensive use of refrigeration is also responsible for around 8% of global greenhouse gas emissions.3Moreover, energy consumption in the refrigeration sector is expected to triple by the year 2050 due, among other things, to global warming. This would mean that, for the first time in history, more energy will be employed for cooling than for heating.
Food preservation is a particularly important aspect for maintaining sustainable development and growth, since currently 46% of the total food production in the world requires refrigeration. Nevertheless, only half of it is properly refrigerated, which leads to around 13% of food losses every year.1 Most perishable food must be preferably stored at chilled temperatures of between 272 and 287 K (−1 °C and 14 °C).4,5
To reach and/or maintain those temperatures two main technologies are normally used, namely, vapour-compression refrigeration and passive cold-storage technologies.
The first type of technology, for example commercial and domestic fridges, employs refrigerant gases in pressurization/depressurization cycles, where refrigerant gases can decrease the temperature from ambient down to sub-zero Celsius. However, those gases present risks for the user and/or the environment, since they are flammable, toxic and/or greenhouse gases. Nowadays, the Kigali Amendment to the Montreal Protocol and the F-gas regulation (EU 517/2014) is phasing out up to 80% of fluorinated refrigeration gases (the vast majority of commercial refrigerant gases) by the year 2050. Meanwhile, hydrocarbons and other flammable alternatives are strictly controlled by the ATEX directive (2014/34/EU). In addition, gases could leak, ending up in the atmosphere and needing replacement, while solids are easier to handle.
Cold-storage technologies use thermally induced phase change materials (PCMs) that can absorb heat from the surroundings and store it, mainly in the form of latent heat, so they can help to cool down when the ambient temperature increases above their phase transition.6 Most PCMs used for cold-storage applications are solid materials that undergo solid-to-liquid phase transitions at transition temperatures (from 20 °C down to sub-zero Celsius) depending on the cooling application.6 These include eutectic mixtures (mixture of salts and salt/water), hydrated salts, paraffins, fatty acids and clathrates.6–9 These substances exhibit very large thermal changes, although they also present important drawbacks for devices, such as: leaks of the liquid phase, incongruent melting, or mechanical strain due to large volume changes, among others.6
Trying to solve some of the limitations of refrigerant gases and solid–liquid cold-storage materials, fluid-free alternatives are gaining increasing interest. That is the case of, for example, the classic thermoelectric refrigeration based on semiconductors10,11 or the more emerging alternative based on solid-state PCMs (SS-PCMs). These latter thermomaterials undergo solid-to-solid (instead of solid to liquid) phase transitions either upon application of pressure (known then as barocaloric materials12–14) or upon change in ambient temperature (known as passive thermal energy storage materials15,16). These phase transitions have associated large thermal changes, which are of interest for cooling and heating technologies. Among other advantages, these thermomaterials with solid-to-solid phase transitions avoid any leak of hazardous and/or greenhouse fluids into the environment, avoid any incongruent melting and exhibit lower thermal changes that would result in more compact devices and less mechanical strain of such devices.
In the recent years, barocaloric materials have been demonstrated to exhibit very large thermal changes, some of them as large as ΔS ≥ 100 J K−1 kg−1 (the same order of magnitude as refrigerant gases) under the application of low/moderate pressures of p = 70–1000 bar (while refrigerant gases normally operate at p ≤ 150 bar).17–34 These barocaloric materials belong to many different families of compounds, such as ammonium or phosphate salts,35–43 superionic conductors,44,45 spin crossover materials,46–52n-alkanes,53 hybrid organic–inorganic materials,54–61 organic plastic crystals62–69 and polymers.70–72 Even more recently, barocaloric effects have been combined with gas adsorption/desorption processes in solid-to-solid breathing-transitions in MOFs, giving rise to larger thermal changes of ΔS ∼ 300 J K−1 kg−1 under pressures as small as p ≤ 16 bar.73
Meanwhile, for thermal energy storage, the most studied SS-PCMs are typically organic polyalcohols (such as, pentaerythritol, neopentyl glycol, trimethylolpropane and pentaglycerine) with plastic crystal transitions.74,75 However, those materials work at room temperature and above, and therefore, are not adequate for cold-storage applications.
Very recently, some of these SS-PCMs used for thermal energy storage applications at high temperature have also been tested for barocaloric applications.62,63,76 However, due to the very large thermal hysteresis (generally required for thermal energy storage), the operating pressure needed to reach reversible thermal changes increases well above p ≥ 2500 bar, which in turn increases the energy demand of a given device.62,63,76
These recent findings suggest that materials useful for passive thermal energy storage (including cold-storage) will exhibit some important limitations for barocaloric refrigeration. For example, cold-storage materials require relatively large thermal hysteresis for separating the temperatures of heat storage and heat release. Meanwhile, barocaloric materials ideally present ultralow thermal hysteresis (of only a few degrees or even smaller), in order to minimize the pressure required for driving the transition in a reversible manner.77,78 For instance, the plastic crystal neopentyl glycol exhibits a large thermal hysteresis of around 15 °C, which makes it suitable for thermal energy storage applications.74,75 However, this large hysteresis makes necessary to apply a pressure of around 2500 bar in order to get reversible barocaloric effects in this neopentyl glycol compound.62 In contrast, the hybrid perovskite [TPrA][Mn(dca)3] exhibits an ultralow thermal hysteresis of 0.9 °C, which gives rise to large and reversible barocaloric effects under the application of only 70 bar.54 Nevertheless, this low thermal hysteresis prevents its use for any type of thermal energy storage.
In this work, we show that it is possible to find thermomaterials that combine moderate thermal hysteresis with a large pressure-responsiveness, which makes them good candidates for multipurpose heating, cooling and thermal energy storage (or cold-storage in the specific case of this study). Here, we focus on the salt di-n-butylammonium tetrafluoroborate ([DBA][BF4]). This compound, first prepared by K. Syed Mohamed in 1988,79 shows two solid-to-solid phase transitions in the region of interest for cold-storage and food preservation. These transitions, which were first studied by G. Zabinska in 1988, take place at Tt1 ∼ 268 K and at Tt2 ∼ 284 K, with an associated enthalpy change of ΔH1 ∼ 11.7 kJ mol−1 and ΔH2 ∼ 2.7 kJ mol−1, respectively.80 To our knowledge, no further information about other thermal parameters (such as the thermal hysteresis or specific heat, for instance) or any structural information about the phase transitions has been reported.
For that reason, we have investigated the thermal properties of this material in order to evaluate its interest for passive cold-storage, as well as for barocaloric heating and cooling, using differential scanning calorimetry (DSC) at different pressures. Furthermore, we have performed detailed structural characterization across the phase transitions, using single crystal X-ray diffraction (SC-XRD), variable-temperature synchrotron powder X-ray diffraction (VT-SPXRD) and solid-state nuclear magnetic resonance spectroscopy (SS-NMR), among others.
Remarkably, this material exhibits a large capacity for cold-storage of E ∼ 135 kJ kg−1 in the range of 250–310 K, as well as very large barocaloric effects of ΔS ∼200 J K−1 kg−1 at 275 K under the application of only 500 bar pressure. We further investigate the relationship between the structural and thermal properties, which will help the future design of multipurpose thermomaterials with enhanced properties.
2. Experimental section
2.1. Materials
Commercially available reagent grade di-n-butylamine (≥99% Sigma-Aldrich) and tetrafluoroboric acid solution, HBF4, (48% wt% in H2O, Sigma-Aldrich) were used as starting materials without further purification.2.2. Synthesis of [DBA][BF4]
The synthesis procedure was similar to that previously reported80 with a slight modification of the recrystallization process. In a typical experiment, a solution of amine (4.6 mmol) in water (10 ml) was prepared. Then, HBF4 (4.6 mmol) was slowly added to the previous solution at room temperature and cooled using an ice-water bath. The solvent was removed using a rotary evaporator. The obtained polycrystalline and colorless powder was stored inside a vacuum desiccator. The obtained material was highly hygroscopic, remaining wet after vacuum treatment. For that reason, the obtained powder was dispersed and recrystallized in p-xylene and subsequently filtered and dried (Yield: 82%). This treatment appears to provide this material with a long-term protection (around a few months) against water adsorption.2.3. Compositional analysis
Elemental analysis was performed in an Elemental Analyzer ThermoQuest Flash EA 1112 using around 2 mg of sample (calc. % C: 44.27, % H: 9.29, % N: 6.45, found % C: 44.13, % H: 9.59, % N: 6.22).2.4. Nuclear magnetic resonance
Liquid-state 1H-NMR spectra were recorded for samples dissolved in CDCl3 (98.5% Acros Organics) using a Bruker Advance 300 MHz equipped with a dual cryoprobe at the University of A Coruña. Chemical shifts were expressed as parts per million (ppm, δ) downfield of tetramethylsilane (TMS) (see Fig. S1 of the ESI†). The description of signals included: t = triplet and m = multiplet. All coupling constants were absolute values and were expressed in Hertz (Hz). δ 6.78 (s, 2H), 3.04 (t, J = 7.8 Hz, 4H), 1.72 (m, J = 7.5 Hz, 4H), 1.39 (m, J = 7.5 Hz, 4H), and 0.94 (t, J = 7.2 Hz, 6H) ppm.Solid-state 1H single-pulse Magic Angle Spinning (MAS) spectroscopy and 13C Cross-Polarization Magic Angle Spinning (CPMAS) NMR were performed with a Bruker NEO 750 spectrometer (B0 = 17.6 T) using 1.3 mm zirconia rotors spun at νMAS = 50 and 15 kHz respectively. Both experiments were carried out at 318 K at the University of Santiago de Compostela.
Variable temperature solid-state NMR (SS-NMR) MAS experiments were performed with a Varian-Agilent 600 WB spectrometer (B0 = 14.1 T) using 3.2 mm zirconia rotors spun at different frequencies (νMAS = 5.5, 10 or 15 kHz) (located on the CNRS campus of Montpellier). 1H single pulse spectra were recorded using π/2 flip angle pulses of 2.5 μs and recycling delays of 5 s. 1H spin-echo spectra were recorded using MAS synchronized interpulse delays, and π/2 and π flip angle pulses of 2.5 and 5.0 μs respectively. Chemical shifts were referenced using adamantane (δiso = 1.8 ppm) as the external reference. 11B single pulse MAS spectra were recorded using π/10 flip angle pulses of 1 μs and recycling delays of 0.5 s. Chemical shifts were referenced using dry NaBH4 (δiso = −42.1 ppm) as the external reference. The temperatures were adjusted using chilled compressed air. The differences between T setpoints and sample temperatures are below 5 K. Pb(NO3)2 was used for the calibration of the sample temperatures following a previously published procedure.81
2.5. Thermal analysis
Variable-temperature differential scanning calorimetry (VT-DSC) in the lower-temperature range (115–150 K) at ambient pressure was performed using a Netzsch DSC 214 Polyma at the KTH Royal Institute of Technology. Meanwhile, VT-DSC in the higher-temperature range (250–310 K) at ambient pressure was carried out using a TA-Instruments Q2000 coupled with an RCS 90 cooler. In both cases, around 10 mg of sample were tested under a 10 K min−1 heating/cooling rate and under a nitrogen atmosphere in the Department of Naval and Industrial Engineering of the University of A Coruña.Heat capacity at ambient pressure, Cp, was calculated by the classic ASTM E1269 standard test method, by which the measured heat flow of the test material is compared to that of a reference material according to82,83
 | (1) |
Variable pressure differential scanning calorimetry (VP-DSC) was performed at various applied pressures from 1 to 1000 bar using a Setaram μDSC7 EVO microcalorimeter equipped with a Teledyne ISCO 65D pressure pump (Queen Mary University of London). Samples of mass ∼20 mg were tested in the temperature range of 250–310 K, using a 1.2 K min−1 heating/cooling rate under isobaric conditions. For evaluating long-term cyclability, we have performed an over 30 hour study under isothermal conditions at 286 K using 10 bar min−1 continuous pressurization/depressurization ramps.
The used DSC equipment shows a temperature accuracy of ±0.1 °C and enthalpy accuracy of ±0.5%.
The thermal conductivity was evaluated under ambient conditions using a C-Term Trident thermal conductivity analyser equipped with a 6 mm flexible transient plane source (TPS) sensor.
2.6. Variable temperature synchrotron powder X-ray diffraction (VT-SPXRD)
VT-SPXRD patterns were recorded at the I11 beamline of the Diamond Light Source Synchrotron (Harwell, UK) using a wavelength of λ = 0.825955(3) Å. The wavelength was determined by Rietveld refinement of a NIST640D silicon standard at room temperature. The sample was enclosed in a glass capillary (inner diameter ? = 0.5 mm) and kept in continuous rotation during data collection to improve powder averaging. Patterns were collected using a Mythen position sensitive detector while heating the sample from 170 K to 335 K. The working temperature was set using a FMB Oxford hot-air blower. Rietveld and Le Bail refinements were carried out using the program GSAS-II.842.7. Single crystal X-ray diffraction (SC-XRD)
Single-crystal X-ray diffraction experiments were carried out at two temperatures well above and below the observed DSC transitions. Two single-crystal data sets of the same crystal were collected at 100 K and 240 K using a Bruker D8 VENTURE Kappa.An X-ray diffractometer equipped with a PHOTON III detector under monochromatic CuKα radiation (λ = 1.54178 Å) at the University of Santiago de Compostela was used. Several crystals among the best-looking ones in the crystallization batch were tested and one was selected for data collection. It was mounted on a MiTeGen MicroMount™ using Paratone® N (Hampton Research). The crystal temperature was changed and stabilized with a cold stream of nitrogen gas from an Oxford Cryosystem 800plus cooler. The data integration and reduction were performed using the APEX3 v2019.1-0 (Bruker AXS, 2019) software suite. The intensities collected were corrected for Lorentz and polarization effects and for absorption by semi-empirical methods based on symmetry-equivalent data using TWINABS 2012/1 of the software suite. The structures were solved by using the novel dual-space algorithm implemented in the SHELXT2018/2 (ref. 85) program and were refined by the least squares method on SHELXL2018/3 (ref. 86). As the presence of twinning in all data collected was clear from visual inspection of diffraction images, all datasets were indexed using CELL_NOW 2008/4. The four primary twin domains at both temperatures could be indexed, and the corresponding orientation matrices were obtained, although the diffraction patterns displayed the presence of several additional domains with minor contribution. The integrations of the reflections were performed with SAINT 8.40B considering simultaneously the predictions given by the four orientation matrices corresponding to the twin domains found. The software used to treat the twinned data is included in the APEX3 suite.
The electron density maxima corresponding with the hydrogen atoms of the NH2+ group of the amine cation were clearly visible in the (Fo-Fc) Fourier map. The rest of the hydrogen atoms of the DBA cation were introduced at idealized positions. All hydrogen atoms were restrained during refinement using the riding model implemented in SHELXL2018/3.
Detailed experimental crystallographic data for phases IV (T = 100 K) and III (T = 240 K) of the [DBA][BF4] compound are included in the ESI, Table S2 of the ESI.† CCDC-2213758 (phase IV) and CCDC-2213757 (phase III) contain the supplementary crystallographic data for this paper. These data can be obtained free of charge from The Cambridge Crystallographic Data Centre viahttp://www.ccdc.cam.ac.uk/structures.
3. Caloric properties
3.1. Cold-storage properties
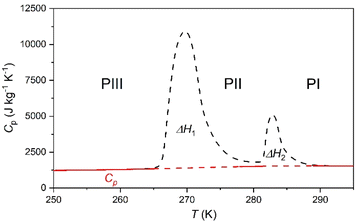
To analyse the cold-storage properties of the material upon changes in ambient temperature, we performed VT-DSC at ambient pressure. The results reveal that [DBA][BF4] undergoes three reversible first-order phase transitions in the temperature range studied (115–310 K), see Fig. 1 and Table 1. The first two transitions occur at Tt1 ∼ 282 K and Tt2 ∼ 269 K on heating, in agreement with a previous report.80 These transitions exhibit a thermal hysteresis of 3 K and 6 K in the case of Tt1 and Tt2, respectively. Furthermore, we also found a new phase transition at Tt3 ∼ 134 K with a thermal hysteresis of 5 K, which has not been previously reported. | ||
| Fig. 1 VT-DSC curves for the [DBA][BF4] compound in the (a) lower- and (b) higher-temperature ranges. | ||
| Transition | T t(h) (K) | T t(c) (K) | ΔH(h) (kJ kg−1) | ΔH(c) (kJ kg−1) | ΔS(h) (J kg−1 K−1) | ΔS(c) (J kg−1 K−1) |
|---|---|---|---|---|---|---|
| a Note: (h) = heating and (c) = cooling. | ||||||
| PI ↔ PII | 282 | 279 | 12.7 | 13.7 | 45.0 | 49.1 |
| PII ↔ PIII | 269 | 263 | 58.3 | 56.6 | 216.7 | 215.2 |
| PIII ↔ PIV | 134 | 129 | 0.37 | 0.43 | 2.65 | 3.24 |
These transitions occur between different phases (PI ↔ PII, PII ↔ PIII, and PIII ↔ PIV) as we will further discuss in the following sections. Interestingly, we observe that the two transitions occurring at higher temperature exhibit very large latent heats of ΔH1 ∼ 13 kJ kg−1 and ΔH2 ∼ 58 kJ kg−1. Even more interestingly, these two transitions are very close in temperature and appear in the range of 250–310 K, covering the temperature range adequate for food preservation and cold-storage. Furthermore, even if the thermal hysteresis is still moderate for cold-storage, both transitions occur very close in temperature and can be combined for thermal energy storage applications.
In that way, the heat absorbed by the combination of both transitions will be maximized for a charging temperature of ∼290 K; meanwhile the stored heat would not be fully released until the temperature decreases back to ∼250 K. This combined use of both close transitions increases the separation between the full charging and discharging temperatures beyond the individual thermal hysteresis of both transitions.
With this in mind, we calculate the thermal storage capacity, E, of the material considering the latent heat of both combined transitions and the heat capacity heat throughout the temperature range from 250 to 310 K, following87
 | (2) |
Accordingly, the sensible heat for the temperature range of 250–295 K can be estimated as the combination of the specific heat integration (red line) and the total enthalpy change (peak's area integration), which gives a storage capacity as large as E = 134.6 kJ kg−1. If we consider only the total enthalpy change (ΔH1+2 ∼ 71.0 kJ kg−1), the observed value is very close to that of many cold-storage materials reported in the literature, such as polyglycol E400 (ΔH = 99.6 kJ kg−1), isopropyl palmitate (ΔH = 95 kJ kg−1) or K2HPO4·6H2O (ΔH = 109 kJ kg−1), and even to that of some commercial ones, such as TH31 (ΔH = 131 kJ kg−1), ClimSel C7 (ΔH = 130 kJ kg−1) or MPCM-30 (ΔH = 140 kJ kg−1).6
Furthermore, according to TGA results, the [DBA][BF4] compound also remains thermally stable up to ∼450 K, similar to other commercial PCMs, see Fig. S2 of the ESI.†
3.2. Barocaloric properties
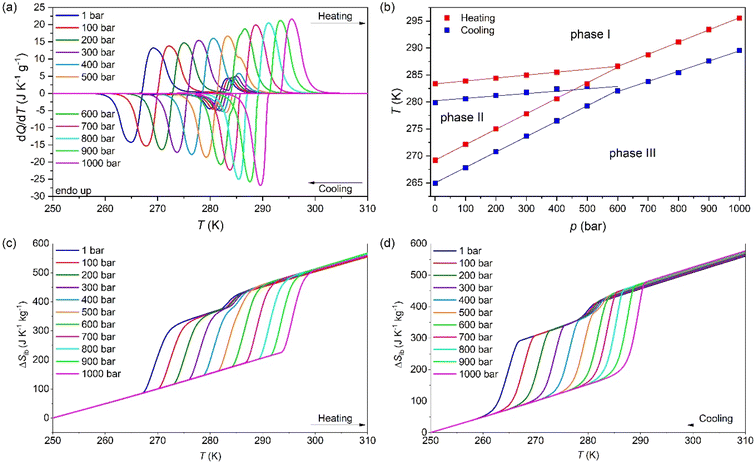
To study the barocaloric properties of [DBA][BF4], we use VP-DSC at various applied pressures from 1 to 1000 bar in the temperature range of 250–310 K, focusing on those transitions with larger thermal changes, Tt1 and Tt2, as previously discussed. Both transitions (between PIII ↔ PII and PII ↔ PI, as we will detail in the following sections) exhibit conventional barocaloric effects, with an increase of the transition temperature upon pressurization, see Fig. 3a.Remarkably, this material has a particular behaviour predicted by M. V. Gorev et al.,88 where a triple-point between phases PI, PII and PIII can be observed in the temperature-pressure phase diagram (see Fig. 3b). To the best of our knowledge, this is the first material reported with the merging transition phenomenon where both transitions (PIII ↔ PII and PII ↔ PI) show a direct barocaloric effect.
In that way, both transitions are fully merged at 600 bar and a single transition is observed for p ≥ 600 bar, which involves a PIII ↔ PI phase transition. This merging is due to the existence of a triple-point, where the stability of phase 2 decreases when pressurizing, until it disappears at pressures above 600 bar. This behaviour, although very scarce, already appear in a few barocaloric materials.88
The barocaloric tunability or the barocaloric coefficient (dTt/dp) of each phase transition is calculated from the slope of the linear regions at Fig. 3b. Due to the merging effect, we can separate three different barocaloric coefficients in heating and cooling.
Below 600 bar, there are two barocaloric coefficients of dTt1/dp ∼ 5.5 K kbar−1 and dTt2/dp ∼ 29 K kbar−1 for the PII ↔ PI and PIII ↔ PII phase transitions, respectively. This noticeable difference between the barocaloric coefficients is responsible for the phase transitions merging into a new single-phase transition for p ∼600 bar. This new PIII ↔ PI phase transition exhibits a new barocaloric coefficient of dTtm/dp ∼ 22.6 K kbar−1.
The calculated latent heat and the entropy change of the transitions Tt1 and Tt2 are similar to the one previously described using VT-DSC at ambient pressure. Meanwhile, the values for the new PIII ↔ PI phase transition is approximately the sum of the values of ΔH and ΔS of the individual phase transitions, reaching values of 75.0 J g−1 and 263.1 J K−1 kg−1 (see the structural characterization for more details).
In addition, we calculated the barocaloric effects of the [DBA][BF4] compound in terms of isothermal entropy change, ΔSit, by using quasi-direct methods.59,89 For that purpose, we first estimated the isobaric entropy change (ΔSib) as a function of temperature following:
 | (3) |
Fig. 3c and d show the obtained ΔSibversus temperature at different applied pressures on heating and cooling. For the pressure range of 1–400 bar, the ΔSibvs. temperature curves exhibit a two step-like curve, in which the largest step is due the PIII ↔ PII phase transition with |ΔSib| ∼ 211 J K−1 kg−1 (at 1 bar) and a small step is related to the PII ↔ PI phase transition with |ΔSib| ∼ 36.0 J K−1 kg−1 (at 1 bar). For pressures above 400 bar, the ΔSibvs. temperature curves exhibit a single and sharp increase of ΔSib due to the PIII ↔ PI phase transition with |ΔSib| ∼ 254 J K−1 kg−1 (at 1000 bar).
Subsequently, the isothermal entropy change (ΔSit) is calculated by difference following:
| ΔSit = ΔSib(p ≠ 1,T) − ΔSib(p = 1,T) | (4) |
It should be noted that, similarly to other rather flexible barocaloric materials, additional changes in isothermal entropy36 were not considered since the thermal expansion coefficient might significantly decrease under pressurization,57 which can lead to overestimations of the total entropy changes.
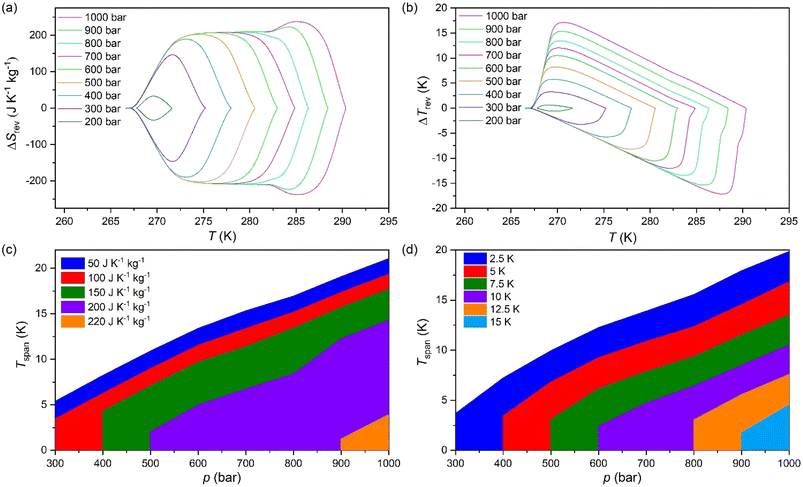
The difference between the cooling curve at p > 1 bar and the heating curve at p = 1, bar, gives the isothermally reversible entropy change (ΔSrev). Fig. S3a of the ESI† and Fig. 4a shows the ΔSit and ΔSrev curves from 200 bar to 1000 bar, respectively. Interestingly, a ΔSrev > 200 J K−1 kg−1 is achieved for pressures higher than 500 bar and the largest value ΔSrev = ∼237.7 J K−1 kg−1 is obtained at 1000 bar at T = 285 K (see Fig. S4 of the ESI†).
Furthermore, we can estimate the reversible adiabatic temperature change (ΔTrev) of the material according to:
| |ΔTrev(S;patm ↔ p)| = |Tc(S;p) − TH(S;patm)| | (5) |
Fig. 4c and d show the operating temperature range or span temperature (Tspan) as a function of the applied pressure, where a given interval of isothermal entropy change or reversible adiabatic temperature change values can be achieved. In both cases, Tspan increases almost linearly with applied pressure. At p = 1000 bar, under isothermally reversible conditions, Tspan = 13 K with reversible ΔSit = 200 J K−1 kg−1, while in the adiabatically reversible case, Tspan = 10 K with reversible ΔTrev = 10 K. This barocaloric performance is in a temperature range from 267 K to 290 K (−6 °C to 17 °C).
The properties of the material presented in this section are quite promising for barocaloric cooling/heating applications. Its temperature transition is slightly below room temperature, an excellent range for refrigeration applications. The material presents a high sensitivity to applied pressures, showing a barocaloric coefficient of 28.9 K kbar−1 for the PIII ↔ PII transition. This transition is higher than barocaloric coefficients reported to date and 22.6 K kbar−1 for the PIII ↔ PI transition when both merged. The material also presents other excellent barocaloric parameters such as ΔSib > 250 J K−1 kg−1 and ΔTrev > 15 K with a wide operational temperature range.
As noted above, the active temperature range of this material corresponds well to the needs of food preservation. Relatively few barocaloric materials have previously been reported in this temperature range.4,5
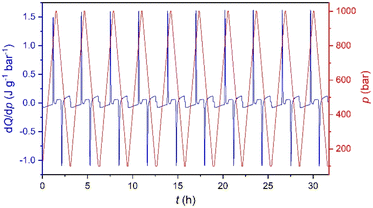
Furthermore, in order to evaluate the long-time performance, we have carried out direct calorimetry studies under several pressurization and depressurization cycles under isothermal conditions. The selected temperature was 286 K, where we can take advantage of the thermal changes of both merged transitions. Fig. 5 shows that the material cyclability remains stable up to, at least, 30 hours with constant values of ΔS ∼ 270 J K−1 kg−1, which are slightly larger than those observed by quasi-direct methods.
For comparison purposes, Fig. 6a shows the transition temperature and the entropy change of [DBA][BF4] together with a selection of the best barocaloric materials reported to date. In this graphic we only include pure barocaloric materials with solid-to-solid phase transitions showing colossal thermal changes of ΔS > 100 J K−1 kg−1.
 | ||
| Fig. 6 (a) All barocaloric material temperature transition (Tt) and entropy change (ΔS) comparison. (b) Operating temperature range and the needed pressure of the largest entropy change materials (>100 J K−1 kg−1). See more information of all materials represented in Table S2 of the ESI†. | ||
We omit other materials that exhibit barocaloric effects due to solid-to-liquid phase transitions (such as n-alkanes with ΔS > 700 J K−1 kg−1)90 or that are combined with simultaneous adsorption/desorption thermal changes (such as the breathing-caloric MIL-53 with ΔS > 300 J K−1 kg−1).73
Meanwhile Fig. 6b shows the operating temperature range of [DBA][BF4] together with other barocaloric materials with large entropy changes (>100 J K−1 kg−1) as a function of the applied pressure, where the most relevant materials are those which need less pressure to show large reversible thermal changes.
In addition, we have also explored the thermal conductivity of the material that shows values of κ ∼ 0.2 W m−1 K−1 similar to the rest of non-metallic barocaloric materials.13 For practical refrigeration applications, even if the thermal conductivity is relatively low, it can be improved by creating composites with thermal conductive materials, such as carbon materials.13
4. Structural characterization
In order to delve deeply into the structural dynamics and origin associated with the observed thermal changes, we perform single crystal and synchrotron powder X-ray diffraction, as well as solid-state 1H-, 13C- and 11B-NMR. As will be later explained in detail, the thermal changes are found to be related to a progressive increase in the structural disorder of both di-n-butylammonium cations and tetrafluoroborate anions.Single crystal X-ray diffraction (SC-XRD) allowed the elucidation of the crystal structures of the low-temperature phases IV and III, which exhibit low or even negligible disorder. Nevertheless, at higher temperatures the presence of twinning and strong diffuse scattering (characteristic of plastic crystal transitions) hindered resolving the crystal structure.
Therefore, the structures with higher disorder (PI, PII and PIII) were further studied by using variable temperature synchrotron powder X-ray diffraction (VT-SPXRD) and solid-state 1H-, 13C- and 11B-NMR. Table 2 summarizes the main features of the different polymorphs.
| Polymorph | T (K) | Space group | [DBA]+ configuration | [BF4]− configuration | Analysis technique |
|---|---|---|---|---|---|
| a Note: SC-XRD = single crystal X-ray diffraction, (h) = heating, and (c) = cooling. | |||||
| PIV | <134 | Ccce (orthorhombic) | Ordered zig-zag chain | Distorted tetrahedral | SC-XRD |
| PIII | 134–260 | Cmme (orthorhombic) | Ordered zig-zag chain | 4-Fold disorder of F atoms | SC-XRD, SS-NMR |
| PII | 260–280 | Cmme (orthorhombic) | Disorder of terminal –CH3 | Full rotation of F atoms | VT-SPXRD, SS-NMR |
| PI | >280 | I4/mmm (tetragonal) | Disorder of complete butyl chains | [BF4]− split into 2 sites | VT-SPXRD, SS-NMR |
4.1. SC-XRD characterization (PIV and PIII)
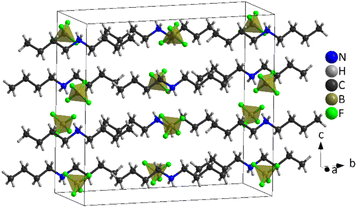 | ||
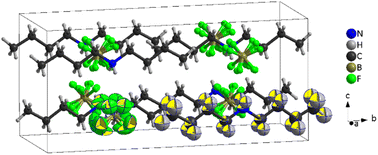
| Fig. 7 Structure of [DBA][BF4] at 100 K (PIV), where the tetrahedra correspond to [BF4]− anions and the chains to [DBA]+ cations and the black cage represents the unit cell. | ||
The asymmetric unit of phase IV is formed by 1/2 [DBA]+ and 1/2 [BF4]−, as both moieties are placed over a 2-fold symmetry axis.
In the case of the [BF4]− anions, the boron atoms are in a slightly distorted tetrahedral environment with two different B–F bond lengths (1.404(5) Å and 1.380(5) Å). Meanwhile, the [DBA]+ cations show a perfect zig-zag configuration of the alkylammonium chains (see Fig. 7).
Concerning the molecular arrangement within the crystal structure, this compound displays a significantly distorted NaCl-type structure where the [DBA]+ cations are surrounded by six [BF4]− anions in a distorted octahedral environment, and vice versa (see Fig. S5 of the ESI†).
The interactions between the anionic and cationic components are electrostatic and via H bonds. In this latter case, the donor atoms are the N-atoms of the amine groups and the acceptor atoms are the F atoms of [BF4]− anions (see Fig. S6 of the ESI†). The distances between hydrogen and fluorine atoms are around 2.19 Å and 2.30 Å; the two fluorine atoms involved in the H bonds are those with the longest B–F bond lengths (1.405(5) Å).
The obtained crystal structure of this higher temperature phase III is very similar to that previously described for phase IV, although the local symmetry in the environment of both ions has increased from point group 2 (C2) to mm2 (C2v). The molecular geometry of both ions is compatible with this increased symmetry; however, while the DBA cations remain ordered, the BF4 anions are now best represented by a fourfold disorder model. The two fluoride atoms involved in N–H⋯F hydrogen bonds display longer B–F bond distances (1.381(14) and 1.384(13) Å) compared to the other two (1.352(13) and 1.360(15) Å) that are the acceptors of weaker C–H⋯F interactions. The [BF4]− anions remain recognisably tetrahedral on average, rather than appearing spherical as in the case of full orientational order; this could explain the small enthalpy and entropy changes experimentally observed for the transition between phases IV and III.
4.2. VT-SPXRD (PII and PI) and SS-NMR (PIII, PII, and PI) characterization
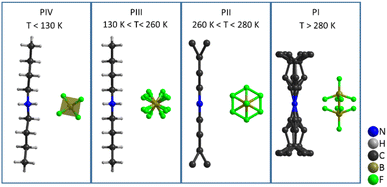
As previously mentioned, the progressive increase in the structural disorder hinders the structural characterization through SC-XRD and, therefore, we used VT-SPXRD for completing the structural characterization of PII and PI. Moreover, we use SS-NMR to delve deeply into further structural details of also disordered PIII. These analyses reveal a progressive disorder of the [DBA]+ cations and [BF4]− anions, as represented in Fig. 8, which will be the structural origin of the entropy changes observed by VT-DSC.From the analysis of VT-SPXRD patterns (see Fig. S7 of the ESI†), two phase transitions can be clearly observed at Tt1 ∼ 280 K (PI ↔ PII) and Tt2 ∼ 260 K (PII ↔ PIII), in fully agreement with VT-DSC data. These data were fitted using the Le Bail method and PIII as a starting model (Fig. S8 of the ESI†). Subsequently, PI and PII were indexed by comparison with PIII.
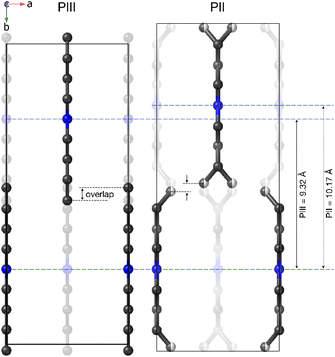
Here, PII shows the same orthorhombic space group Cmme as PIII (see Fig. S9 of the ESI†) with a large increase of the b axis (from b ∼ 18.5 Å to b ∼ 20.3 Å) and, in turn, a very large volume increase of ∼8.4%. Meanwhile, PI shows a body-centred tetragonal symmetry with the space group I4/mmm, where the lattice parameters are a ∼ 5.7 Å and c ∼ 20.5 Å (Fig. S10 of the ESI†). Here, the basis vectors are related as:
Using the initial Le Bail refinement, we propose structural models for PI and PII, which were generated and refined by the Rietveld method. For phase II, we used the known crystal structure obtained from SC-XRD of phase III as the initial model. The obtained crystal structure and details of the refinement are summarized in Fig. S11 and Table S3 of the ESI†.
The most noticeable feature of the crystal structure of PII is the disorder of the terminal methyl group of the DBA cations, which is split into two different positions (Fig. 9), similar to other 2D perovskites.59,91,92 This disorder means that it is no longer possible for adjacent butyl chains along the b direction to overlap as in phase III (see Fig. 10), and is thus responsible for the sudden increase in the b lattice parameter. In addition [BF4]− anions show a more severe disorder than that previously observed in PIII.
Meanwhile, the disorder in PI affects the whole butyl chain. Moreover, the [BF4]− ion sits slightly away from an inversion centre, so that the B atom is now disordered between two sites in addition to the disorder of the F atoms about the fourfold axis. The details of this refinement are given in Fig. 9, Fig. S12 and Table S4 of the ESI.†
These data reveal that the structural disorder of [DBA]+ and [BF4]− is mainly responsible for the thermal changes observed by DSC. As can be observed in Fig. 9, the transition PI ↔ PII involves a lower structural disorder than PII ↔ PIII and PIII ↔ PIV, which explains the larger thermal changes experienced in these latter transitions. Accordingly, we have focused on the thermal characterization of such transitions.
In the same line, the larger barocaloric coefficients observed by VT-DSC can be explained by the volume changes experience by the material.
In that regard, Fig. 11a and b show the evolution of the lattice parameters and the volume as a function of temperature as obtained from the Le Bail refinement of the SPXRD patterns.
All phases exhibit conventional thermal expansion upon heating in all cell parameters, except PII that exhibits negative thermal expansion along the c-axis.
The observed volume changes can be used to indirectly estimate the barocaloric coefficients associated with the different transitions following the Clausius–Clapeyron equation:12
| dT/dp = ΔV/ΔS | (6) |
In summary, the structural characterization confirms that the large entropy changes are related to the structural disorder of the [DBA]+ cations and [BF4]− anions, while the large barocaloric coefficients are originated through very large volume changes of up to ∼8.4% in the case of the transition PII ↔ PIII.
| Phase | T 2' (ms) | |||
|---|---|---|---|---|
| CH3 (1) | C–CH2–C (2–3) | N–CH2 (4) | –NH2 (5) | |
| a Note: Obtained using a spin-echo at υMAS = 15 kHz and T settled at: 278 K (PI), 263 K and 261 K (PII), 243 K (PIII). | ||||
| PI | 0.66 | 0.50 | 0.65 | 0.75 |
| PII | 0.48 | 0.26 | 0.37 | |
| PIII | 0.2–0.3 | 0.3–0.4 | ||
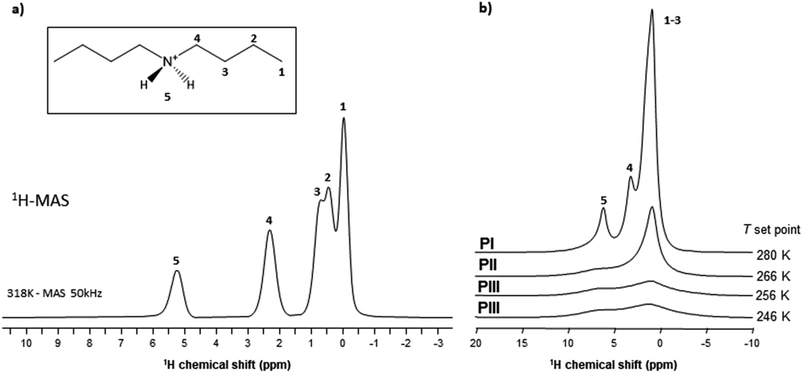
The highest values obtained for PI can therefore be explained by a higher degree of motion of the [DBA]+ cation allowing for a decrease in the effective dipolar couplings. Also, this cation appears slightly more mobile in phase II compared to phase III, but the differences are smaller than with phase I. This gradual increase in [DBA]+ mobility from phase III to phase I is consistent with the decrease in density and the increase in alkyl chain disorder that can be extracted from X-rays data.
As VT-SPXRD analysis and the solid-state 1H single-pulse MAS spectra showed, the PIII ↔ PII phase transition shows larger disorder/mobility in the terminal –CH3, while the PII ↔ PI phase transition presents larger disorder/mobility in the rest of the chain. Meanwhile, for higher temperatures and pressures (after the triple point), the transitions will involve a direct disorder from PIII to PI. Here, the dibutylammonium chains get completely disordered in one step, rather than in a progressive manner with an initial disorder of the terminal –CH3 groups.
On one hand, the PIII ↔ PII phase transition shows a very large volume change due to the disorder of the terminal –CH3 of both chains of [DBA]+ cations (see Fig. 9 and 12), while the PII ↔ PI phase transition, involving the rest of the chain, is less relevant to volume changes (see Fig. 9 and 12). In that regard, the new transition PIII ↔ PI after the triple point would have a volume change close to the volume change of the PIII ↔ PII transition, which also explains the similarity in the barocaloric coefficients for both transitions. In the same line, the PIII ↔ PI phase transition involves an order/disorder process affecting the four carbons of each chain, so the resulting values of ΔH and ΔS would correspond to the addition of the thermal changes of the individual PIII ↔ PII and the PII ↔ PI transitions, as confirmed by DSC.
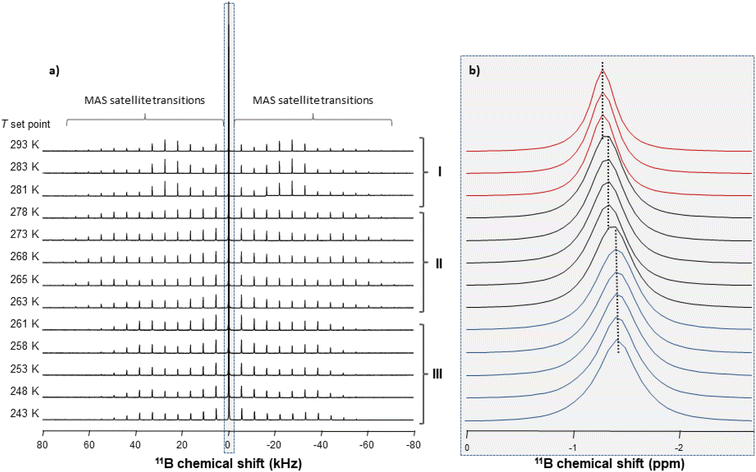
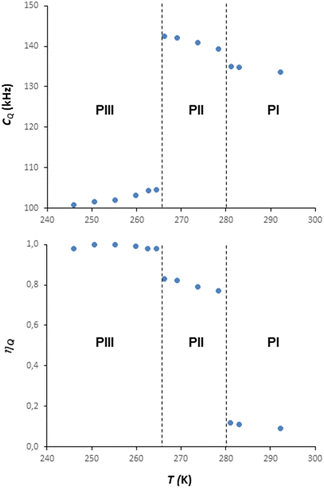
Information on the thermal behaviour of [BF4]− might be gained from 11B NMR spectroscopy. Fig. 13 present a series of 11B spectra obtained by increasing T. Clear discontinuities in the spinning sideband (SSB) patterns (Fig. 13a) and in the isotropic chemical shifts (Fig. 13b) are observed and assigned to the transitions between phases occurring in these ranges of temperature. Fitting the SSBs allowed the estimation of the parameters of the 11B quadrupolar couplings (coupling constant CQ and asymmetry parameter μQ) at each temperature.
Their variations are plotted in Fig. 14. The discontinuities observed for CQ and μQ coincide with those observed by X-ray diffraction (see Fig. 9). They are again related to the transitions between phases. For phase III, the increase in T leads to a slight and gradual increase in CQ before a sudden increase at the transition to phase II. Such increase in CQ might be explained by a loss in the degree of symmetry of the electric field gradient due to a deformation of [BF4]− and/or to a hindrance of the orientational motion of the anion. For phase II, when the T is increased, we observe a gradual decrease in CQ and μQ that becomes sudden at the transition to phase I. The change in μQ is important (from 0.77 to 0.12 at the transition) and denotes either a strong reorganisation in the distribution of anions and cations or the appearance of new motions leading to a different time-averaged quadrupolar coupling tensor. This latter argument bears consistency with the increase in motions detected by 1H MAS NMR. In such a case, the small value of μQ points to an almost axial motion, compatible with the refined structure of phase I (see Fig. 9). Therefore, these data further confirm a large disorder increase within the phase transitions, which would be the origin of the barocaloric properties.
In summary, all these structural studies have shown that the four phases and the corresponding three phase transitions of [DBA][BF4] are related to an increase in the disorder of the ions (see Fig. 9). At low temperature (T < 130 K), phase IV is the most stable phase and both cations and anions are fully ordered. In phase III, observed in the temperature range 130 K to 260 K, the [DBA]+ cations remain ordered with a zig-zag conformation, but the [BF4]− anions are slightly disordered. Phase II is stable in a small range of temperatures (260–280 K). In this phase, the [DBA]+ cations are partially disordered on the ending methyl groups. Finally, phase I is stable for T > 280 K, with both [DBA]+ cations and [BF4]− anions heavily disordered.
These results highlight once again the importance of structural disorder for enhancing barocaloric and thermal changes, which is especially large in molecular and/or ionic compounds. Furthermore, the results suggest that the combination of multiple phase transitions that converge in a triple point can maximize thermal changes, which will bring future triple-point materials into the spotlight of barocaloric and cold-storage applications. In addition, it should be noted that further efforts must be made in order to increase the relatively low thermal conductivity of non-metallic thermomaterials for practical applications. On the other hand, these results show that, despite apparent incompatibilities, it is possible to find solid-state thermomaterials that can act as multipurpose compounds for active barocaloric cooling and passive cold-storage. This opens the door towards the design of more efficient devices that could switch between active (energy-consuming) and passive (non-energy consuming) modes depending on the climate and/or surrounding conditions, and/or that can switch from an active refrigeration to a temporary cold-storage mode if an electric failure occurs.
5. Conclusions
We have been able to obtain easily and under mild conditions a [DBA][BF4] ionic compound, which is composed of lightweight atoms and has a low density of 1.25 g cm−3 (from single crystal diffraction at 100 K). This material undergoes three order-disorder transitions, exhibiting four phases in the temperature range 100–300 K, of which the lowest-temperature phase IV is newly reported here. The PIV ↔ PIII phase transition has a low entropy change of ∼0.4 J K−1 kg−1 at Tt3 ∼ 130 K and it is associated with the partial disorder of the [BF4]− anions. On the other hand, the PIII ↔ PII phase transition exhibits a large entropy change of ∼205 J K−1 kg−1 at Tt2 ∼ 269 K and it is mainly due to order-disorder processes of the two-terminal methyl group of the [DBA]+ cations. The PII ↔ PI phase transition has a moderate entropy change of ∼38 J K−1 kg−1 at Tt1 ∼ 282 K mainly due to the disorder of all carbon atoms of the [DBA]+ cations. This material presents potential for cold-storage applications due to the fact that PIII ↔ PII and PII ↔ PI phase transitions show a total enthalpy change (∼71.0 kJ kg−1) similar to commercial materials, along with a moderate thermal hysteresis (3 K and 6 K for Tt1 and Tt2, respectively). Furthermore, in addition to the transition temperature (Tt1 and Tt2) and the large thermal changes (ΔS = 245 J K−1 kg−1), the [DBA][BF4] compound exhibits a large sensitive to pressure (dT2/dp ∼29 K kbar−1 and dTm/dp ∼ 22.6 K kbar−1) allowing the material to have excellent barocaloric properties, including a large pressure-driven reversible isothermal entropy change (ΔSrev > 200 J K−1 kg−1) and a large reversible adiabatic temperature change (ΔTrev ∼ 17 K). Additionally, the material exhibits large barocaloric effects with a temperature span of 15 K, from 266 K to 281 K under the application of only 500 bar, which can be extended to 24 K, from 266 K to 290 K, under the application of 1000 bar, resulting in an excellent material for barocaloric heating or refrigeration.These results highlight that [DBA][BF4] is not only a good candidate as a solid–solid cold-storage material, but also as a new barocaloric material for cooling applications near 273 K, which make this new compound a very versatile multipurpose material for food preservation, either through passive cold-storage or active barocaloric refrigeration, opening the door to develop new multipurpose solid thermomaterials.
Finally, this work emphasises that relating the thermal properties to the structural transitions of [DBA][BF4], thanks to the combination of various characterization techniques, is essential to understand the structure–property relationships that are necessary to design new thermomaterials.
Conflicts of interest
There are no conflicts to declare.Author contributions
J. G.-B. and J. M. B.-G. contributed equally to this work and were involved in most of the experimental work. S. C.-G., M. S.-A. and M. A. S.-R. conceived the project. R. J. C. D and A. E. P. were involved in VT-SPXRD and high pressure DSC experiments. M. S.-A. and I. D.-F. were involved in VT-SPXRD experiments. S. C.-G., M. S.-A. and A. L. L.-S. were involved in SC-XRD experiments. J. L.-B. and R. A. were involved in low-pressure DSC and Cp calculations. A. G.-F. and U. B. C. were involved in low-temperature DSC and VT-XRD experiments. B. A. performed solid-state NMR. All authors were involved in the discussion of results and in the manuscript writing and revision. M. S.-A. and M. A. S.-R. directed and supervised this project.Acknowledgements
The authors acknowledge financial support from the project PID2021-122532OB-I00 funded by MCIN/AEI/10.13039/501100011033/and by FEDER Una manera de hacer Europa, the project PDC2021-121076-I00 funded by MCIN/AEI/10.13039/501100011033 and by the European Union Next Generation EU/PRTR and the project ED431C 2022/39 funded by Xunta de Galicia. This publication is part of the grant RYC2021-033040-I, funded by MCIN/AEI/10.13039/501100011033 and from European Union «NextGenerationEU»/PRTR», and granted to J. M. B. G. This researcher is also grateful for the support received from the UDC-Inditex InTalent Programme. J. G.-B. acknowledge Xunta de Galicia for Predoctoral Fellowship. I. D.-F. thanks Ministerio de Universidades for a FPU Predoctoral Fellowship. A. G.-F. and U. B. C. acknowledge the financial support of the Göran Gustafsson foundation. R. J. C. D. and A. E. P. would like to acknowledge the financial support of EPSRC throughout the provision of the funding (EP/S03577X/1). The authors thank the Diamond Light Source for the award of beamtime (CY30448-1 on I11), and Eamonn Connolly for his assistance in the experiment. The authors also thank Xavier Moya from the Department of Materials Science at the University of Cambridge, for granting access to his lab for preliminary VP-DSC measurements on still non-stable and wet samples and the use of the analytical facilities available at the Research Infrastructures Area of the University of Santiago de Compostela.References
- The Role of Refrigeration in Worldwide nutrition (2020), 6th Informatory Note on Refrigeration and Food, https://iifiir.org/en/fridoc/the-role-of-refrigeration-in-worldwide-nutrition-2020-142029, accessed 19 January 2023 Search PubMed.
- I. I. R. IIF-, D. Coulomb, J. Dupont and A. Pichard, The Role of Refrigeration in the Global Economy (2015), 29th Note on Refrigeration Technologies, https://iifiir.org/en/fridoc/the-role-of-refrigeration-in-the-global-economy-2015-138763, accessed 13 February 2023 Search PubMed.
- I. I. R. IIF-, V. Morlet, D. Coulomb and J. Dupont, The impact of the refrigeration sector on climate change, 35th Informatory Note on refrigeration technologies, https://iifiir.org/en/fridoc/the-impact-of-the-refrigeration-sector-on-climate-change-141135, accessed 13 February 2023 Search PubMed.
-
S. J. James and C. James, Chilling and Freezing, Elsevier Inc., 2014 Search PubMed
.
- B. H. Lado and A. E. Yousef, Microbes Infect, 2002, 4, 433–440 CrossRef PubMed
.
- E. Oró, A. de Gracia, A. Castell, M. M. Farid and L. F. Cabeza, Appl. Energy, 2012, 99, 513–533 CrossRef
.
- G. Li, Y. Hwang and R. Radermacher, Int. J. Refrig., 2012, 35, 2053–2077 CrossRef CAS
.
- G. Li, Y. Hwang, R. Radermacher and H. H. Chun, Energy, 2013, 51, 1–17 CrossRef CAS
.
- X. Q. Zhai, X. L. Wang, T. Wang and R. Z. Wang, Renew. Sustain. Energy Rev., 2013, 22, 108–120 CrossRef CAS
.
- W. Sun, W. Di Liu, L. Li, D. Z. Wang, L. C. Yin, M. Li, X. L. Shi, Q. Liu and Z. G. Chen, Energy Convers. Manag., 2023, 290, 117222 CrossRef
.
- W. Y. Chen, X. L. Shi, J. Zou and Z. G. Chen, Small Methods, 2022, 6, 2101235 CrossRef PubMed
.
- X. Moya, S. Kar-Narayan and N. D. Mathur, Nat. Mater., 2014, 13, 439–450 CrossRef CAS PubMed
.
- P. Lloveras and J.-L. Tamarit, MRS Energy Sustain, 2021, 8, 3–15 Search PubMed
.
- D. Boldrin, Appl. Phys. Lett., 2021, 118, 170502 CrossRef CAS
.
- A. Fallahi, G. Guldentops, M. Tao, S. Granados-Focil and S. Van Dessel, Appl. Therm. Eng., 2017, 127, 1427–1441 CrossRef
.
- C. R. Raj, S. Suresh, R. R. Bhavsar and V. K. Singh, J. Therm. Anal. Calorim., 2020, 139, 3023–3049 CrossRef CAS
.
- L. Mañosa, D. González-Alonso, A. Planes, E. Bonnot, M. Barrio, J. L. Tamarit, S. Aksoy and M. Acet, Nat. Mater., 2010, 9, 478–481 CrossRef PubMed
.
- E. Stern-Taulats, A. Planes, P. Lloveras, M. Barrio, J. L. Tamarit, S. Pramanick, S. Majumdar, S. Yüce, B. Emre, C. Frontera and L. Mañosa, Acta Mater, 2015, 96, 324–332 CrossRef CAS
.
- J. Lin, P. Tong, X. Zhang, Z. Wang, Z. Zhang, B. Li, G. Zhong, J. Chen, Y. Wu, H. Lu, L. He, B. Bai, L. Ling, W. Song, Z. Zhang and Y. Sun, Mater. Horizons, 2020, 7, 2690–2695 RSC
.
- S. Yuce, M. Barrio, B. Emre, E. Stern-Taulats, A. Planes, J. L. Tamarit, Y. Mudryk, K. A. Gschneidner, V. K. Pecharsky and L. Mañosa, Appl. Phys. Lett., 2012, 101, 071906 CrossRef
.
- L. Mañosa, D. González-Alonso, A. Planes, M. Barrio, J. L. Tamarit, I. S. Titov, M. Acet, A. Bhattacharyya and S. Majumdar, Nat. Commun., 2011, 2, 1–5 Search PubMed
.
- L. Mañosa, E. Stern-Taulats, A. Planes, P. Lloveras, M. Barrio, J. L. Tamarit, B. Emre, S. Yüce, S. Fabbrici and F. Albertini, Phys. Status Solidi Basic Res., 2014, 251, 2114–2119 CrossRef
.
- X. J. He, K. Xu, S. X. Wei, Y. L. Zhang, Z. Li and C. Jing, J. Mater. Sci., 2017, 52, 2915–2923 CrossRef CAS
.
- Z. Wei, Y. Shen, Z. Zhang, J. Guo, B. Li, E. Liu, Z. Zhang and J. Liu, APL Mater, 2020, 8, 051101 CrossRef CAS
.
- X. He, S. Wei, Y. Kang, Y. Zhang, Y. Cao, K. Xu, Z. Li and C. Jing, Scr. Mater., 2018, 145, 58–61 CrossRef CAS
.
- X. He, Y. Kang, S. Wei, Y. Zhang, Y. Cao, K. Xu, Z. Li, C. Jing and Z. Li, J. Alloys Compd., 2018, 741, 821–825 CrossRef CAS
.
- P. Lloveras, T. Samanta, M. Barrio, I. Dubenko, N. Ali, J. L. Tamarit and S. Stadler, APL Mater, 2019, 7, 0–9 CAS
.
- A. Aznar, A. Gràcia-Condal, A. Planes, P. Lloveras, M. Barrio, J. L. Tamarit, W. Xiong, D. Cong, C. Popescu and L. Mañosa, Phys. Rev. Mater., 2019, 3, 1–7 Search PubMed
.
- H. Liu, Z. Li, Y. Zhang, Z. Ni, K. Xu and Y. Liu, Scr. Mater., 2020, 177, 1–5 CrossRef CAS
.
- D. Matsunami, A. Fujita, K. Takenaka and M. Kano, Nat. Mater., 2015, 14, 73–78 CrossRef CAS PubMed
.
- R. R. Wu, L. F. Bao, F. X. Hu, H. Wu, Q. Z. Huang, J. Wang, X. L. Dong, G. N. Li, J. R. Sun, F. R. Shen, T. Y. Zhao, X. Q. Zheng, L. C. Wang, Y. Liu, W. L. Zuo, Y. Y. Zhao, M. Zhang, X. C. Wang, C. Q. Jin, G. H. Rao, X. F. Han and B. G. Shen, Sci. Rep., 2015, 5, 1–11 Search PubMed
.
- D. Boldrin, E. Mendive-Tapia, J. Zemen, J. B. Staunton, T. Hansen, A. Aznar, J. L. Tamarit, M. Barrio, P. Lloveras, J. Kim, X. Moya and L. F. Cohen, Phys. Rev. X, 2018, 8, 41035 CAS
.
- A. Aznar, P. Lloveras, J. Y. Kim, E. Stern-Taulats, M. Barrio, J. L. Tamarit, C. F. Sánchez-Valdés, J. L. Sánchez Llamazares, N. D. Mathur and X. Moya, Adv. Mater., 2019, 31, 1–6 CrossRef PubMed
.
- E. Stern-Taulats, A. Planes, P. Lloveras, M. Barrio, J. L. Tamarit, S. Pramanick, S. Majumdar, C. Frontera and L. Mañosa, Phys. Rev. B - Condens. Matter Mater. Phys., 2014, 89, 1–8 CrossRef
.
- C. Yu, J. Huang, J. Qi, P. Liu, D. Li, T. Yang, Z. Zhang and B. Li, APL Mater, 2022, 10, 011109 CrossRef CAS
.
- P. Lloveras, E. Stern-Taulats, M. Barrio, J. L. Tamarit, S. Crossley, W. Li, V. Pomjakushin, A. Planes, L. Mañosa, N. D. Mathur and X. Moya, Nat. Commun., 2015, 6, 8801 CrossRef CAS PubMed
.
- Q. Ren, J. Qi, D. Yu, Z. Zhang, R. Song, W. Song, B. Yuan, T. Wang, W. Ren, Z. Zhang, X. Tong and B. Li, Nat. Commun., 2022, 13, 1–9 Search PubMed
.
- M. V. Gorev, E. V. Bogdanov, I. N. Flerov, A. G. Kocharova and N. M. Laptash, Phys. Solid State, 2010, 52, 167–175 CrossRef CAS
.
- M. V. Gorev, E. V. Bogdanov, I. N. Flerov, V. N. Voronov and N. M. Laptash, Ferroelectrics, 2010, 397, 76–80 CrossRef CAS
.
- I. N. Flerov, A. V. Kartashev, M. V. Gorev, E. V. Bogdanov, S. V. Mel'Nikova, M. S. Molokeev, E. I. Pogoreltsev and N. M. Laptash, J. Fluor. Chem., 2016, 183, 1–9 CrossRef CAS
.
- M. V. Gorev, E. A. Mikhaleva, I. N. Flerov and E. V. Bogdanov, J. Alloys Compd., 2019, 806, 1047–1051 CrossRef CAS
.
- Z. Zhang, X. Jiang, T. Hattori, X. Xu, M. Li, C. Yu, Z. Zhang, D. Yu, R. Mole, S. I. Yano, J. Chen, L. He, C. W. Wang, H. Wang, B. Li and Z. Zhang, Mater. Horizons, 2023, 10, 977–982 RSC
.
- X. Xu, F. Li, C. Niu and H. Wang, Appl. Phys. Lett., 2023, 122, 043901 CrossRef CAS
.
- A. Aznar, P. Lloveras, M. Romanini, M. Barrio, J. L. Tamarit, C. Cazorla, D. Errandonea, N. D. Mathur, A. Planes, X. Moya and L. Mañosa, Nat. Commun., 2017, 8, 1851 CrossRef PubMed
.
- J. Min, A. K. Sagotra and C. Cazorla, Phys. Rev. Mater., 2020, 4, 1–10 Search PubMed
.
- M. Romanini, Y. Wang, G. Kübra, G. Ornelas, P. Lloveras, Y. Zhang, W. Zheng, M. Barrio, A. Aznar, A. Gràcia-Condal, B. Emre, O. Atakol, C. Popescu, H. Zhang, Y. Long, L. Balicas, J. L. Tamarit, A. Planes, M. Shatruk and L. Mañosa, Adv. Mater., 2021, 33, 2008076 CrossRef CAS PubMed
.
- S. P. Vallone, A. N. Tantillo, A. M. dos Santos, J. J. Molaison, R. Kulmaczewski, A. Chapoy, P. Ahmadi, M. A. Halcrow and K. G. Sandeman, Adv. Mater., 2019, 31, 1–7 CrossRef PubMed
.
- P. J. Von Ranke, B. P. Alho, P. H. S. Da Silva, R. M. Ribas, E. P. Nobrega, V. S. R. De Sousa, M. V. Colaço, L. F. Marques, M. S. Reis, F. M. Scaldini, L. B. L. Escobar and P. O. Ribeiro, J. Appl. Phys., 2020, 127, 165104 CrossRef CAS
.
- J. Seo, J. D. Braun, V. M. Dev and J. A. Mason, J. Am. Chem. Soc., 2022, 144, 6493–6503 CrossRef CAS PubMed
.
- P. J. Von Ranke, B. P. Alho, R. M. Ribas, E. P. Nobrega, A. Caldas, V. S. R. De Sousa, M. V. Colaço, L. F. Marques, D. L. Rocco and P. O. Ribeiro, Phys. Rev. B, 2018, 98, 2–6 CrossRef
.
- P. J. von Ranke, B. P. Alho and P. O. Ribeiro, J. Alloys Compd., 2018, 749, 556–560 CrossRef CAS
.
- P. J. von Ranke, B. P. Alho, E. P. Nobrega, A. Caldas, V. S. R. de Sousa, M. V. Colaço, L. F. Marques, G. M. Rocha, D. L. Rocco and P. O. Ribeiro, J. Magn. Magn. Mater., 2019, 489, 165421 CrossRef CAS
.
- C. M. Miliante, A. M. Christmann, R. P. Soares, J. R. Bocca, C. S. Alves, A. M. G. Carvalho and A. R. Muniz, J. Mater. Chem. A, 2022, 10, 8344–8355 RSC
.
- J. M. Bermúdez-García, M. Sánchez-Andújar, S. Castro-García, J. López-Beceiro, R. Artiaga and M. A. Señarís-Rodríguez, Nat. Commun., 2017, 8, 15715 CrossRef PubMed
.
- J. M. Bermúdez-García, S. Yáñez-Vilar, A. García-Fernández, M. Sánchez-Andújar, S. Castro-García, J. López-Beceiro, R. Artiaga, M. Dilshad, X. Moya and M. A. Señarís-Rodríguez, J. Mater. Chem. C, 2018, 6, 9867–9874 RSC
.
- M. Szafrański, W. J. Wei, Z. M. Wang, W. Li and A. Katrusiak, APL Mater, 2018, 6, 100701 CrossRef
.
- J. Salgado-Beceiro, A. Nonato, R. X. Silva, A. García-Fernández, M. Sánchez-Andújar, S. Castro-García, E. Stern-Taulats, M. A. Señarís-Rodríguez, X. Moya and J. M. Bermúdez-García, Mater. Adv., 2020, 1, 3167–3170 RSC
.
- J. Salgado-Beceiro, J. M. Bermúdez-García, E. Stern-Taulats, J. García-Ben, S. Castro-García, M. Sánchez-Andújar, X. Moya and M. A. Señarís-Rodríguez, ChemRxiv, 2021, 17–19 Search PubMed
.
- J. Li, M. Barrio, D. J. Dunstan, R. Dixey, X. Lou, J. L. Tamarit, A. E. Phillips and P. Lloveras, Adv. Funct. Mater., 2021, 31, 1–8 Search PubMed
.
- J. Seo, R. D. McGillicuddy, A. H. Slavney, S. Zhang, R. Ukani, A. A. Yakovenko, S. L. Zheng and J. A. Mason, Nat. Commun., 2022, 13, 1–15 Search PubMed
.
- Y. Gao, H. Liu, F. Hu, H. Song, H. Zhang, J. Hao, X. Liu, Z. Yu, F. Shen, Y. Wang, H. Zhou, B. Wang, Z. Tian, Y. Lin, C. Zhang, Z. Yin, J. Wang, Y. Chen, Y. Li, Y. Song, Y. Shi, T. Zhao, J. Sun, Q. Huang and B. Shen, NPG Asia Mater, 2022, 14, 34 CrossRef CAS
.
- P. Lloveras, A. Aznar, M. Barrio, P. Negrier, C. Popescu, A. Planes, L. Mañosa, E. Stern-Taulats, A. Avramenko, N. D. Mathur, X. Moya and J. L. Tamarit, Nat. Commun., 2019, 10, 1–7 CrossRef CAS PubMed
.
- A. Aznar, P. Lloveras, M. M. Barrio, P. Negrier, A. Planes, L. L. Mañosa, N. D. Mathur, X. Moya and J. L. L. Tamarit, J. Mater. Chem. A, 2020, 8, 639–647 RSC
.
- J. Li, D. Dunstan, X. Lou, A. Planes, L. Mañosa, M. Barrio, J. L. Tamarit and P. Lloveras, J. Mater. Chem. A, 2020, 8, 20354–20362 RSC
.
- A. Aznar, P. Negrier, A. Planes, L. Mañosa, E. Stern-Taulats, X. Moya, M. Barrio, J. L. Tamarit and P. Lloveras, Appl. Mater. Today, 2021, 23, 101023 CrossRef
.
- A. Salvatori, P. Negrier, A. Aznar, M. Barrio, J. L. Tamarit and P. Lloveras, APL Mater., 2022, 10, 111117 CrossRef CAS
.
- K. Zhang, R. Song, J. Qi, Z. Zhang, Z. Zhang, C. Yu, K. Li, Z. Zhang and B. Li, Adv. Funct. Mater., 2022, 32, 2112622 CrossRef CAS
.
- F. B. Li, M. Li, X. Xu, Z. C. Yang, H. Xu, C. K. Jia, K. Li, J. He, B. Li and H. Wang, Nat. Commun., 2020, 11, 1–8 CrossRef PubMed
.
- F. Li, C. Niu, X. Xu, M. Li and H. Wang, Appl. Phys. Lett., 2022, 121, 223902 CrossRef CAS
.
- W. Imamura, É. O. Usuda, L. S. Paixão, N. M. Bom, A. M. Gomes and A. M. G. Carvalho, Chin. J. Polym. Sci., 2020, 38, 999–1005 CrossRef CAS
.
- S. Patel, A. Chauhan, R. Vaish and P. Thomas, Appl. Phys. Lett., 2016, 108, 072903 CrossRef
.
- A. M. G. Carvalho, W. Imamura, E. O. Usuda and N. M. Bom, Eur. Polym. J., 2018, 99, 212–221 CrossRef CAS
.
- J. García-Ben, J. López-Beceiro, R. Artiaga, J. Salgado-Beceiro, I. Delgado-Ferreiro, Y. V. Kolen’ko, S. Castro-García, M. A. Señarís-Rodríguez, M. Sánchez-Andújar and J. M. Bermúdez-García, Chem. Mater., 2022, 34, 3323–3332 CrossRef PubMed
.
- J. Font, J. Muntasell, J. Navarro, J.-L. Tamarit and J. Lloveras, Sol. Energy Mater., 1987, 15, 299–310 CrossRef CAS
.
- M. Barrio, J. Font, J. Muntasell, J. Navarro and J. L. Tamarit, Sol. Energy Mater., 1988, 18, 109–115 CrossRef CAS
.
- B. Li, Y. Kawakita, S. Ohira-Kawamura, T. Sugahara, H. Wang, J. Wang, Y. Chen, S. I. Kawaguchi, S. Kawaguchi, K. Ohara, K. Li, D. Yu, R. Mole, T. Hattori, T. Kikuchi, S. ichiro Yano, Z. Zhang, Z. Zhang, W. Ren, S. Lin, O. Sakata, K. Nakajima and Z. Zhang, Nature, 2019, 567, 506–510 CrossRef CAS PubMed
.
- M. Masche, L. Ianniciello, J. Tušek and K. Engelbrecht, Int. J. Refrig., 2021, 121, 302–312 CrossRef
.
- T. Hess, L. M. Maier, N. Bachmann, P. Corhan, O. Schäfer-Welsen, J. Wöllenstein and K. Bartholomé, J. Appl. Phys., 2020, 127, 075103 CrossRef CAS
.
- S. K. Mohamed and D. K. Padma, Indian J. Chem. A Inorganic, Phys. Theor. Anal. Chem., 1988, 27, 759–763 Search PubMed
.
- G. Zabinska, P. Ferloni and M. Sanesi, Thermochim. Acta, 1988, 137, 39–49 CrossRef CAS
.
- A. Bielecki and D. P. Burum, J. Magn. Reson. Ser. A, 1995, 116, 215–220 CrossRef CAS
.
- G. Ferrer, C. Barreneche, A. Solé, I. Martorell and L. F. Cabeza, J. Energy Storage, 2017, 11, 1–6 CrossRef
.
-
ASTM E1269-11, Standard Test Method for Determining Specific Heat Capacity by Differential Scanning Calorimetry, 2018 Search PubMed
.
- B. H. Toby and R. B. Von Dreele, J. Appl. Crystallogr., 2013, 46, 544–549 CrossRef CAS
.
- G. M. Sheldrick, Acta Crystallogr. Sect. A Found. Crystallogr., 2015, 71, 3–8 CrossRef PubMed
.
- G. M. Sheldrick, Acta Crystallogr. Sect. C Struct. Chem., 2015, 71, 3–8 CrossRef PubMed
.
- S. D. Sharma and K. Sagara, Int. J. Green Energy, 2005, 2, 1–56 CrossRef CAS
.
- M. V. Gorev, E. V. Bogdanov and I. N. Flerov, J. Phys. D. Appl. Phys., 2017, 50, 384002 CrossRef
.
- X. Moya and N. D. Mathur, Science, 2020, 803, 797–803 CrossRef PubMed
.
- J. Lin, P. Tong, K. Zhang, K. Tao, W. Lu, X. Wang, X. Zhang, W. Song and Y. Sun, Nat. Commun., 2022, 13, 596 CrossRef CAS PubMed
.
- L. Ricard, R. Cavagnat and M. Rey-Lafon, J. Phys. Chem., 1985, 89, 4887–4894 CrossRef CAS
.
- Y. Abid, M. Kamoun, A. Daoud and F. Romain, J. Raman Spectrosc., 1990, 21, 709–716 CrossRef CAS
.
Footnotes |
| † Electronic supplementary information (ESI) available: [CCDC 2213758 and CCDC 2213757 contain the supplementary crystallographic data for this paper. These data can be obtained free of charge from The Cambridge Crystallographic Data Centre viahttp://www.ccdc.cam.ac.uk/data_request/cif]. For ESI and crystallographic data in CIF or other electronic format see DOI: https://doi.org/10.1039/d3ta04063a |
| ‡ These authors have equally contributed to this work. |
| This journal is © The Royal Society of Chemistry 2023 |

