Two-phase matrices for the controlled release of therapeutic proteins
Mariya
David
ab,
Avha R.
Mohanty
ab and
Nicholas A.
Peppas
 *abcde
aMcKetta Department of Chemical Engineering, The University of Texas at Austin, Austin, TX, USA. E-mail: peppas@che.utexas.edu
bInstitute of Biomaterials, Drug Delivery, and Regenerative Medicine, The University of Texas at Austin, Austin, TX, USA
cDepartment of Biomedical Engineering, The University of Texas at Austin, Austin, TX, USA
dDepartment of Pediatrics and Department of Surgery and Perioperative Care, Dell Medical School, The University of Texas at Austin, Austin, TX, USA
eDivision of Molecular Pharmaceutics and Drug Delivery, College of Pharmacy, The University of Texas at Austin, Austin, TX, USA
First published on 29th August 2023
Abstract
Controlled and sustained delivery of therapeutic proteins is crucial for achieving desired effects in wound healing applications. Yet, this remains a challenge in growth factor delivery for bone tissue engineering. Current delivery systems can lead to negative side effects, such as ectopic bone growth and cancer, due to the over administration of growth inducing proteins. Here, we have developed a two-phase system for the controlled release of therapeutic proteins. The system consists of protein-loaded poly(methacrylic acid)-based nanoparticles conjugated to chitosan scaffolds. The effect of co-monomer hydrophilicity and crosslinking density on nanoparticle properties was evaluated. It was found that the release kinetics of model therapeutic proteins were dependent on nanoparticle hydrophilicity. The chitosan scaffold, chosen for its biocompatibility and osteogenic properties, provided additional barriers to diffusion and promoted nanoparticle retention, leading to more sustained protein delivery. Additionally, the ability of MC3T3-E1 pre-osteoblast cells to proliferate on scaffolds with and without conjugated nanoparticles was evaluated and all scaffolds were shown to promote cell growth. The results demonstrate that the two-phase scaffold system presents a superior strategy for the sustained and controlled release of therapeutic proteins for bone tissue engineering applications.
Introduction
Sustained drug delivery over long periods of time is often necessary to achieve desired therapeutic effects, as sustained delivery more closely maintains drug concentration at therapeutic levels than bolus injections.1 For example, in healing of non-union fractures in orthopedics, sustained delivery of bone morphogenetic protein-2 (BMP-2) is needed to achieve complete fracture healing.During the natural bone healing process, BMP-2 is expressed during the first 21 days of fracture healing, suggesting that long term delivery is needed to simulate endogenous repair mechanisms.2 However, due to the short half-life of BMP-2, therapeutic levels of BMP-2 are often achieved through delivery of high doses. These doses are one million times higher than the physiological concentrations, resulting in many negative side effects, such as ectopic bone growth and cancer.3 Indeed, previous studies have shown that long-term delivery of BMP-2 enhances in vivo bone formation compared to short-term delivery of the same dose.4 Thus, to avoid delivery of high doses and enhance bone formation, a system that exhibits sustained release over a long period of time is ideal.
In addition, delivery of single therapeutic agents is insufficient for the treatment of many diseases due to the complexity of natural healing processes. Many biological processes, such as bone repair, are complex, highly coordinated processes that require precise spatiotemporal control.5,6 Thus, there is a need to design a system that can deliver multiple factors over different timescales to more closely mimic the spatiotemporal nature of biological processes. Encapsulation of therapeutic agents within micro- or nano-carriers is a promising strategy for drug delivery that can provide greater control over release kinetics by varying parameters such as particle size, crosslinking ratio, and hydrophilicity, as well as protecting the cargo from enzymatic degradation.7–9 However, due to their small size, nanoparticles are limited by rapid clearance from the target site. To this end, nanoparticles have been combined with hydrogels, which are an attractive choice for use in drug delivery and regenerative medicine due to their ability to provide biocompatible substrates for cell attachment, to form nanocomposite systems.10–13 Many of such systems are formed by simply mixing the nanoparticles within the polymeric matrix or crosslinking hydrogels in the presence of nanoparticles.14–16 As a result, there is a lack of control over the location of the nanoparticles within the outer matrix, as well as the resulting release of encapsulated agents.
Chitosan is a polycationic biopolymer that is derived from the deacetylation of chitin, a main component of crustacean exoskeletons.17 Chitosan is of great interest for biomedical and tissue engineering applications due to its excellent biocompatibility18 and enzymatic biodegradability.19 The presence of reactive amino and carboxyl groups is another attractive feature as it allows for chemical modifications of chitosan to achieve desired functionalities.20 Chitosan is also widely used for tissue engineering applications due to its ability to promote osteoblast differentiation and wound healing.21
Here, we develop and evaluate a two-phase system for sustained delivery of model therapeutic proteins. We propose that conjugation of nanoparticles to an outer scaffold will prolong protein delivery when compared to a one phase system by promoting nanoparticle retention and providing several barriers to diffusion to slow the protein release. Poly(methacrylic acid)-based nanoparticles are conjugated to a chitosan scaffold through carbodiimide chemistry. The effect of nanoparticle composition and crosslinking density is evaluated on the rate of protein release.
Experimental
Materials
Chitosan, methyl methacrylate, methacrylic acid, 2-hydroxyethyl methacrylate, tetraethylene glycol dimethacrylate, N,N,N′,N′-tetramethyl ethylenediamine, ammonium persulfate, N-(3-dimethylaminopropyl)-N′-ethyl carbodiimide hydrochloride (EDC), and N-hydroxysulfo succinimide sodium salt (sulfo-NHS) were purchased from Sigma-Aldrich. Brij30, sodium dodecyl sulfate, fluorescein isothiocyanate (FITC) antibody labeling kit, and tetramethylrhodamine cadaverine were purchased from Thermo Fisher. 2-Hydroxy-1-[4-(2-hydroxyehtoxy)phenyl]-2-methyl-1-propanone) was purchased from Ciba. Dioctyl sulfosuccinate was purchased from Acros Organics. All reagents were used as received.Chitosan scaffold synthesis
Chitosan scaffolds were synthesized using a lyophilization method. Briefly, chitosan (MW 310–375 kDa, >75% deacetylated) was dissolved in acetic acid at 2 or 4 wt%. After complete dissolution, 1.5 mL of chitosan solution was placed in each well of a 24-well plate and 1 mL of 1 M sodium carbonate solution was added to neutralize the acetate functional groups and allow the solution to gel. After 1 hour, the sodium carbonate solution was removed and the plate was placed in a −80 °C freezer overnight. Finally, the scaffolds were lyophilized for 24 hours to form an interconnected porosity.Scanning electron microscopy (SEM)
Scanning electron microscopy (SEM) was used to evaluate scaffold porosity and structural morphology. Lyophilized scaffolds were cut in half and mounted on 12 mm aluminum mounts and sputter coated with platinum/palladium. SEM images of scaffold cross-sections were obtained using a Zeiss Supra 40VP SEM.UV-initiated emulsion polymerization for preparation of P(MMA-co-MAA) nanoparticles
Poly(methyl methacrylate-co-methacrylic acid) (P(MMA-co-MAA)) nanoparticles were synthesized using UV-initiated free radical emulsion polymerization.22 In a typical experiment, methyl methacrylate (MMA) was added at 75 mol percent while methacrylic acid (MAA) was added at 24 or 20 mol percent into an amber vial. Tetraethylene glycol dimethacrylate (TEGDMA) was added at either 1 or 5 mol percent relative to total monomer content. Surfactant Brij30 was added at 4 mg mL−1 and sodium dodecyl sulfate was added at 1.15 mg mL−1. 2-Hydroxy-1-[4-(2-hydroxyehtoxy)phenyl]-2-methyl-1-propanone) (Irgacure 2959) was added as a photoinitiator at 0.5 weight percent of all other components. DI water was added to create a 50 mL aqueous solution. The mixture was sonicated for 10 minutes to form a homogenous emulsion and then transferred to a round bottom flask where it was nitrogen purged for 20 minutes under constant stirring to remove free radical scavengers. The solution was then reacted under UV light at 150 mW cm−2 for 2.5 hours. After polymerization, the nanoparticles were purified by ionomer collapse. Briefly, 5 mL of 3N NaOH was added to the solution and the nanoparticles were collapsed in acetone and centrifuged at 3500 × g for 5 min. The supernatant was discarded and the pellet was resuspended in 0.5 N NaOH. After three rounds of purification, the particles were dialyzed against DI water for 7 days.Inverse emulsion polymerization for preparation of P(HEMA-co-MAA) nanoparticles
Poly(2-hydroxyethyl methacrylate-co-methacrylic acid) (P(HEMA-co-MAA)) particles were synthesized using inverse emulsion polymerization.23 To form the aqueous phase, 2-hydroxyethyl methacrylate (HEMA) was added at 75 mol percent, MAA was added at 24 or 20 mol percent, TEGDMA was added at 1 or 5 mol percent, N,N,N′,N′-tetramethyl ethylenediamine, and DI water were combined. The aqueous phase was sonicated in a bath sonicator for 10 minutes. To form the oil phase, surfactants Brij30 and dioctyl sulfosuccinate (AOT) were combined in a 5![[thin space (1/6-em)]](https://www.rsc.org/images/entities/char_2009.gif) :
:![[thin space (1/6-em)]](https://www.rsc.org/images/entities/char_2009.gif) 1 molar ratio and dissolved in 50 mL of hexanes.
1 molar ratio and dissolved in 50 mL of hexanes.
Once the organic phase was completely dissolved, the aqueous phase was added, and the solution was nitrogen purged under constant stirring at 500 rpm for 20 minutes. 100 μL of a 100 mg mL−1 solution of ammonium persulfate (APS) was injected into the solution to initiate the reaction and the solution was nitrogen purged for an additional 10 minutes. The reaction was allowed to proceed for 24 hours at room temperature. After polymerization, the nanoparticles were precipitated in acetone and separated by centrifugation at 3500 × g for 5 minutes. The particles were suspended in DI water and dialyzed against DI water for 7 days.
Dynamic light scattering and zeta potential studies
Dynamic light scattering was used to determine nanoparticle z-average diameter using a Zetasizer Nano ZS system (Malvern Instrument, Inc). Nanoparticles were suspended in 1× PBS at pH 7.4 for size measurements and 5 mM sodium phosphate solution at pH 7.4 for zeta potential measurements. All measurements were taken at 25 °C.Protein loading into nanoparticles
α-Chymotrypsin was labeled with fluorescein isothiocyanate (FITC) for loading and release experiments using a Pierce FITC antibody labeling kit following manufacturer's instructions.To load protein into nanoparticles, a 2 mg mL−1 nanoparticle suspension was prepared in 0.1× PBS. FITC-labeled α-chymotrypsin was dissolved in 0.1× PBS at 2 mg mL−1 and added to the nanoparticles to create a 2.5 weight percent protein: particle ratio. The protein and particles were incubated at room temperature for one hour to allow for equilibrium partitioning of the protein into the nanoparticles.
Following the incubation period, 10 μL of 1 N HCl was added to the solution to collapse the nanoparticles and entrap the loaded protein. The solution was centrifuged at 10![[thin space (1/6-em)]](https://www.rsc.org/images/entities/char_2009.gif) 000 × g to isolate the nanoparticles and entrapped protein from the unloaded protein. The pellet was re-suspended in 0.1× PBS and centrifuged two more times to remove any surface bound protein. The supernatant was collected and protein concentration was determined using fluorescence at 495/517 nm excitation/emission relative to a standard curve of known concentrations. The collapsed nanoparticles were lyophilized and stored at −20 °C until the conjugation reaction was performed. Loading efficiency was calculated using the formula:
000 × g to isolate the nanoparticles and entrapped protein from the unloaded protein. The pellet was re-suspended in 0.1× PBS and centrifuged two more times to remove any surface bound protein. The supernatant was collected and protein concentration was determined using fluorescence at 495/517 nm excitation/emission relative to a standard curve of known concentrations. The collapsed nanoparticles were lyophilized and stored at −20 °C until the conjugation reaction was performed. Loading efficiency was calculated using the formula:
 | (1) |
Protein release studies
Protein release studies were performed for three systems: (1) release from nanoparticles only, (2) release from scaffold materials only, and (3) release from scaffold materials containing conjugated nanoparticles. For system 2, scaffolds were dried overnight and then injected with 100 μL of a 0.5 mg mL−1 protein solution. For system 3, protein-loaded nanoparticles were conjugated to scaffolds using carbodiimide chemistry as follows.Nanoparticles were suspended at 5 mg mL−1 in 50 mM MES buffer at pH 5.5. EDC and sulfo-NHS were added at a 2-fold molar excess, such that 20 percent of carboxylic acid groups of the nanoparticles are activated. The solution was allowed to stir for 15 minutes to activate the carboxylate groups on the nanoparticles. After 15 minutes, the nanoparticles were centrifuged at 10000 × g for 5 minutes to separate the activated nanoparticles from excess EDC. After centrifugation, the nanoparticles were re-suspended in 1× PBS at pH 7.2–7.4 and injected into scaffolds maintained in 5× PBS. The scaffolds were allowed to stir for 30 minutes after which they were removed from the reaction buffer and washed three times with DI water. After conjugation, scaffolds were washed with DI water and lyophilized until release studies were performed.
For release studies, scaffolds were maintained in a 1× PBS solution at pH 7.4 and 37 °C. At selected timepoints, the supernatant was collected and replaced with fresh 1× PBS solution. The supernatant was analyzed for protein concentration using fluorescence relative to a standard curve.
MC3T3-E1 cell proliferation
The ability of MC3T3-E1 pre-osteoblast cells (American Type Culture Collection, subclone 4) to proliferate on scaffolds with and without conjugated nanoparticles was evaluated. Lyophilized scaffolds were sterilized under UV light and placed in 24 well plates. Scaffolds were soaked in 1 mL cell media for 24 hours before seeding and media was removed prior to seeding. MC3T3-E1 cells were suspended in cell media at 125![[thin space (1/6-em)]](https://www.rsc.org/images/entities/char_2009.gif) 000 cells per mL and 200 μL of the cell suspension was added to the top of the scaffolds. The scaffolds were incubated for 4 hours to allow for cell adhesion, after which, scaffolds were transferred to new wells, washed with DPBS to remove unattached cells, and placed 1 mL culture media.
000 cells per mL and 200 μL of the cell suspension was added to the top of the scaffolds. The scaffolds were incubated for 4 hours to allow for cell adhesion, after which, scaffolds were transferred to new wells, washed with DPBS to remove unattached cells, and placed 1 mL culture media.
MC3T3-E1 cells were allowed to proliferate on scaffolds for up to 14 days and cell number was quantified using an MTS assay. Cells were maintained in 1 mL culture media in 24 well plates. At predetermined time points, culture media was removed and cell-seeded scaffolds were washed with DPBS. Scaffolds were added to 1 mL of assay media containing 2% FBS and no phenol red and 200 μL MTS reagent and incubated for 2 hours. The solution was then transferred to 96 well plates and absorbance at 490 nm was obtained. The number of viable cells was determined using a standard curve.
Results and discussion
Chitosan scaffold synthesis and characterization
Chitosan scaffolds were synthesized using a phase separation and lyophilization technique.24 Freezing the scaffold results in the formation of ice crystals which are phase separated from the chitosan acetate salt. During lyophilization, the ice crystals sublimate, resulting in a porous chitosan structure. This porous structure allows for proper nutrient flow, cell growth, and vascularization, which are vital components of scaffolds used in tissue engineering applications.25SEM images of scaffolds synthesized from 2 and 4 wt% chitosan solutions are shown in Fig. 1. The images show a highly porous structure within the scaffold bulk with smaller pore sizes in the 4 wt% chitosan scaffold. 2 wt% scaffolds contained large pores of approximately 400 μm in size, whereas 4 wt% scaffolds contained smaller pores in the 100–200 μm size range.
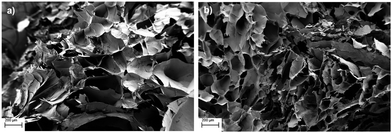 | ||
| Fig. 1 SEM images of (a) 2 wt% and (b) 4 wt% chitosan scaffolds. 50× magnification, scale bars 200 μm. | ||
Nanoparticle characterization
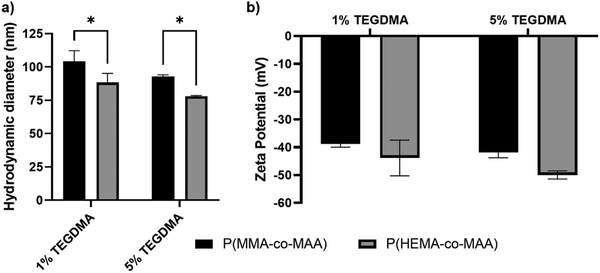
Hydrodynamic diameter and zeta potential values of synthesized P(MMA-co-MAA) and P(HEMA-co-MAA) nanoparticles are shown in Fig. 2. All formulations exhibited a negative zeta potential of around −40 mV with no significant difference between formulations of differing crosslinking densities or composition. P(HEMA-co-MAA) particles were significantly smaller than P(MMA-co-MAA) particles, which is likely due to a lower incorporation of MAA, resulting in decreased swelling. P(MMA-co-MAA) nanoparticles had sizes between 90 and 110 nm at pH 7.4. Nanoparticles crosslinked with 1 mol% TEGDMA had sizes of around 105 nm, whereas nanoparticles crosslinked with 5 mol% TEGDMA had slightly smaller sizes of around 90 nm. P(HEMA-co-MAA) nanoparticles had sizes between 75 and 100 nm, with particles crosslinked with 5 mol% TEGDMA exhibiting a smaller size than particles crosslinked with 1 mol% TEGDMA.Protein loading and release from nanoparticles
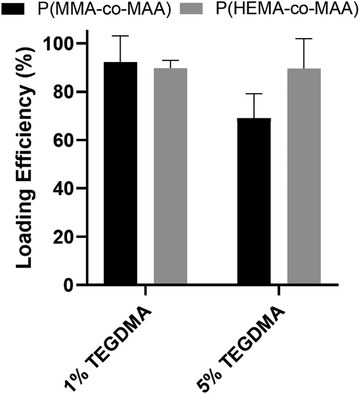
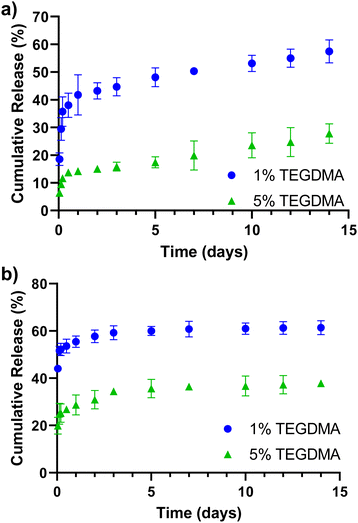
Release studies of a model therapeutic protein were performed, and their results are summarized below. α-Chymotrypsin was used as a model protein as its molecular weight and isoelectric point are similar to that of BMP-2 (25 kDa and 8.5, respectively). Fig. 3 shows the loading efficiencies of FITC-labeled α-chymotrypsin into P(MMA-co-MAA) and P(HEMA-co-MAA) nanoparticles. For P(MMA-co-MAA) nanoparticles, protein loading efficiency decreased with increasing crosslinking densities in the feed. P(MMA-co-MAA) nanoparticles crosslinked with 1 mol% TEGDMA demonstrated loading capacities over 80% whereas nanoparticles crosslinked with 5% TEGDMA showed lower loading efficiencies of around 65%. This can be attributed to the increase in swelling of less crosslinked systems. P(HEMA-co-MAA) loaded α-chymotrypsin at higher efficiencies compared to P(MMA-co-MAA) nanoparticles, despite decreased swelling, which can be attributed to the increased hydrophilicity of the P(HEMA-co-MAA) particles.Release profiles of α-chymotrypsin from P(MMA-co-MAA) nanoparticles with varying nominal crosslinking densities in the feed over 14 days are shown in Fig. 4a. Release rates were calculated for three time periods and results are shown in Table 1. Expected behavior is observed with less crosslinked particles releasing a higher percentage of entrapped protein. All particles exhibit a burst release for the first 5 hours, with the highest rate of release during this time. After 5 hours, the rate of release slowed, but continued over 14 days, at which point approximately 60% of the entrapped protein was released. Nanoparticles crosslinked with 5% TEGDMA exhibited much less release overall, with just over 10% of entrapped protein released in the first 5 hours and about 20% released over 14 days.
| Nanoparticle | 1–5 hours (μg h−1) | 5–24 hours (μg h−1) | 1–14 days (μg day−1) |
|---|---|---|---|
| P(MMA-co-MAA), 1% TEGDMA | 7.3 | 0.3 | 1.2 |
| P(MMA-co-MAA), 5% TEGDMA | 2.0 | 0.1 | 0.9 |
| P(HEMA-co-MAA), 1% TEGDMA | 11.2 | 0.2 | 0.5 |
| P(HEMA-co-MAA), 5% TEGDMA | 5.0 | 0.2 | 0.7 |
Release profiles of α-chymotrypsin from P(HEMA-co-MAA) nanoparticles crosslinked with varying nominal crosslinking densities in the feed over 14 days are shown in Fig. 4b and the calculated release rates are shown in Table 1. As with P(MMA-co-MAA) particles, less crosslinked particles released a higher percentage of entrapped protein. Nanoparticles crosslinked with 1% TEGDMA released over 50% of the entrapped protein in the first 5 hours and released up to 60% of entrapped protein in 14 days. Nanoparticles crosslinked with 5% TEGDMA released about 25% of entrapped protein in the first 5 hours and over 35% in 7 days. When comparing release rates, protein was released from P(HEMA-co-MAA) particles at a much faster rate in the first 5 hours compared to P(MMA-co-MAA) particles, which is likely due to the increased hydrophilicity of the P(HEMA-co-MAA) particles. However, protein release was faster from P(MMA-co-MAA) nanoparticles at later timepoints. This is likely due to increased polymer–protein interaction with the hydrophobic P(MMA-co-MAA) nanoparticles, resulting in a slower, more sustained release. The protein remaining in the particles at the end of the release studies may be attributed to electrostatic attractions between the positively charged protein and negatively charged nanoparticles.
Protein release from scaffolds
Protein release profiles were obtained for protein loaded directly into scaffolds and protein loaded into nanoparticles, conjugated to the scaffolds. Release of protein from 2 and 4 wt% scaffolds is shown in Fig. 5. Similar to previously described systems, direct loading into scaffolds resulted in an initial burst release.26,27 A burst release is observed in the first 24 hours for both scaffolds. A lower percentage of incorporated protein was released from 4 wt% scaffolds, likely due to the smaller pore sizes of these scaffolds.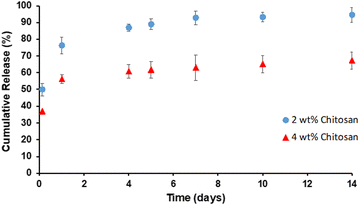 | ||
| Fig. 5 α-Chymotrypsin release from 2 and 4 wt% chitosan scaffolds in 1× PBS at 37 °C, pH 7.4. Data shown are mean ± SD (n = 3). | ||
Protein release from two-phase scaffolds
To confirm successful nanoparticle conjugation to chitosan scaffolds, SEM images of scaffold cross-sections were obtained. SEM images, shown in Fig. 6, confirm that nanoparticles are bound to the scaffold surface throughout the bulk of the scaffold. Cumulative release profiles of FITC-labeled α-chymotrypsin from scaffolds conjugated with P(MMA-co-MAA) and P(HEMA-co-MAA) nanoparticles nominally crosslinked with 1 and 5 mol% TEGDMA were obtained. Scaffolds were incubated in 1× PBS at pH 7.4 with sink conditions (all supernatant was removed at time points and replaced with fresh 1× PBS).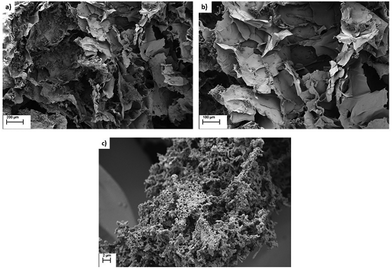 | ||
| Fig. 6 SEM images of scaffolds with conjugated P(MMA-co-MAA) nanoparticles taken at (a) 50× (b) 100× and (c) 2240× magnification. | ||
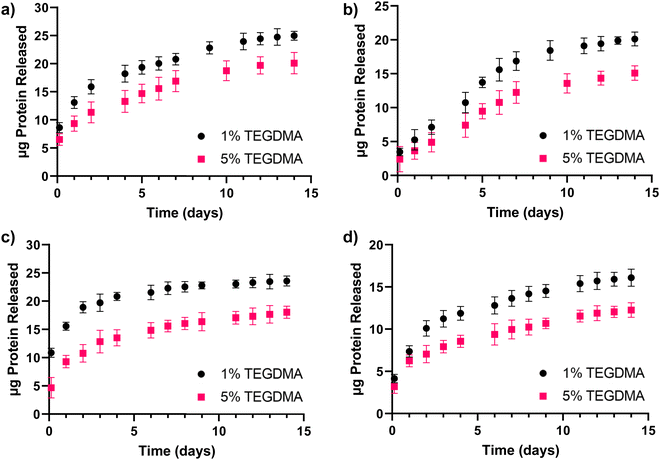
Fig. 7a and b show release of FITC-labeled α-chymotrypsin from scaffolds containing P(MMA-co-MAA) nanoparticles nominally crosslinked with 1 and 5 mol% TEGDMA. A constant first-order release is observed for the first seven days, followed by a plateau after about 14 days. Fig. 7c and d shows release of FITC labeled-α-chymotrypsin from scaffolds containing P(HEMA-co-MAA) nanoparticles nominally crosslinked with 1 and 5 mol% TEGDMA. To compare release from all three systems, release rates were calculated and are shown in Table 2.
| Bound Nanoparticle | α-Chymotrypsin release rate (μg day−1) | |||||
|---|---|---|---|---|---|---|
| 2 wt% | 4 wt% | |||||
| First 24 hours | Day 1–7 | Day 7–14 | First 24 hours | Day 1–7 | Day 7–14 | |
| P(MMA-co-MAA), 1% TEGDMA | 13.1 | 1.3 | 1.2 | 5.3 | 1.9 | 0.5 |
| P(MMA-co-MAA), 5% TEGDMA | 9.3 | 1.3 | 0.5 | 3.6 | 1.4 | 0.4 |
| P(HEMA-co-MAA), 1% TEGDMA | 15.6 | 1.1 | 0.4 | 7.4 | 1.1 | 0.4 |
| P(HEMA-co-MAA), 5% TEGDMA | 9.2 | 1.1 | 0.4 | 6.3 | 0.6 | 0.3 |
In general, release rates were higher from 2 wt% chitosan scaffolds compared to 4 wt% scaffolds, which is due to the increased pore size of 2 wt% scaffolds. The release rate for the first 24 hours was higher from 2 and 4 wt% scaffolds with bound P(HEMA-co-MAA) nanoparticles. However, release rates from days 1–7 and 7–14 were higher in scaffolds with bound P(MMA-co-MAA) nanoparticles. This can be explained by considering release profiles from nanoparticles alone. P(HEMA-co-MAA) nanoparticles demonstrated a higher burst release due to the increased hydrophilicity, which explains the increased release rates in the first 24 hours when bound to the scaffold. Release of α-chymotrypsin from P(MMA-co-MAA) nanoparticles was more sustained over 14 days, which is consistent with what is observed from the scaffold. When considering the weight of protein released, P(MMA-co-MAA) released more protein over 14 days. This is due to a higher loss of protein during the conjugation reaction for P(HEMA-co-MAA) nanoparticles.
During fracture repair in vivo, BMP-2 is expressed throughout the 21 day process, thus a delivery system with sustained release over this time period would be ideal to mimic the natural healing process. However, bone healing is a complex process that is regulated by the expression of multiple growth factors in a time and concentration dependent manner. For example, platelet-derived growth factor (PDGF) is expressed during early stages, primarily the first 3 days, and fibroblast growth factor-2 (FGF-2) has the highest expression in the first 9 days of bone healing.2,28 Thus, a delivery system that can achieve a variety of release rates would more closely mimic the natural bone healing process.
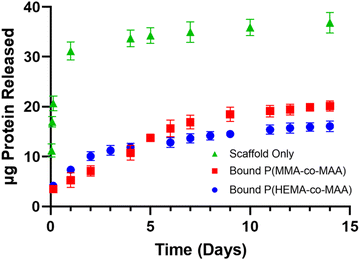
Fig. 8 shows combined release profiles of α-chymotrypsin from 4 wt% scaffolds with and without bound P(MMA-co-MAA) and P(HEMA-co-MAA) nanoparticles. There is a reduction in burst release from bound particles compared to release from the scaffold alone. In addition, nanoparticle hydrophobicity impacts the release profiles, with more sustained release observed from bound P(MMA-co-MAA) nanoparticles over the first seven days. The ability to control release rate through nanoparticle properties shows promise towards the development of a multifactorial release system that mimics the expression of growth factors in wound healing processes.
Cell proliferation on scaffolds
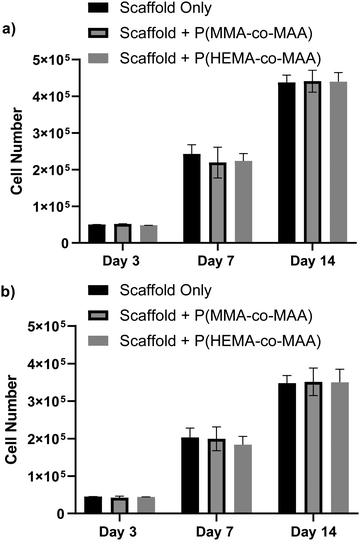
Cell proliferation was evaluated on scaffolds with and without conjugated nanoparticles using the MC3T3-E1 pre-osteoblast cell line. Scaffolds were conjugated with 1 mg of P(MMA-co-MAA) or P(HEMA-co-MAA) nanoparticles. Cells were seeded on the scaffolds with and without conjugated nanoparticles and allowed to proliferate for 14 days. Fig. 9 shows cell proliferation on 2 and 4 wt% chitosan scaffolds quantified by an MTS assay, which is proportional to the number of metabolically active cells. Cells proliferated on all scaffolds, and the presence of conjugated nanoparticles did not significantly affect cell proliferation. Cell number was generally lower on 4 wt% scaffold, which is attributed to the smaller pore size. This is consistent with previous findings that have shown that cell number increases with mean scaffold pore size, especially with pore sizes above 300 μm, due to increased levels of cellular infiltration and nutrient exchange.29 Scaffolds for tissue engineering are designed to mimic the native extracellular matrix, which provides physiochemical cues for cell growth and differentiation in vivo, and must therefore be able to promote cell adhesion, proliferation, and differentiation.30 These results demonstrate that the developed scaffolds are capable of promoting pre-osteoblast growth and proliferation, showing promise for their use as substrates for bone tissue formation.Conclusions
Porous, biodegradable chitosan scaffolds were synthesized and evaluated for protein release. Methacrylic acid-based nanoparticles were successfully bound to the scaffolds using carbodiimide chemistry. It was demonstrated that the two-phase system resulted in more sustained protein release with a decreased burst release compared to release from the scaffold alone. Furthermore, it was shown that distinct release profiles were observed based on the composition and nominal crosslinking density of nanoparticles attached to the scaffold. Chitosan scaffolds with and without nanoparticles promoted proliferation of pre-osteoblast MC3T3-E1 cells. It was found that scaffolds with larger pores resulted in increased cell proliferation and that the conjugation of nanoparticles does not impact cell growth on scaffolds. These results are highly influential for drug delivery and tissue engineering applications, as they demonstrate the ability to control release rate of therapeutic agents by tuning nanoparticle properties within the two-phase system.Conflicts of interest
The authors report there are no competing interests to declare.Acknowledgements
M.D. was supported by the National Science Foundation Graduate Research Fellowship Program (DGE-1610403 and DGE-2137420). N.A.P was supported by the Office of the Dean of the Cockrell School of Engineering at The University of Texas at Austin for the Institute for Biomaterials, Drug Delivery, and Regenerative Medicine and the UT-Portugal Collaborative Research Program.References
- S. D. Putney and P. A. Burke, Nat. Biotechnol., 1998, 16, 153–157 CrossRef CAS PubMed.
- R. Dimitriou, E. Tsiridis and P. V. Giannoudis, Injury, 2005, 36, 1392–1404 CrossRef PubMed.
- H. Seeherman and J. M. Wozney, Cytokine Growth Factor Rev., 2005, 16, 329–345 CrossRef CAS PubMed.
- O. Jeon, S. J. Song, H. S. Yang, S. H. Bhang, S. W. Kang, M. A. Sung, J. H. Lee and B. S. Kim, Biochem. Biophys. Res. Commun., 2008, 369, 774–780 CrossRef CAS PubMed.
- S. M. Bittner, J. L. Guo and A. G. Mikos, Bioprinting, 2018, 12, e00032 CrossRef PubMed.
- L. Cao and D. J. Mooney, Adv. Drug Delivery Rev., 2007, 59, 1340–1350 CrossRef CAS PubMed.
- D. S. Spencer, A. S. Puranik and N. A. Peppas, Curr. Opin. Chem. Eng., 2015, 7, 84–92 CrossRef PubMed.
- M. J. Mitchell, M. M. Billingsley, R. M. Haley, M. E. Wechsler, N. A. Peppas and R. Langer, Nat. Rev. Drug Discovery, 2020, 20, 101–124 CrossRef PubMed.
- A. M. Wagner, D. S. Spencer and N. A. Peppas, J. Appl. Polym. Sci., 2018, 135, 46154 CrossRef PubMed.
- B. V. Slaughter, S. S. Khurshid, O. Z. Fisher, A. Khademhosseini and N. A. Peppas, Adv. Mater., 2009, 21, 3307–3329 CrossRef CAS PubMed.
- L. Lei, D. Huang, H. Gao, B. He, J. Cao and N. A. Peppas, Sci. Adv., 2022, 8, 8738 CrossRef PubMed.
- N. R. Richbourg, A. Ravikumar and N. A. Peppas, Macromol. Chem. Phys., 2021, 222, 2100138 CrossRef CAS PubMed.
- M. E. Wechsler, J. R. Clegg and N. A. Peppas, Reference Module in Biomedical Sciences, Elsevier, 2018 Search PubMed.
- A. K. Gaharwar, N. A. Peppas and A. Khademhosseini, Biotechnol. Bioeng., 2014, 111, 441–453 CrossRef CAS PubMed.
- L. E. Kass and J. Nguyen, Wiley Interdiscip. Rev.: Nanomed. Nanobiotechnol., 2022, 14, e1756 CAS.
- N. Pettinelli, S. Rodríguez-Llamazares, Y. Farrag, R. Bouza, L. Barral, S. Feijoo-Bandín and F. Lago, Int. J. Biol. Macromol., 2020, 146, 110–118 CrossRef CAS PubMed.
- J. Berger, M. Reist, J. M. Mayer, O. Felt, N. A. Peppas and R. Gurny, Eur. J. Pharm. Biopharm., 2004, 57, 19–34 CrossRef CAS PubMed.
- P. J. VandeVord, H. W. T. Matthew, S. P. DeSilva, L. Mayton, B. Wu and P. H. Wooley, J. Biomed. Mater. Res., 2002, 59, 585–590 CrossRef CAS PubMed.
- K. Tomihata and Y. Ikada, Biomaterials, 1997, 18, 567–575 CrossRef CAS PubMed.
- H. Sashiwa and S. I. Aiba, Prog. Polym. Sci., 2004, 29, 887–908 CrossRef CAS.
- H. Ueno, T. Mori and T. Fujinaga, Adv. Drug Delivery Rev., 2001, 52, 105–115 CrossRef CAS PubMed.
- O. Z. Fisher and N. A. Peppas, Macromolecules, 2009, 42, 3391–3398 CrossRef CAS PubMed.
- J. X. Zhong, J. R. Clegg, E. W. Ander and N. A. Peppas, J. Biomed. Mater. Res., Part A, 2018, 106, 1677–1686 CrossRef CAS PubMed.
- S. K. L. Levengood and M. Zhang, J. Mater. Chem. B, 2014, 2, 3161–3184 RSC.
- T. N. Vo, F. K. Kasper and A. G. Mikos, Adv. Drug Delivery Rev., 2012, 64, 1292–1309 CrossRef CAS PubMed.
- J. Patterson, R. Siew, S. W. Herring, A. S. P. Lin, R. Guldberg and P. S. Stayton, Biomaterials, 2010, 31, 6772–6781 CrossRef CAS PubMed.
- W. J. King and P. H. Krebsbach, Adv. Drug Delivery Rev., 2012, 64, 1239–1256 CrossRef CAS PubMed.
- G. J. Schmid, C. Kobayashi, L. J. Sandell and D. M. Ornitz, Dev. Dyn., 2009, 238, 766–774 CrossRef CAS PubMed.
- C. M. Murphy, M. G. Haugh and F. J. O’Brien, Biomaterials, 2010, 31, 461–466 CrossRef CAS PubMed.
- H. Barnett, M. Shevchuk, N. A. Peppas and M. Caldorera-Moore, J. Biomater. Sci., Polym. Ed., 2022, 33, 1324–1347 CrossRef CAS PubMed.
| This journal is © The Royal Society of Chemistry 2023 |

