A highly tuneable inverse emulsion polymerization for the synthesis of stimuli-responsive nanoparticles for biomedical applications
Andrew C.
Murphy†
ab,
Heidi F.
Oldenkamp†
ab and
Nicholas A.
Peppas
 *abcde
aMcKetta Department of Chemical Engineering, The University of Texas at Austin, Austin, TX 78712, USA. E-mail: peppas@che.utexas.edu
bInstitute for Biomaterials, Drug Delivery, and Regenerative Medicine, The University of Texas at Austin, Austin, TX 78712, USA
cDepartment of Biomedical Engineering, The University of Texas at Austin, Austin, TX 78712, USA
dDepartment of Surgery and Perioperative Care, Dell Medical School, The University of Texas at Austin, Austin, TX 78712, USA
eDivision of Pharmaceutics, College of Pharmacy, The University of Texas at Austin, Austin, TX 78712, USA
First published on 6th February 2024
Abstract
Polymeric nanomaterials have seen widespread use in biomedical applications as they are highly tuneable to achieve the desired stimuli-responsiveness, targeting, biocompatibility, and degradation needed for fields such as drug delivery and biosensing. However, adjustments to composition and the introduction of new monomers often necessitate reoptimization of the polymer synthesis to achieve the target parameters. In this study, we explored the use of inverse emulsion polymerization to prepare a library of polymeric nanoparticles with variations in pH and temperature response and examined the impact of overall batch volume and the volume of the aqueous phase on nanoparticle size and composition. We were able to prepare copolymeric nanoparticles using three different nonionic and three different anionic comonomers. Varying the non-ionizable comonomers, acrylamide (AAm), 2-hydroxyethyl methacrylate, and N-isopropylacrylamide (NIPAM), was found to alter the mass percentage of methacrylic acid (MAA) incorporated (from 26.7 ± 3.5 to 45.8 ± 1.8 mass%), the critical swelling pH (from 5.687 ± 0.194 to 6.637 ± 0.318), and the volume swelling ratio (from 1.389 ± 0.064 to 2.148 ± 0.037). Additionally, the use of NIPAM was found to allow for temperature-responsive behavior. Varying the ionizable comonomers, MAA, itaconic acid, and 2-acrylamido-2-methylpropane sulfonic acid (AMPSA), was found to significantly alter the critical swelling pH and, in the case of AMPSA, remove the pH-responsive behavior entirely. Finally, we found that for the base P(AAm-co-MAA) formulation, the pH-responsive swelling behavior was independent of the scale of the reaction; however, variations in the aqueous volume relative to the volume of the continuous phase significantly affected both the nanoparticle size and the critical swelling pH.
Introduction
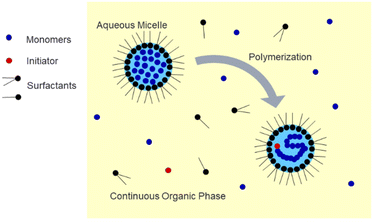
Polymer nanoparticles are an important class of materials with wide-ranging applications in biomedicine. Applications include drug delivery, regenerative medicine, and biosensing.1–5 Hydrogel nanoparticles, or nanogels, are especially desirable due to their highly tuneable properties such as size, chemical composition, surface functionality, and environmental responsiveness.6 For the controlled release of drugs, the drug cargo can be loaded into or onto the particle in various ways, such as entrapment, encapsulation, or attachment.7 Specifically, nanoparticles with a diameter less than 200 nm are desirable due to the enhanced permeation and retention (EPR) effect, which is especially relevant in drug delivery for cancer treatment due to the increased particle residence time in solid tumors, which can be attributed to their unique vasculature.8 These nanoparticles can be surface-modified, such as with PEG grafts, to camouflage them and avoid rapid clearance by the mononuclear phagocytic system after injection into the body.9 Applications in regenerative medicine include the fabrication of nanocomposite hydrogels, in which polymeric nanoparticles can be embedded within a bulk matrix or scaffold, such as a natural hydrogel, for the delivery of agents such as growth factors in tissue engineering.10 In the field of biosensing, polymeric nanoparticles can be incorporated into devices which show potential for the detection of a wide variety of molecules, which could contribute to disease diagnosis, environmental monitoring, and improved food safety.11One common method used to synthesize uniform nanogels is emulsion polymerization, in which hydrophobic monomer droplets are suspended in a continuous aqueous phase and stabilized by surfactant(s).12–15 This method is useful for the encapsulation of hydrophobic cargos but presents a challenge if it is desired to load a hydrophilic compound due to partitioning of the nanogels in the organic phase.16 As shown in Fig. 1, inverse emulsion polymerization utilizes a water-in-oil approach in which the water-soluble monomers and crosslinker are dissolved in the aqueous phase and then suspended in a continuous organic phase and stabilized by surfactants to form a nanoemulsion.17–19 This technique is useful for the encapsulation of hydrophilic compounds such as proteins.20–23 It has also been demonstrated that it is possible to incorporate environmentally-responsive crosslinkers within inverse emulsion-synthesized nanogels, which allows them to degrade under desired conditions to release a payload.20–22 Recent work in our lab explored the inverse emulsion polymerization of poly(acrylamide-co-methacrylic acid) (P(AAm-co-MAA)) nanogels and found the method to be a robust strategy for the preparation of pH-responsive nanoparticles for biomedical applications with the ability to reproducibly tune the size of the nanoparticles through manipulation of the reaction conditions.24 However, additional questions remain regarding the scalability of the polymerization, the degree to which nanoparticle composition is influenced by reaction conditions, and the accessibility of inverse emulsion polymerization to other biomedically-relevant polymers.
We hypothesized that the inverse emulsion polymerization technique used to synthesize tuneable P(AAm-co-MAA) nanoparticles demonstrated in Zhong et al. could be translated to other water-soluble comonomers without compromising the micelle stability and resulting nanoparticles. Specifically, we were interested in changing the identity of the non-ionizable and ionizable monomers (i.e. change acrylamide (AAm) to N-isopropyl acrylamide (NIPAM) or 2-hydroxyethyl methacrylate (HEMA) or swap methacrylic acid (MAA) for itaconic acid (IA) or 2-acrylamido-2-methylpropane sulfonic acid (AMPSA)). By changing the monomers used, we hypothesized that not only the hydrodynamic diameter, but also the pH- and temperature-responsive behavior could be altered within a single synthetic platform.
Additionally, we wanted to determine the effect of changing the overall batch size or aqueous phase volume used during particle synthesis on the chemical composition and pH-responsive behavior of the P(AAm-co-MAA) nanoparticles. Zhong et al. evaluated the impact of many polymerization parameters on the composition and behavior of the P(AAm-co-MAA) nanogels, including but not limited to comonomer ratio, total monomer concentration, crosslinking density, and surfactant concentration, but the effect of the batch size and aqueous phase volume were not evaluated. We were interested in exploring whether this platform could be scaled to varying batch sizes without negatively impacting the nanogel properties, which could potentially be useful for scale-up to industrial production. We believe that inverse emulsion polymerization is a useful synthesis technique that can be used to create a wide range of particles for varying biomedical applications.
Experimental
Materials and methods
![[thin space (1/6-em)]](https://www.rsc.org/images/entities/char_2009.gif) :
:![[thin space (1/6-em)]](https://www.rsc.org/images/entities/char_2009.gif) 1 molar feed ratio of non-ionizable comonomer to ionizable comonomer for all formulations) and methylenebisacrylamide crosslinker (202.8 mM) were dissolved in ultrapure water along with N,N,N′,N′-tetramethylethylenediamine. Exact volumes used are listed in Table 1. The aqueous solution was placed in a bath sonicator for 10 minutes to ensure complete dissolution of all compounds and homogeneity. To comprise the organic phase, surfactants Brij-30 (151.4 mM) and dioctyl sulfosuccinate (AOT, 30.3 mM) were added to hexanes and stirred in a round bottom flask at 500 rpm until dissolved. For the P(AAm-co-IA) formulations, a 10
1 molar feed ratio of non-ionizable comonomer to ionizable comonomer for all formulations) and methylenebisacrylamide crosslinker (202.8 mM) were dissolved in ultrapure water along with N,N,N′,N′-tetramethylethylenediamine. Exact volumes used are listed in Table 1. The aqueous solution was placed in a bath sonicator for 10 minutes to ensure complete dissolution of all compounds and homogeneity. To comprise the organic phase, surfactants Brij-30 (151.4 mM) and dioctyl sulfosuccinate (AOT, 30.3 mM) were added to hexanes and stirred in a round bottom flask at 500 rpm until dissolved. For the P(AAm-co-IA) formulations, a 10![[thin space (1/6-em)]](https://www.rsc.org/images/entities/char_2009.gif) :
:![[thin space (1/6-em)]](https://www.rsc.org/images/entities/char_2009.gif) 1 ratio of surfactants (Brij-30 to AOT) was used due to increased particle stability with a higher ratio of non-ionic to ionic surfactant, but the total concentration of surfactants remained the same (total surfactant concentration 181.7 mM, 165.2 mM Brij-30 and 16.5 mM AOT).
1 ratio of surfactants (Brij-30 to AOT) was used due to increased particle stability with a higher ratio of non-ionic to ionic surfactant, but the total concentration of surfactants remained the same (total surfactant concentration 181.7 mM, 165.2 mM Brij-30 and 16.5 mM AOT).
| Non-ionizable comonomer | Ionizable comonomer | Aqueous phase volume (mL) | Organic phase hexanes volume (mL) | Round bottom flask volume (mL) | TEMED volume (μL) | APS volume (μL) |
|---|---|---|---|---|---|---|
| AAm | MAA | 0.875 | 30 | 100 | 12.5 | 37.5 |
| AAm | MAA | 1.75 | 30 | 100 | 25 | 75 |
| AAm | MAA | 3.5 | 30 | 100 | 50 | 150 |
| AAm | MAA | 0.4375 | 7.5 | 25 | 6.25 | 18.75 |
| AAm | MAA | 3.5 | 60 | 200 | 50 | 150 |
| AAm | IA | 1.75 | 30 | 100 | 25 | 75 |
| AAm | AMPSA | 1.75 | 30 | 100 | 25 | 75 |
| NIPAM | MAA | 1.75 | 30 | 100 | 25 | 75 |
| HEMA | MAA | 1.75 | 30 | 100 | 25 | 75 |
A specified volume of the aqueous phase was then added to the organic phase to form the pre-polymer emulsion. The emulsion was purged with nitrogen gas for 20 minutes at 215 mL per minute to remove free radical scavengers. Then, a specified volume of initiator solution (100 mg mL−1 ammonium persulfate in ultrapure water) was added to the pre-polymer emulsion flask and it was purged with nitrogen for an additional 10 minutes. Reactions were allowed to polymerize overnight (or for 72 hours for P(AAm-co-IA) formulations) under constant stirring (500 rpm) at room temperature.
![[thin space (1/6-em)]](https://www.rsc.org/images/entities/char_2009.gif) :
:![[thin space (1/6-em)]](https://www.rsc.org/images/entities/char_2009.gif) 1 (2 changes), 3
1 (2 changes), 3![[thin space (1/6-em)]](https://www.rsc.org/images/entities/char_2009.gif) :
:![[thin space (1/6-em)]](https://www.rsc.org/images/entities/char_2009.gif) 1 (2 changes), 7
1 (2 changes), 7![[thin space (1/6-em)]](https://www.rsc.org/images/entities/char_2009.gif) :
:![[thin space (1/6-em)]](https://www.rsc.org/images/entities/char_2009.gif) 1 (1 change), 15
1 (1 change), 15![[thin space (1/6-em)]](https://www.rsc.org/images/entities/char_2009.gif) :
:![[thin space (1/6-em)]](https://www.rsc.org/images/entities/char_2009.gif) 1 (1 change), ultrapure water (4 changes). Dialysis for the P(AAm-co-IA) formulation began with a 1
1 (1 change), ultrapure water (4 changes). Dialysis for the P(AAm-co-IA) formulation began with a 1![[thin space (1/6-em)]](https://www.rsc.org/images/entities/char_2009.gif) :
:![[thin space (1/6-em)]](https://www.rsc.org/images/entities/char_2009.gif) 3 ratio of water to ethanol and then proceeded as described.
3 ratio of water to ethanol and then proceeded as described.
P(NIPAM-co-MAA) and P(HEMA-co-MAA) nanoparticles were mixed with an equivalent volume of tetrahydrofuran and centrifuged at 3200g for ten minutes one time. The nanoparticles were resuspended in a 50![[thin space (1/6-em)]](https://www.rsc.org/images/entities/char_2009.gif) :
:![[thin space (1/6-em)]](https://www.rsc.org/images/entities/char_2009.gif) 50 vol% ethanol/water mixture and immediately dialyzed against the same water/ethanol gradient as P(AAm-co-MAA). Following dialysis, a portion of the nanoparticle suspension was lyophilized to determine the particle concentration (mg mL−1) and for further characterization.
50 vol% ethanol/water mixture and immediately dialyzed against the same water/ethanol gradient as P(AAm-co-MAA). Following dialysis, a portion of the nanoparticle suspension was lyophilized to determine the particle concentration (mg mL−1) and for further characterization.
 | (1) |
Select nanoparticle formulations (P(AAm-co-MAA) and P(NIPAM-co-MAA)) were also subject to DLS measurements over a range of temperatures to observe the effect of temperature on particle swelling behavior. For these experiments, the nanoparticles were diluted to 0.5 mg mL−1 in 1× PBS and adjusted to pH 7.4. The sample was placed in a quartz cuvette inside the ZetaSizer and the temperature of the sample was increased from 19 to 55 °C in increments of 3 °C and the nanoparticle size was measured at each step.
Zeta potential measurements were collected using folded capillary zeta cells. The nanoparticle formulations were diluted to 2 mg mL−1 in 5 mM sodium phosphate buffer and adjusted to pH 7.4. Measurements were taken in triplicate, with each measurement representing an average of >10 runs.
Results and discussion
Nanoparticle chemical composition
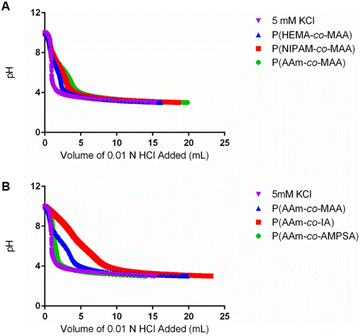 | ||
| Fig. 2 Potentiometric titration curves of representative samples of the formulations with varying (A) non-ionizable hydrophilic and (B) ionizable comonomers. | ||
| Formulation name (volume aqueous phase (mL)/volume hexanes in organic phase (mL)) | Measured MAA mass% (mean ± SD) | Ratio of measured MAA mass% to feed MAA mass % (mean ± SD) |
|---|---|---|
| P(AAm-co-MAA) 0.875/30 | 41.0 ± 4.2 | 1.548 ± 0.158 |
| P(AAm-co-MAA) 1.75/30 | 45.8 ± 1.2 | 1.730 ± 0.046 |
| P(AAm-co-MAA) 3.5/30 | 50.3 ± 5.7 | 1.899 ± 0.215 |
| P(AAm-co-MAA) 0.4375/7.5 | 45.5 ± 2.5 | 1.717 ± 0.093 |
| P(AAm-co-MAA) 3.5/60 | 46.0 ± 1.7 | 1.737 ± 0.066 |
| P(NIPAM-co-MAA) 1.75/30 | 31.6 ± 1.1 | 1.656 ± 0.056 |
| P(HEMA-co-MAA) 1.75/30 | 26.7 ± 3.5 | 1.560 ± 0.202 |
As shown in Fig. 2B, more apparent differences were observed in the buffering capacity of the formulations with different ionizable comonomers in comparison to those with different non-ionizable comonomers. P(AAm-co-AMPSA) showed little deviation from 5 mM potassium chloride while P(AAm-co-IA) had more acid content than P(AAm-co-MAA) and thus required a larger volume of titrant to overcome its buffering capacity; however, neither formulation displayed a prominent shoulder that could be used to determine pKa and acid content. In the case of P(AAm-co-AMPSA), the sulfonic acid likely remained ionized at pH 3 so no shoulder was observed over the measured range. As IA has two ionizable groups per unit with similar pKa values, the protonation of the two groups overlapped and obscured the individual transitions. As a result, it was not possible to calculate precise acid content for P(AAm-co-IA) using the same method as was used for MAA, but the greater HCl volume needed for the titration compared to P(AAm-co-MAA) is indicative of a greater total acid content.
![[thin space (1/6-em)]](https://www.rsc.org/images/entities/char_2009.gif) :
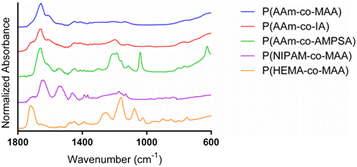
:![[thin space (1/6-em)]](https://www.rsc.org/images/entities/char_2009.gif) ethanol gradient). The most prominent peak is found at 1654 cm−1, which is indicative of the stretching of the acrylamide carbonyl groups. The shoulder around 1610 cm−1 and smaller peak at 1440 cm−1 is indicative of carbonyl stretching in deprotonated carboxylates. The spectrum for P(AAm-co-IA) is similar to that of P(AAm-co-MAA), with the main differences being the addition of a shoulder on the carbonyl peak around 1710 cm−1 (which can be attributed to the increased presence of carboxylic acid groups in comparison to MAA) and a small peak at 1190 cm−1 (C–O). The strong acrylamide peak demonstrated in P(AAm-co-MAA) and carboxylate anion peaks are also present in the spectra for P(AAm-co-IA). P(AAm-co-AMPSA) nanoparticles also resulted in a spectrum with a strong acrylamide peak around 1663 cm−1. The peak at 1040 cm−1 and collection of peaks from 1140–1240 cm−1 are indicative of the sulfonic acid group on AMPSA. The peak at 625 cm−1 can be attributed to S-OR species. For the P(NIPAM-co-MAA) formulation, we observed a peak at 1705 cm−1, which is indicative of the carboxylic acid group on MAA and a series of 3 successively smaller peaks at 1635, 1530, and 1455 cm−1, which are characteristic of NIPAM. Finally, for P(HEMA-co-MAA), we observed a strong C
ethanol gradient). The most prominent peak is found at 1654 cm−1, which is indicative of the stretching of the acrylamide carbonyl groups. The shoulder around 1610 cm−1 and smaller peak at 1440 cm−1 is indicative of carbonyl stretching in deprotonated carboxylates. The spectrum for P(AAm-co-IA) is similar to that of P(AAm-co-MAA), with the main differences being the addition of a shoulder on the carbonyl peak around 1710 cm−1 (which can be attributed to the increased presence of carboxylic acid groups in comparison to MAA) and a small peak at 1190 cm−1 (C–O). The strong acrylamide peak demonstrated in P(AAm-co-MAA) and carboxylate anion peaks are also present in the spectra for P(AAm-co-IA). P(AAm-co-AMPSA) nanoparticles also resulted in a spectrum with a strong acrylamide peak around 1663 cm−1. The peak at 1040 cm−1 and collection of peaks from 1140–1240 cm−1 are indicative of the sulfonic acid group on AMPSA. The peak at 625 cm−1 can be attributed to S-OR species. For the P(NIPAM-co-MAA) formulation, we observed a peak at 1705 cm−1, which is indicative of the carboxylic acid group on MAA and a series of 3 successively smaller peaks at 1635, 1530, and 1455 cm−1, which are characteristic of NIPAM. Finally, for P(HEMA-co-MAA), we observed a strong C![[double bond, length as m-dash]](https://www.rsc.org/images/entities/char_e001.gif) O peak around 1710 cm−1 and C–O–C peaks indicative of HEMA between 1300–1000 cm−1. There were no differences in the FTIR spectra for identical batches (synthesized in triplicate) and all synthesized formulations of P(AAm-co-MAA) resulted in identical FTIR spectra despite the differing aqueous phase and overall batch volumes.
O peak around 1710 cm−1 and C–O–C peaks indicative of HEMA between 1300–1000 cm−1. There were no differences in the FTIR spectra for identical batches (synthesized in triplicate) and all synthesized formulations of P(AAm-co-MAA) resulted in identical FTIR spectra despite the differing aqueous phase and overall batch volumes.
Stimuli-responsive swelling behavior of the nanoparticles
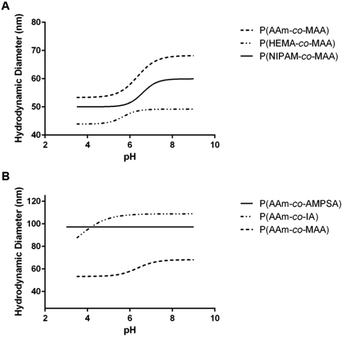 | ||
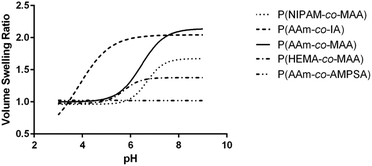
| Fig. 4 Average swelling profile for each of the different comonomer formulations of (A) non-ionizable hydrophilic and (B) ionizable comonomers. | ||
| Formulation | Critical swelling pH (mean ± SEM) | Maximum volume swelling ratio (mean ± SD) |
|---|---|---|
| P(AAm-co-MAA) | 6.329 ± 0.058 | 2.148 ± 0.037 |
| P(NIPAM-co-MAA) | 6.637 ± 0.318 | 1.693 ± 0.378 |
| P(HEMA-co-MAA) | 5.678 ± 0.194 | 1.389 ± 0.064 |
| P(AAm-co-IA) | 3.604 ± 0.597 | 2.068 ± 0.444 |
| P(AAm-co-AMPSA) | N/A | 1.048 ± 0.008 |
Comparing the effect of different ionizable comonomers (Fig. 4B), P(AAm-co-AMPSA) most notably did not show any swelling or collapse over the tested pH range, which was due to the sulfonic acid remaining fully ionized over the measured range, and so it was excluded from further analysis. Similar to P(NIPAM-co-MAA) and P(HEMA-co-MAA), P(AAm-co-IA) exhibited aggregation as it approached the pKa values of the carboxylic acid groups in IA; however, unlike the other formulations, the aggregation occurred before the nanoparticles had reached their fully collapsed diameter.
For the purposes of comparison, the smallest hydrodynamic diameter of the nanoparticles prior to aggregation was used to calculate the volume swelling ratio, although this resulted in the collapsed volume swelling ratio predicted from the data fit to be below 1. For the determined volume swelling ratio at the fully swollen condition, P(AAm-co-IA) had the second greatest volume swelling ratio, although this was found to not be significantly different from any of the other formulations. P(AAm-co-IA) also had the largest swollen hydrodynamic diameter of the tested comonomer formulations. However, P(AAm-co-IA) was found to have a significantly lower critical swelling pH than P(AAm-co-MAA), P(NIPAM-co-MAA), and P(HEMA-co-MAA) as determined by one-way ANOVA. One possible explanation for this is that the greater density of carboxylic acid groups and broader pH range over which protonation occurs increased electrostatic repulsion and enabled the P(AAm-co-MAA) nanoparticles to remain swollen until lower pH values than those with MAA. From these findings, altering the choice of comonomer can be used to adjust the stability and critical swelling pH of the nanoparticles to suit the demands of a particular application.
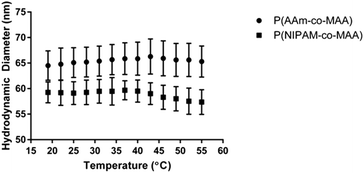
Additionally, NIPAM has been studied for its ability to form temperature-responsive polymers, which have many applications in drug delivery and regenerative medicine. In order to examine the impact of inverse emulsion polymerization on the temperature responsiveness of P(NIPAM-co-MAA) nanoparticles, the hydrodynamic diameter as a function of temperature was measured for P(NIPAM-co-MAA) and P(AAm-co-MAA) nanoparticles (Fig. 6). Across the measured temperature range, P(NIPAM-co-MAA) exhibits a significant decrease in hydrodynamic diameter (p = 0.033), which is not observed in P(AAm-co-MAA). This data confirms that the inverse emulsion polymerization does not negatively affect the temperature-responsive properties of the nanogels containing NIPAM.
| Aqueous phase volume (mL) | Organic phase hexanes volume (mL) | Critical swelling pH (mean ± SEM) | Maximum volume swelling ratio (mean ± SD) |
|---|---|---|---|
| 0.4375 | 7.5 | 6.353 ± 0.080 | 2.182 ± 0.217 |
| 1.75 | 30 | 6.329 ± 0.058 | 2.148 ± 0.037 |
| 3.5 | 60 | 6.189 ± 0.086 | 2.140 ± 0.032 |
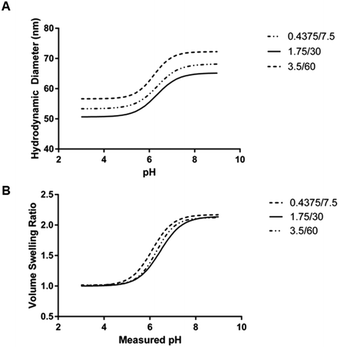
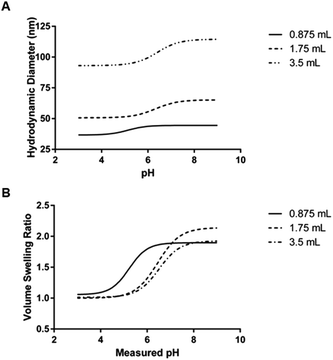
The mean critical swelling pH of the formulations synthesized with the smallest volume of aqueous phase solution was significantly lower than the other two aqueous phase volumes evaluated (as determined by a one-way ANOVA and Tukey's multiple comparisons test) and these values are shown in Table 5. Similarly to comparing the formulations synthesized with varying overall batch size, we plotted volume swelling ratio as a function of pH (Fig. 8B), which clearly shows the lower critical swelling pH for the formulation synthesized with the smallest aqueous phase volume. While this plot demonstrates a larger maximum volume swelling ratio for the intermediate aqueous phase volume, this difference was determined to not be statistically significant.
| Aqueous phase volume (mL) | Organic phase hexanes volume (mL) | Critical swelling pH (mean ± SEM) | Maximum volume swelling ratio (mean ± SD) |
|---|---|---|---|
| 0.875 | 30 | 5.141 ± 0.201 | 1.932 ± 0.167 |
| 1.75 | 30 | 6.329 ± 0.058 | 2.148 ± 0.037 |
| 3.5 | 30 | 6.405 ± 0.112 | 1.926 ± 0.301 |
Impact of polymerization on polymer surface charge
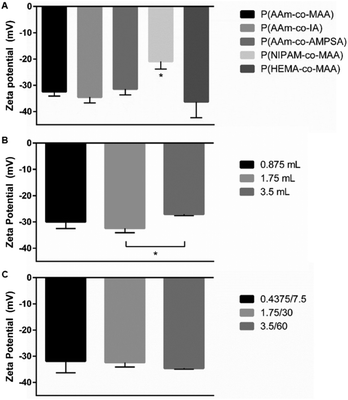
The measured zeta potential for all formulations was negative, as expected for anionic polymer nanoparticles. For the five formulations when changing the non-ionic and ionic comonomer identity, shown in Fig. 9A, the P(NIPAM-co-MAA) particle zeta potential was statistically significant from all other formulations (significance determined with one-way ANOVA and Tukey's multiple comparisons test). When varying just the aqueous phase volume for P(AAm-co-MAA) syntheses (Fig. 9B), the difference in average zeta potentials for 1.75 mL and 3.5 mL aqueous phase volumes was statistically significant. This could be due to the larger particle diameter of the particles synthesized with 3.5 mL of aqueous phase. Larger particle diameter indicates larger surface area, which could reduce the density of MAA groups near the surface, leading to a slightly more neutral zeta potential. Finally, when scaling the entire batch size of the synthesized P(AAm-co-MAA) particles (Fig. 9C), there was no significant difference in average zeta potential between the three different formulations.Conclusions
In this work, inverse emulsion polymerization was demonstrated as a synthesis platform for a wide range of polymeric nanomaterials. The batch size of the reaction was found to have negligible impact on several key parameters for biomedical applications, including volume swelling ratio, critical swelling pH, and MAA acid content, which suggests the system can be scaled to large batch sizes without negatively impacting the nanoparticles. Furthermore, the aqueous phase volume can be adjusted to tune the hydrodynamic diameter of the resulting nanoparticles. Finally, we demonstrated that this platform is extendable to a wide range of possible hydrophilic comonomers, both ionizable and non-ionizable, that can be used to impart new responsive behavior on the materials, such as variations in pH- and temperature-responsive compared to P(AAm-co-MAA) nanoparticles. The stimuli-responsive behavior of the synthesized nanoparticles could be desired in certain controlled drug delivery or regenerative medicine applications. While the results of this study focused on anionic comonomers only, future studies exploring the use of cationic comonomers would be valuable for applications such as biosensing or drug delivery of low pI biomacromolecules.Author contributions
ACM and HFO contributed equally to the conceptualization, investigation, formal analysis, visualization, and writing – original draft. NAP was responsible for the resources, funding acquisition, supervision, and writing – review and editing.Conflicts of interest
The authors declare no conflicts of interest.Acknowledgements
The authors acknowledge financial support from the National Institutes of Health (R01-EB022025), the Cockrell Family Chair Foundation, and the office of the Dean of the Cockrell School of Engineering at the University of Texas at Austin for the Institute for Biomaterials, Drug Delivery, and Regenerative Medicine. ACM and HFO also acknowledge financial support from the National Science Foundation Graduate Research Fellowship Program (DGE-1610403). Any opinions, findings, and conclusions or recommendations expressed in this material are those of the author(s) and do not necessarily reflect the views of the funding agencies.References
- M. J. Mitchell, M. M. Billingsley, R. M. Haley, M. E. Wechsler, N. A. Peppas and R. Langer, Nat. Rev. Drug Discovery, 2020, 20, 101–124 CrossRef PubMed.
- L. Brannon-Peppas, Int. J. Pharm., 1995, 116, 1–9 CrossRef CAS.
- A. M. Wagner, M. P. Gran and N. A. Peppas, Acta Pharm. Sin. B, 2018, 8, 147 CrossRef PubMed.
- O. Z. Fisher and N. A. Peppas, Macromolecules, 2009, 42, 3391–3398 CrossRef CAS PubMed.
- M. E. Wechsler, H. K. H. J. Dang, S. D. Dahlhauser, S. P. Simmonds, J. F. Reuther, J. M. Wyse, A. N. VandeWalle, E. V. Anslyn and N. A. Peppas, Chem. Commun., 2020, 56, 6141–6144 RSC.
- A. Zielinska, F. Carreiró, A. M. Oliveira, A. Neves, B. Pires, D. N. Venkatesh, A. Durazzo, M. Lucarini, P. Eder, A. M. Silva, A. Santini and E. B. Souto, Molecules, 2020, 25, 3731 CrossRef CAS PubMed.
- K. S. Soppimath, T. M. Aminabhavi, A. R. Kulkarni and W. E. Rudzinski, J. Controlled Release, 2001, 70, 1–20 CrossRef CAS PubMed.
- E. Blanco, H. Shen and M. Ferrari, Nat. Biotechnol., 2015, 33, 941 CrossRef CAS PubMed.
- D. E. Owens and N. A. Peppas, Int. J. Pharm., 2006, 307, 93–102 CrossRef CAS PubMed.
- K. S. Suresh, S. Bhat, B. R. Guru, M. S. Muttigi and R. N. Seetharam, Stem Cell Res. Ther., 2020, 11, 1–14 CrossRef PubMed.
- A. T. Silva, R. Figueiredo, M. Azenha, P. A. S. Jorge, C. M. Pereira and J. A. Ribeiro, ACS Sens., 2023, 8, 2898–2920 CrossRef CAS PubMed.
- K. Landfester, Angew. Chem., Int. Ed., 2009, 48, 4488–4507 CrossRef CAS PubMed.
- R. Muñoz-Espí and O. Álvarez-Bermúdez, in Nanoemulsions: Formulation, Applications, and Characterization, Academic Press, 2018, pp. 477–515 Search PubMed.
- A. S. Puranik, L. P. Pao, V. M. White and N. A. Peppas, Eur. J. Pharm. Biopharm., 2016, 108, 196–213 CrossRef CAS PubMed.
- A. Elzayat, I. Adam-Cervera, O. Álvarez-Bermúdez and R. Muñoz-Espí, Colloids Surf., B, 2021, 203, 111764 CrossRef CAS PubMed.
- V. Daniloska, P. Carretero, R. Tomovska, M. Paulis and J. M. Asua, ACS Appl. Mater. Interfaces, 2014, 6, 3559–3567 CrossRef CAS PubMed.
- M. Antonietti and K. Landfester, Prog. Polym. Sci., 2002, 27, 689–757 CrossRef CAS.
- K. Landfester, Adv. Mater., 2001, 13, 765–768 CrossRef CAS.
- J. K. Oh, S. A. Bencherif and K. Matyjaszewski, Polymer, 2009, 50, 4407–4423 CrossRef CAS.
- K. Raghupathi, S. J. Eron, F. Anson, J. A. Hardy and S. Thayumanavan, Mol. Pharm., 2017, 14, 4515 CrossRef CAS PubMed.
- S. M. Standley, Y. J. Kwon, N. Murthy, J. Kunisawa, N. Shastri, S. J. Guillaudeu, L. Lau and J. M. J. Fréchet, Bioconjugate Chem., 2004, 15, 1281–1288 CrossRef CAS PubMed.
- N. Murthy, M. Xu, S. Schuck, J. Kunisawa, N. Shastri and J. M. J. Fréchet, Proc. Natl. Acad. Sci. U. S. A., 2003, 100, 4995 CrossRef CAS PubMed.
- M. A. Azagarsamy, D. L. Alge, S. J. Radhakrishnan, M. W. Tibbitt and K. S. Anseth, Biomacromolecules, 2012, 13, 2219 CrossRef CAS PubMed.
- J. X. Zhong, J. R. Clegg, E. W. Ander and N. A. Peppas, J. Biomed. Mater. Res., Part A, 2018, 106, 1677–1686 CrossRef CAS PubMed.
Footnote |
| † These authors contributed equally. |
| This journal is © The Royal Society of Chemistry 2024 |

