 Open Access Article
Characterizing excited-state intramolecular proton transfer in 3-hydroxyflavone with ultrafast transient infrared spectroscopy†
Valerie S.
Winkler
and
Joseph A.
Fournier
 *
*
Washington University in St. Louis, One Brookings Dr, St. Louis, MO 63130, USA. E-mail: jfournier@wustl.edu; Tel: +1-314-935-8183
First published on 2nd October 2024
Abstract
Vibrational dynamics associated with excited-state intramolecular proton transfer in 3-hydroxyflavone and 3-hydroxy-2-(thiophen-2-yl)chromen-4-one are characterized with ultrafast transient infrared spectroscopy. The spectroscopic data reveal rapid (<100 fs) proton transfer dynamics in both species, followed by vibrational relaxation of the tautomer products within a few picoseconds. Coherent coupling of the shared proton to low-frequency modes along the hydrogen bond coordinate are also observed in the ground electronic states.
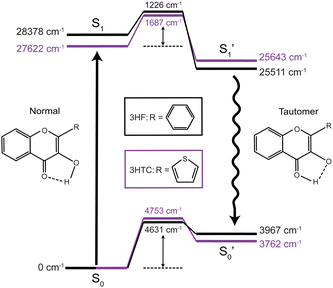
Excited-state proton transfer reactions are a crucial class of reactions that are ubiquitous in biological systems, chemical catalysis, and photoredox chemistry.1,2 Many model systems have been investigated to characterize the fundamental dynamics and mechanisms of proton transfer processes. In particular, 3-hydroxyflavone (3HF) is a prototypical system for the study of excited-state intramolecular proton transfer (ESIPT) reactions.3,4 Upon UV excitation to the first electronic excited state (S1), the “normal” enol isomer undergoes ESIPT to form the keto tautomer (referred to as the
 state), as depicted in Fig. 1. The S0 to S1 excitation is a π–π* transition where significant electron density is removed from the enol OH group, resulting in a highly acidic proton where transfer to the tautomer
  structure becomes energetically favourable. Dual fluorescence from both the normal and tautomer states have been observed, with their ratio being highly dependent on solvent and temperature.3–9 Due to ease of chemical modification of the 3HF scaffold, flavonoids and their derivatives have been widely explored as tuneable chemical probes and sensors.10–14
Time-resolved fluorescence15–17 and UV/Vis transient absorption9,18 spectroscopic investigations of 3HF have reported ultrafast (<100 fs) ESIPT timescales occurring within the instrument response. In polar solvents such as ethanol and acetonitrile, hydrogen bonding between the solvent and enol group disrupts the intramolecular hydrogen bond. Consequently, slower (few ps) proton transfer dynamics have been measured that involve breaking of the enol-solvent hydrogen bond.16,17 Numerous computational studies have also been performed on 3HF to investigate the ESIPT process.19–23 Molecular dynamics simulations, in general, corroborate both the ultrafast proton transfer dynamics in gas phase or nonpolar solvents and the slower solvent-inhibited picosecond dynamics in polar solvents. The rapid transfer dynamics arise from the relatively small barrier (700–1400 cm−1, 2–4 kcal mol−1) between the S1 and  states, indicating a near-barrierless proton transfer reaction upon excitation into the Franck–Condon region.23
The multiple broad features observed in the transient UV/Vis spectra of 3HF, however, have led to interpretational difficulties in determining the molecular-level mechanism of ESIPT.9 To uncover the vibrational dynamics underlying the ESIPT process, Chevalier et al. reported transient infrared spectra of 3HF in acetonitrile following UV excitation at 360 nm.24 Global fitting analysis of the transient infrared spectra resulted in a ∼3 ps spectral decay component assigned to the solvent-inhibited ESIPT process. A slower ∼10 ps spectral component was assigned to vibrational relaxation of the tautomer  state following proton transfer. The 500 fs experimental resolution, however, did not allow the faster ESIPT component unperturbed by solvent to be measured.
To better characterize ESIPT and provide improved experimental benchmarks for computational predictions, we have measured transient infrared spectra of 3HF and the derivative 3-hydroxy-2-(thiophen-2-yl)chromen-4-one (3HTC)25 with approximately 100 fs resolution in a non-perturbing solvent (chloroform). Detailed experimental, computational, and data analysis methods are provided in the ESI.†
The calculated (B3LYP-D3BJ/aug-cc-pVDZ) energy levels for isolated structures of the normal, transition state, and tautomer species in the ground and first excited electronic states for 3HF and 3HTC are shown in Fig. 1. Optimized structures for each species are given in ESI,† Fig. S1. Small barriers between the normal and tautomer structures are predicted in the excited state, with 3HF calculated to have a barrier of about 1200 cm−1 and 3HTC about 1700 cm−1, consistent with previous computational studies.19,26
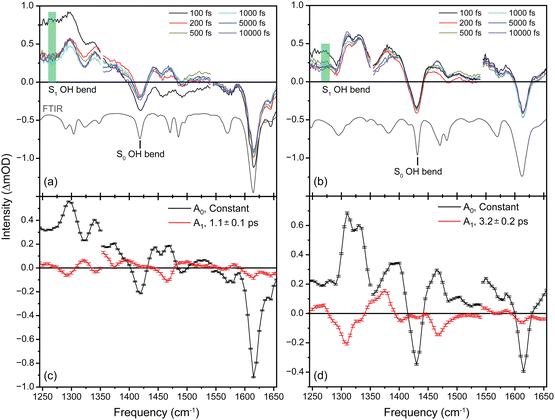
Transient infrared spectra following UV excitation are shown in Fig. 2a for 3HF (excitation wavelength 363 nm) and Fig. 2b for 3HTC (excitation wavelength 379 nm). The UV/Vis spectra of 3HF and 3HTC are provided in Fig. S2 (ESI†). In both species, there are two dominant negative signals corresponding to bleaching of ground-state S0 vibrational transitions: the ketone carbonyl stretch near 1630 cm−1 and the enol OH bend near 1440 cm−1 (FTIR spectra are given by the grey inverted traces in Fig. 2a and b). Computational predictions of the vibrational spectra in the S0 states of the isolated molecules are provided in Fig. S3 (ESI†). The positive signals correspond to vibrational transitions in excited electronic states. In both species, the transient spectra show minor evolution after about 200 fs, indicating that the excited-state features beyond 200 fs derive from the  tautomer following a rapid proton transfer process. For 3HF, the most intense excited-state features appear near 1300 and 1350 cm−1. Based on the spectral components and computational assignments made by Chevalier et al.24 and our calculated
  spectrum (Fig. S4, ESI†), these features are both expected to have mixed C–C and C–O stretch character. Two weaker excited-state features appear near 1450 cm−1, which are assigned to transitions with mixed CH and OH bend character based on the calculated
  spectrum. The calculations by Chevalier et al.24 (B3LYP/TZVP), to the best of our knowledge, are the only computed excited-state vibrational spectra reported for 3HF, and were shown to be strongly influenced by inclusion of either a single explicit acetonitrile molecule or a polarizable continuum model (PCM) for the solvent. While our excited-state calculations are in close agreement to those reported by Chevalier et al.24 on isolated 3HF, both sets of calculations show only modest overall agreement with the experimental excited-state spectra. A more thorough computational characterization of the excited-state vibrational spectra of 3HF and its derivatives is clearly warranted.
 | ||
Fig. 2 Transient infrared spectra of (a) 3HF and (b) 3HTC at selected delay times following UV excitation. FTIR spectra are presented as inverted grey traces in both panels. Assignment of the OH bend transition in the S1 state and integration area for the time traces shown in Fig. 3 are given by the green boxes. Global fit analysis of the transient infrared spectra between 0.2–10 ps for (c) 3HF and (d) 3HTC. The A0 components are static contributions representing the ground-state bleach and excited-state  spectra. The A1 components follow a monoexponential decay (time constants given inset) and are assigned to vibrational relaxation of the spectra. The A1 components follow a monoexponential decay (time constants given inset) and are assigned to vibrational relaxation of the  states following proton transfer. states following proton transfer. | ||
Transient IR spectra for 3HTC have not been previously reported, but show similar patterns to 3HF. An intense, closely spaced excited-state doublet feature appears near 1325 cm−1. The other strong excited-state features occur at 1375 and 1450 cm−1. Based on the similarities of the experimental spectra, the strongest 3HTC  transitions also likely derive from normal mode vibrations that involve C–C stretch, C–O stretch, CH bend, and OH bend motions. The calculated
  spectrum of 3HTC is presented in Fig. S4 (ESI†).
Global fit analysis of the transient spectra was performed starting at 200 fs, following proton transfer. Two dominant decay-associated spectral components were recovered for both 3HF and 3HTC, which are presented in Fig. 2c and d, respectively. The largest component for each species, labelled A0, is constant over the 10 ps experimental window and correspond to the S0 ground-state bleach and the excited-state  spectra. The constant nature of the A0 components indicate that the
  tautomers form within 200 fs following electronic excitation. A weaker second profile observed for both compounds, labelled A1, have monoexponential decay constants of about 1 ps for 3HF and 3 ps for 3HTC. The 3HF A1 spectrum is similar in appearance to the longer-lived spectral component identified by Chevalier et al. in acetonitrile.24 We likewise assign the A1 decay-associated spectra of 3HF and 3HTC to changing intensities and frequencies of the
  states resulting from vibrational relaxation following ESIPT. With 3HF and 3HTC having very similar structures, it is expected that intermolecular relaxation to the solvent will occur on similar timescales for both species. The timescale difference between 3HF and 3HTC, therefore, is attributed to differences in the efficiency of intramolecular vibrational relaxation between the two species following the proton transfer event.
There are no unambiguous signatures, however, of the normal S1 structure for either species. Based on the few-ps solvent-inhibited S1 spectral component of 3HF determined by Chevalier et al. in acetonitrile,24 the most intense S1 transitions are masked by the strong and broad  background near 1350 cm−1 (computational predictions of the S1 state vibrational spectra are provided in Fig. S5, ESI†). The extracted S1 spectra by Chevalier et al., however, showed a relatively isolated transition near 1275 cm−1 that falls below the strong
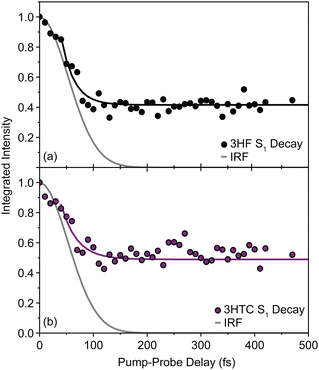
  background and was assigned as the OH bend transition. This transition, therefore, acts as a direct reporter of the proton transfer coordinate. The transient spectra at 100 fs delay time does show larger intensity in this spectral region compared to later spectra, indicating the presence of the S1 species at the earliest delay times measured. The decay dynamics of the putative S1 OH bend transitions near 1275 cm−1 for both 3HF and 3HTC are presented in Fig. 3. While the measured signals at >50 fs show intensity above the instrument response (grey traces in Fig. 3), it is difficult to deconvolve the responses at the current signal-to-noise levels. Therefore, we characterize the decay of the S1 states and the ESIPT timescales in 3HF and 3HTC as being sub-100 fs, consistent with those measured by Ameer-Beg et al. for 3HF in nonpolar solvent by transient UV/Vis spectroscopy.9 Time profiles in the 1300–1350 cm−1 regions are provided in Fig. S6 for 3HF and S7 for 3HTC (ESI†). These kinetics display similarly fast initial decays with time constants <100 fs, indicating that strong S1 transitions are present at the earliest delay times. In particular, time traces and fits of isolated
  transitions near 1460 cm−1 in Fig. S6c and S7c (ESI†) have an initial sub-100 fs increase in signal, consistent with the rapid decay of the S1 features. These
  features also have slower exponential growth time constants of about 1.2 ps and 2.5 ps for 3HF and 3HTC, respectively, in reasonable agreement with the A1 decay time constants from the global fit analysis. Although more accurate ESIPT timescales cannot be currently measured, these measurements provide a more direct experimental estimate for the ESIPT timescales in 3HF and 3HTC.
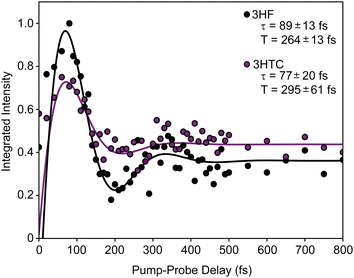
The intramolecular hydrogen bond in the ground S0 state in both species is quite weak, with proton donor–acceptor distances between the sharing oxygen atoms calculated to be approximately 2.6 Å. This distance decreases significantly in the S1 state, with optimized values close to 2.5 Å. The large decrease in the O–O distance suggests that strong anharmonic coupling should exist between the proton degrees of freedom (OH stretch and bend) and low-frequency vibrational modes that alter the OH–O hydrogen bond interaction (e.g., the O–O stretch). Interestingly, the OH bend ground-state transitions for 3HF and 3HTC exhibit highly damped oscillatory behaviour at early pump–probe delay times (Fig. 4). Identical oscillations are also present in the ground-state IR pump-IR probe transient absorption spectra (Fig. S8 and S9, ESI†). The presence of these oscillations in the ground electronic state is consistent with impulsive excitation and coherent coupling dynamics between the OH bend and low-frequency hydrogen bond motions within the S0 state.19,23,27–29 The oscillation periods of 264 fs in 3HF and 295 fs in 3HTC correspond to vibrational frequencies of about 125 cm−1 and 110 cm−1, respectively. The S0 calculations predict several modes in this low-frequency region that involve the proton donor and acceptor groups that are most likely involved in the coupling: in-plane bending motions that bring the donor and acceptor oxygen atoms towards each other (118 cm−1 in 3HF) and out-of-plane bending motions (102 cm−1 in 3HF, 102 cm−1 and 107 cm−1 in 3HTC) perpendicular to the OH–O coordinate (Fig. S10, ESI†). Such motions that directly impact the proton transfer coordinate are expected to play prominent roles in the ESIPT process upon electronic excitation.
The observed rapid ESIPT dynamics and wavepacket dynamics on the ground state provide new experimental benchmarks for advanced theoretical methods. Higher-order experiments with better time resolution that resolve the UV excitation axis (namely, two-dimensional electronic-vibrational spectroscopy) are necessary to more accurately measure the ESIPT dynamics and identify the nuclear coordinates that drive ESIPT through the measurement of vibrational wavepacket dynamics on the excited electronic surfaces.30 Experiments on the deuterated species to measure kinetic isotope effects would further validate the ESIPT mechanism. Temperature-dependent studies could also provide an experimental measurement of the ESIPT barrier. Improved fundamental understanding of ESIPT and vibrational relaxation mechanisms will aid in the development of more tuneable and sensitive molecular probes and sensors for material and biological applications.
This work was supported by the US National Science Foundation under grant CHE-2044927.
Data availability
The following data are provided in ESI:† Cartesian coordinates of the optimized S0, S1 and structures; transient infrared spectra at the pump–probe waiting times and the global fit analysis presented in Fig. 2. Data from all other pump–probe times are available on the Harvard Dataverse at https://doi.org/10.7910/DVN/Q7IQIH.
Conflicts of interest
There are no conflicts to declare.Notes and references
- A. P. Demchenko, K. C. Tang and P. T. Chou, Chem. Soc. Rev., 2013, 42, 1379–1408 RSC.
- T. Kumpulainen, B. Lang, A. Rosspeintner and E. Vauthey, Chem. Rev., 2017, 117, 10826–10939 CrossRef CAS.
- P. K. Sengupta and M. Kasha, Chem. Phys. Lett., 1979, 68, 382 CrossRef CAS.
- G. J. Woolfe and P. J. Thistlethwaite, J. Am. Chem. Soc., 1981, 103, 6919 Search PubMed.
- M. Itoh, K. Tokumura, Y. Tanimoto, Y. Okada, H. Takeuchi, K. Obi and I. Tanaka, J. Am. Chem. Soc., 1982, 10, 4146 CrossRef.
- A. J. G. Strandjord, S. H. Courtney, D. M. Friedrich and P. F. Barbara, J. Phys. Chem., 1983, 87, 1125–1133 CrossRef CAS.
- D. McMorrow and M. Kasha, J. Phys. Chem., 1984, 88, 2235 CrossRef CAS.
- S. Protti and A. Mezzetti, J. Mol. Liq., 2015, 205, 110–114 CrossRef CAS.
- S. Ameer-Beg, S. M. Ormson, R. G. Brown, P. Matousek, M. Towrie, E. T. J. Nibbering, P. Foggi and F. V. R. Neuwahl, J. Phys. Chem. A, 2001, 105, 3709–3718 CrossRef CAS.
- M. Sarkar and P. K. Sengupta, Chem. Phys. Lett., 1991, 179, 68 CrossRef CAS.
- A. Sytnik, D. Gormin and M. Kasha, Proc. Natl. Acad. Sci. U. S. A., 1994, 91, 11968–11972 CrossRef CAS.
- J. Guharay, B. Sengupta and P. K. Sengupta, Proteins, 2001, 43, 75–81 CrossRef CAS.
- A. S. Klymchenko and A. P. Demchenko, Langmuir, 2002, 18, 5637 CrossRef CAS.
- S. Chaudhuri, K. Basu, B. Sengupta, A. Banerjee and P. K. Sengupta, Luminescence, 2008, 23, 397–403 CrossRef CAS.
- A. N. Bader, V. G. Pivovarenko, A. P. Demchenko, F. Ariese and C. Gooijer, J. Phys. Chem. B, 2004, 108, 10589 CrossRef CAS.
- T. C. Swinney and D. F. Kelley, J. Phys. Chem., 1991, 95, 10369 CrossRef CAS.
- G. A. Brucker, T. C. Swinney and D. F. Kelley, J. Phys. Chem., 1991, 95, 3190 CrossRef CAS.
- B. J. Schwartz, L. A. Peteanu and C. B. J. Harris, Phys. Chem., 1992, 96, 3591 CrossRef CAS.
- M. Nottoli, M. Bondanza, F. Lipparini and B. J. Mennucci, Chem. Phys., 2021, 154, 184107 CAS.
- Y. Li, F. Siddique, A. J. Aquino and H. Lischka, J. Phys. Chem. A, 2021, 125, 5765–5778 CrossRef CAS.
- X. P. Chang, F. R. Fan, G. Zhao, X. Ma and T. S. Zhang, Chem. Phys., 2023, 575, 112056 CrossRef CAS.
- M. J. Colín, M. Á. Aguilar and M. E. Martín, ACS Omega, 2023, 8, 19939–19949 CrossRef.
- M. A. Bellucci and D. F. Coker, J. Chem. Phys., 2012, 136, 194505 CrossRef PubMed.
- K. Chevalier, M. M. N. Wolf, A. Funk, M. Andres, M. Gerhards and R. Diller, Phys. Chem. Chem. Phys., 2012, 14, 15007–15020 RSC.
- D. Dziuba, I. A. Karpenko, N. P. F. Barthes, B. Y. Michel, A. S. Klymchenko, R. Benhida, A. P. Demchenko, Y. Mély and A. Burger, Chem. – Eur. J., 2014, 20, 1998–2009 CrossRef CAS PubMed.
- H. Ma and J. Huang, RSC Adv., 2016, 6, 96147 RSC.
- J. Stenger, D. Madsen, J. Dreyer, E. T. J. Nibbering, P. Hamm and T. Elsaesser, J. Phys. Chem. A, 2001, 105, 2929–2932 CrossRef CAS.
- C. Chudoba, E. Riedle, M. Pfeiffer and T. Elsaesser, Chem. Phys. Lett., 1996, 263, 622 CrossRef CAS.
- M. Balasubramanian, A. Reynolds, T. J. Blair and M. Khalil, Chem. Phys., 2019, 519, 38–44 CrossRef CAS.
- J. D. Gaynor and M. Khalil, J. Chem. Phys., 2017, 147, 094202 CrossRef.
Footnote |
| † Electronic supplementary information (ESI) available: Experimental and computational methods, computational results, UV/Vis spectra, IR pump-IR probe transient absorption spectra. See DOI: https://doi.org/10.1039/d4cc03427a |
| This journal is © The Royal Society of Chemistry 2024 |


