 Open Access Article
Creative Commons Attribution 3.0 Unported Licence
Detecting single-point isomeric differences in polymer chains by MOF column chromatography†
Nobuhiko
Hosono
 *a,
Yu
Kono
a,
Nagi
Mizutani‡
b,
Daichi
Koga
b and
Takashi
Uemura
 *a
*a
aDepartment of Applied Chemistry, Graduate School of Engineering, The University of Tokyo, 7-3-1 Hongo, Bunkyo-ku, Tokyo 113-8656, Japan. E-mail: nhosono@g.ecc.u-tokyo.ac.jp; uemurat@g.ecc.u-tokyo.ac.jp
bDepartment of Advanced Materials Science, Graduate School of Frontier Sciences, The University of Tokyo, 5-1-5 Kashiwanoha, Kashiwa, Chiba 277-8561, Japan
First published on 29th October 2024
Abstract
Liquid chromatography with a metal–organic framework (MOF) as the stationary phase enables nanopore threading-based recognition of polymers and identification of single-point isomeric structural differences in the polymer main chain. The polymer adsorption affinity to the MOF and transient kinetics of polymer insertion into the nanopores play crucial roles in the recognition process.
Advancements in polymer chemistry have led to increasingly complex polymer structures, heightening the need for precise separation techniques. Liquid chromatography (LC) remains the most widely used method for polymer separation and analysis.1 However, distinguishing polymers with microstructural differences using traditional LC modes, such as the normal/reverse phase, interaction, and size-exclusion, is challenging. These modes typically recognise the physical properties of the entire molecule rather than directly accessing the chemical structure of the polymer chain. This limitation necessitates the development of new separation principles capable of targeting the local structures of polymer chains to detect the differences, mutations, and errors hidden within large macromolecular structures.
Metal–organic frameworks (MOFs) are porous crystalline compounds formed via the self-assembly of organic ligands and metal ions.2,3 They are unique considering that various characteristics, such as the pore size, channel structure, and pore environment, can be tailored by adjusting the structure of the selected molecular components.4,5 Owing to their highly flexible design, nearly 105 MOFs have been synthesised,6 with applications in a wide range of areas, including gas separation and storage,7,8 heterogeneous catalysis,9,10 and sensing.11,12 These features have also been utilised in studies using MOFs as the stationary phase in LC, primarily to separate low molecular weight (MW) compounds such as hydrocarbons,13–18 aromatics,19–22 fullerenes,23 and racemates.24,25
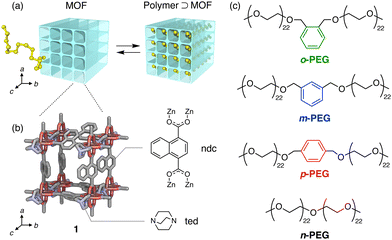
We recently demonstrated that MOF nanopores are promising for the polymer recognition of macromolecules.26,27 We successfully separated polymers based on their adsorption to MOFs using a MOF-packed column; this method recognises even slight structural differences at the polymer termini28 or in their topology29 during the adsorption equilibrium of the polymer chain into the MOF nanopores,30 resulting in varying retention times on the LC chromatograms (Fig. 1(a)). However, the capability of MOFs to detect extremely subtle structural mutations in the middle of a polymer chain remains unclear, which has been a long-standing challenge in polymer chemistry and analysis.
In this study, we demonstrated that an LC column filled with the MOF [Zn2(ndc)2(ted)]n (hereafter referred to as 1; ndc = 1,4-naphthalenedicarboxylate, ted = triethylenediamine) (Fig. 1(b) and Fig. S1, S2, ESI†)31 can identify a single-point phenyl mutation and its isomeric differences in the middle of a polyethylene glycol (PEG) chain (Fig. 1(c)). This was achieved by leveraging a nanopore threading-based adsorption process at the liquid/solid interface of the MOF stationary phase (Fig. 1(a)).
We prepared three PEGs (o-, m-, and p-PEG) as model polymers with a single xylene moiety positioned at the exact centre of the chain (Fig. 1(c) and Fig. S3, Table S1, ESI†). These PEGs differ in the substitution position of the xylene moiety, which can be ortho, meta, or para-substituted. Notably, their total molecular weight (Mn ∼ 2000 g mol−1) and chemical compositions were identical because they were derived from the same monofunctionalised PEG precursor (Mn ∼ 1000 g mol−1) via coupling either o-, m-, or p-dibromoxylene (see ESI†). For comparison, we also prepared non-functionalised PEG (n-PEG) with the same molecular weight using the same PEG precursor (Fig. 1(c)). These PEGs demonstrated negligible differences in the retention times when analysed using typical size-exclusion chromatography (SEC), indicating that they have identical hydrodynamic size owing to their structural similarity (Fig. S3, ESI†).
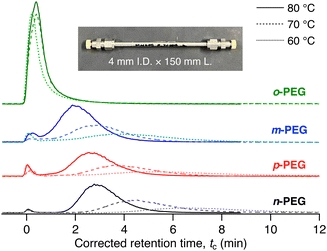
MOF 1 has pseudo-one-dimensional (1D) pores of diameter 0.57 nm (Fig. 1(b))31 that can accommodate PEG chains, as reported in our previous study.30,32 The adsorption of PEG chains into the narrow 1D pores occurs spontaneously, accompanied by a conformational change in the PEG to an elongated form, despite its radius of gyration (Rg) being approximately 1.5 nm (for PEG with a molecular weight of 2000 g mol−1),33 which exceeds the pore diameter of 1. Under these conditions, we anticipated that the xylene unit would impede the insertion and diffusion of the entire PEG chain into the pores, owing to the narrow pore diameter, leading to separation. We prepared a 1-packed column of dimensions 4 mm I.D. × 150 mm L using the same method as previously reported (see ESI†).28,34 We used the column on an HPLC system to analyse the four PEGs with N,N-dimethylformamide (DMF) as the eluent at 80 °C with a flow rate of 1.0 mL min−1. Notably, the PEGs eluted from the 1 column at different retention times in the following order: o-PEG (tc = 0.40 min) < m-PEG (tc = 2.02 min) < p-PEG (tc = 2.63 min) < n-PEG (tc = 2.87 min) (tc: corrected retention time) (Fig. 2 and Table S2, ESI†), demonstrating that the detection of a single-point mutation in the PEG chain and discrimination of its substitution modes were achieved using the MOF column.
 | ||
| Fig. 2 HPLC chromatograms for o-PEG (green), m-PEG (blue), p-PEG (red), and n-PEG (black) on the 1-packed column using DMF as the eluent at 80 °C (solid line), 70 °C (dashed line), and 60 °C (dotted line). The inset is a photograph of the 1-packed column, demonstrating the dimensions. tc denotes the corrected retention time, tc = tR − t0, where tR is the retention time and t0 is the column hold-up time. For more detailed measurement conditions, see ESI.† A small front peak near t0 is considered a breakthrough peak, which is occasionally observed in LC under certain conditions (see Fig. S4 in ESI†).35,36 | ||
Among the tested PEGs, o-PEG exhibited a significantly lower affinity for the 1 column, with the fastest tc of 0.40 min. To further investigate the interaction of each PEG with the stationary phase, we conducted an additional analysis by varying the column temperatures from 60 °C to 80 °C (Fig. 2). At higher temperatures, the m-, p-, and n-PEGs demonstrated decreased retention times, which is consistent with previous findings indicating that PEG adsorption onto 1 is an exothermic process.30,32 However, the retention time of o-PEG remained unchanged despite being at higher temperatures, suggesting that o-PEG cannot effectively interact with stationary phase 1. This may be owing to the bulkier ortho-substituted xylene unit hindering the insertion of the PEG chain into the MOF nanopores.
Notably, the retention behaviour changed with the eluent flow rate. At a slower flow rate of 0.1 mL min−1, o-PEG demonstrated a significant temperature dependence for its retention in the column (Fig. S4, ESI†). This observation indicates that the adsorption of o-PEG was not fully in equilibrium at higher flow rates. Thus, in addition to the thermodynamic factors, polymer insertion kinetics also play an important role in determining the retention behaviour and selectivity of polymers on the MOF column.
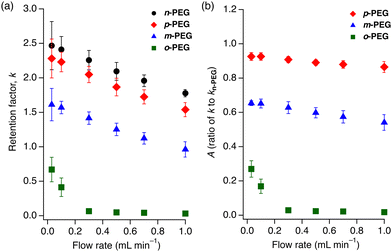
These findings led us to explore the relationship between the PEG retention and eluent flow rate. We calculated the retention factors, k = (tR − t0)/t0, where tR is the retention time and t0 is the hold-up time, for the four PEGs on the 1 column at six different flow rates (0.03, 0.1, 0.3, 0.5, 0.7, and 1.0 mL min−1). All PEGs showed a decrease in k as the flow rate increased. Notably, o-PEG displayed the strongest flow-rate dependence among the tested PEGs (Fig. 3(a)), with almost no retention at higher flow rates and a sharp increase in k below 0.1 mL min−1. In contrast, m-, p-, and n-PEGs showed modest, steady decreases in k as the flow rate increased (Fig. 3(a)).
 | ||
| Fig. 3 Flow rate dependence of (a) k for n-PEG (black circles), p-PEG (red diamonds), m-PEG (blue triangles) and o-PEG (green squares); and (b) A (k/kn-PEG) for p-PEG (red diamonds), m-PEG (blue triangles), and o-PEG (green squares). A is a k ratio of the functionalised PEG to n-PEG. Eluent: DMF at 80 °C. The measurement conditions are identical to those employed in Fig. 2. | ||
Theoretically, the retention factor (k) should remain constant regardless of the eluent flow rate. However, the observed k values for the PEGs varied with flow rate (Fig. 3(a)). This variation could be attributed to the slow kinetics of polymer insertion into the MOF nanopores,30 preventing the adsorption equilibrium from being fully established under the given flow and temperature conditions. To show the ability of the column to recognise microstructural differences, we calculated the k ratios of the functionalised PEGs to the non-functionalised n-PEG (A = k/kn-PEG) at different flow rates (Fig. 3(b)). The A value remained constant across the tested flow rates for m-PEG and p-PEG; only o-PEG exhibited a pronounced flow-rate dependence. The A value, which indicates the separation factor relative to n-PEG, demonstrated a significant increase in the selectivity at higher flow rates owing to the deviation of o-PEG from the thermodynamic retention trend. This indicates that a faster eluent flow facilitates the separation of o-PEG over the other PEG derivatives.
The flow-rate dependence of o-PEG suggests that the steric hindrance at the midpoint of o-PEG impedes its diffusion and insertion into the pores of 1, resulting in a weaker overall interaction between the polymer and MOF. Namely, PEGs with bulkier substituents do not have sufficient time to fully access the MOF nanopores to maximise interactions under faster eluent flow conditions. This effect enabled the exceptional separation of what can be described as “isomers” of polymers. This discovery offers a groundbreaking perspective in polymer chemistry, as the concept of structural isomers has rarely been considered for polymeric compounds because such subtle differences in a large molecule cannot be identified and separated using existing methods.
A previous study reported a similar flow-rate dependence in a MOF column using UiO-66 as the stationary phase for separating low molecular weight compounds.37 The UiO-66 column exhibited varying selectivities for alkylbenzenes and polycyclic aromatic hydrocarbons, depending on the eluent flow rate. Although the exact separation mechanism was not fully understood, the separation was attributed to molecular diffusion within the micropores of UiO-66 through its narrow windows. Molecules larger than these pores are excluded from entering the MOF, leading to weak retention on the column. This effect is similar to that in SEC, where smaller molecules can access a greater portion of the adsorbent pores, resulting in a stronger retention than bulkier molecules. We believe that this diffusional effect was significantly amplified in our polymer/MOF system, enabling the exceptional separation of polymers.
To confirm the differences in PEG diffusion during the adsorption process, we measured the adsorption kinetics of o-, m-, and p-PEG into 1 in the solution phase (Fig. S5, ESI†). We dispersed the particles of 1 in an ethanol solution of each PEG at 40 °C and monitored the PEG concentration in the supernatant using 1H NMR (see ESI†). The time evolution of PEG adsorption clearly depended on the substitution position of the central xylene unit, demonstrating the following trend: p-PEG > m-PEG > o-PEG (Fig. S5, ESI†). This suggests that straight chains are more likely to enter the pores, leading to more effective interactions with the MOF.
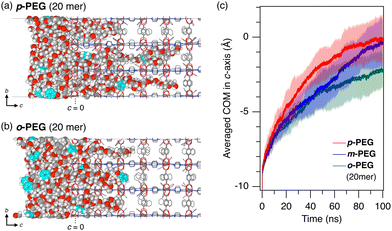
Furthermore, molecular dynamics (MD) simulations confirmed the observed trend in the diffusion kinetics of o-, m-, and p-PEG (Fig. 4). To highlight the diffusional differences and reduce the calculation cost, we considered the infiltration of molten PEG into 1 under neat conditions at 393 K in the MD simulation. We also shortened the length of the model PEGs to 20 mer (HO(CH2CH2O)10CH2C6H4CH2O(CH2CH2O)10H, see ESI†) to accelerate the simulations. The 100-ns initial infiltration from the surface of 1 was simulated for the respective PEG models. The centre of mass (COM) of each PEG molecule was calculated and the average COM on the c-axis of 1 was plotted as a function of the simulation time, as shown in Fig. 4(c) (Fig. S6, ESI†). The results showed that p-PEG diffused more quickly through the nanopores of 1, whereas o-PEG diffused the slowest, likely owing to the higher energy barrier faced by the ortho-xylene centre when entering the 1D pore compared with the more linear-shaped xylene centres in other PEGs. These diffusional differences, as demonstrated by the experiments and simulations, provide a reasonable explanation for the kinetics-driven selectivity observed in the 1 column. In the MD simulations, m-PEG exhibited intermediate behaviour between o-PEG and p-PEG, with a slightly different diffusion pattern (Fig. 4(c)). It demonstrated a slow diffusion similar to that of o-PEG at the start of insertion but then nearly accelerated to that of p-PEG by the end of the 100-ns simulation. This suggests the presence of an energy barrier when entering the pores from the surface, followed by a pore diffusion comparable to that of p-PEG.28
 | ||
| Fig. 4 Representative MD snapshots of (a) p-PEG and (b) o-PEG after 100-ns infiltration from the ab surface of 1 at 393 K; shortened versions of the PEGs were used (20 mer). For more detailed simulation conditions, see ESI.† The framework of 1 and PEGs are depicted using wireframes and space-filling models, respectively. Hydrogen atoms of the framework are omitted for clarity. Xylene unit in the PEG chain is coloured aqua blue. (c) Time evolution of the averaged COM of p-PEG (red), m-PEG (blue), and o-PEG (green) in the c-axis of 1. The origin (c = 0) is defined as the COM of Zn dimers of the paddle wheel cluster at the PEG/1 interface. Averaged data from the five MD simulation runs are plotted as solid lines with shaded error bands of σ (N = 5). | ||
On the 1 column, p-PEG and m-PEG showed the same slope of the flow-rate dependence (Fig. 3(a)), while showing a significant difference in their k values. This suggests that kinetics-driven selectivity alone cannot fully explain the observed differences in the retention behaviour. Thus, their separation behaviour not only likely stems from the kinetic factors, but also from the thermodynamic factors of the PEG adsorption in 1. This difference may be owing to the conformational change required for the adsorption of m-PEG, which has a kinked configuration at the central xylene unit, into the narrow 1D pores of 1. This introduces a potential energy loss for the adsorption of m-PEG, leading to a weaker interaction with 1 than that of p-PEG. Further investigation is required to fully understand the nanopore-threading separation mechanism in MOF column chromatography, and comprehensive kinetic and thermodynamic analyses will be presented in future studies.
In conclusion, we revealed the unprecedented ability of a MOF-packed LC column to successfully separate PEGs based on the microstructural differences in their main chains. Our findings indicate that the separation mechanism is strongly influenced by kinetic factors, which leads to flow-rate-dependent selectivity, enhancing the separation performance of the MOF column and enabling it to detect single-point mutations and even more fine “isomeric” differences in polymer structures. This study highlighted the potential of MOF columns for recognising various microstructures in polymers. By incorporating the flow rate as a key parameter in the separation analysis with MOF columns, more diverse and advanced macromolecule separation techniques can be foreseen. Future developments in MOF-based nanopore-threading recognition will enable the separation of biomacromolecules, such as DNA and peptides, with minor structural differences.
This work was supported by JSPS KAKENHI Grant Numbers JP24K01535, JP24K21817, 22KJ0643, and JP21H04687. It was also supported by MEXT KAKENHI, grant Number JPMXP1122714694 (Data Creation and Utilization-Type Material Research and Development Project), and Japan Science and Technology Agency (JST) as part of Adopting Sustainable Partnerships for Innovative Research Ecosystem (ASPIRE), grant number JPMJAP2315. The authors thank Dr. Masayoshi Takayanagi (The Institute of Statistical Mathematics) for his guidance in constructing the force field dataset of 1 for the MD simulations, which were conducted using the facilities of the Supercomputer Center, the Institute for Solid State Physics, the University of Tokyo and the SuperComputer System, Institute for Chemical Research, Kyoto University.
Data availability
The data supporting this article have been included as part of the ESI.†Conflicts of interest
There are no conflicts to declare.References
- E. Uliyanchenko, S. van der Wal and P. J. Schoenmakers, Polym. Chem., 2012, 3, 2313–2335 RSC.
- S. Kitagawa, R. Kitaura and S. Noro, Angew. Chem., Int. Ed., 2004, 43, 2334–2375 CrossRef PubMed.
- M. J. Kalmutzki, N. Hanikel and O. M. Yaghi, Sci. Adv., 2018, 4, eaat9180 CrossRef PubMed.
- O. Yaghi, M. O’keeffe, N. Ockwig, H. Chae, M. Eddaoudi and J. Kim, Nature, 2003, 423, 705–714 CrossRef PubMed.
- H. Jiang, D. Alezi and M. Eddaoudi, Nat. Rev. Mater., 2021, 6, 466–487 CrossRef.
- P. Z. Moghadam, A. Li, S. B. Wiggin, A. Tao, A. G. P. Maloney, P. A. Wood, S. C. Ward and D. Fairen-Jimenez, Chem. Mater., 2017, 29, 2618–2625 CrossRef.
- H. Wang, Q.-L. Zhu, R. Zou and Q. Xu, Chem, 2017, 2, 52–80 Search PubMed.
- B. Li, H.-M. Wen, W. Zhou, J. Q. Xu and B. Chen, Chem, 2016, 1, 557–580 Search PubMed.
- H. G. T. Ly, G. Fu, A. Kondinski, B. Bueken, D. D. Vos and T. N. Parac-Vogt, J. Am. Chem. Soc., 2018, 140, 6325–6335 CrossRef PubMed.
- L. Zhang, X. Shi, Z. Zhang, R. P. Kuchel, R. Namivandi-Zangeneh, N. Corrigan, K. Jung, K. Liang and C. Boyer, Angew. Chem., Int. Ed., 2021, 60, 5489–5496 CrossRef PubMed.
- Z. Meng, R. M. Stolz, L. S. D. Moraes, C. G. Jones, A. M. Eagleton, H. M. Nelson and K. A. Mirica, Angew. Chem., Int. Ed., 2024, 63, e202404290 CrossRef PubMed.
- L. E. Kreno, K. Leong, O. K. Farha, M. Allendorf, R. P. V. Duyne and J. T. Hupp, Chem. Rev., 2012, 112, 1105–1125 CrossRef PubMed.
- Z.-Y. Gu, C.-X. Yang, N. Chang and X.-P. Yan, Acc. Chem. Res., 2012, 45, 734–745 CrossRef.
- S.-S. Liu, C.-X. Yang, S.-W. Wang and X.-P. Yan, Analyst, 2012, 137, 816–818 RSC.
- J. Zhang, J. Chen, S. Peng, S. Peng, Z. Zhang, Y. Tong, P. W. Miller and X.-P. Yan, Chem. Soc. Rev., 2019, 48, 2566–2595 RSC.
- A. A. Kotova, D. Thiebaut, J. Vial, A. Tissot and C. Serre, Coord. Chem. Rev., 2022, 455, 214364 CrossRef.
- K. Yusuf, A. Aqel and Z. ALOthman, J. Chromatogr. A, 2014, 1348, 1–16 CrossRef.
- S. V. der Perre, A. Liekens, B. Bueken, D. E. D. Vos, G. V. Baron and J. F. M. Denayer, J. Chromatogr. A, 2016, 1469, 68–76 CrossRef.
- M. Maes, F. Vermoortele, L. Alaerts, S. Couck, C. E. A. Kirschhock, J. F. M. Denayer and D. E. D. Vos, J. Am. Chem. Soc., 2010, 132, 15277–15285 CrossRef.
- L. Alaerts, M. Maes, L. Giebeler, P. A. Jacobs, J. A. Martens, J. F. M. Denayer, C. E. A. Kirschhock and D. E. D. Vos, J. Am. Chem. Soc., 2008, 130, 14170–14178 CrossRef.
- L. Alaerts, M. Maes, M. A. van der Veen, P. A. Jacobs and D. E. D. Vos, Phys. Chem. Chem. Phys., 2009, 11, 2903–2911 RSC.
- C.-X. Yang and X.-P. Yan, Anal. Chem., 2011, 83, 7144–7150 CrossRef.
- C.-X. Yang, Y.-J. Chen, H.-F. Wang and X.-P. Yan, Chem. – Eur. J., 2011, 17, 11734–11737 CrossRef PubMed.
- M. Zhang, X.-D. Xue, J.-H. Zhang, S.-M. Xie, Y. Zhang and L.-M. Yuan, Anal. Methods, 2013, 6, 341–346 RSC.
- H. Jiang, K. Yang, X. Zhao, W. Zhang, Y. Liu, J. Jiang and Y. Cui, J. Am. Chem. Soc., 2021, 143, 390–398 CrossRef.
- N. Hosono and T. Uemura, Matter, 2020, 3, 652–663 CrossRef.
- N. Hosono and T. Uemura, Acc. Chem. Res., 2021, 54, 3593–3603 CrossRef.
- N. Mizutani, N. Hosono, B. Le Ouay, T. Kitao, R. Matsuura, T. Kubo and T. Uemura, J. Am. Chem. Soc., 2020, 142, 3701–3705 CrossRef PubMed.
- T. Sawayama, Y. Wang, T. Watanabe, M. Takayanagi, T. Yamamoto, N. Hosono and T. Uemura, Angew. Chem., Int. Ed., 2021, 60, 11830–11834 CrossRef.
- N. Oe, N. Hosono and T. Uemura, Chem. Sci., 2021, 12, 12576–12586 RSC.
- H. Chun, D. N. Dybtsev, H. Kim and K. Kim, Chem. – Eur. J., 2005, 11, 3521–3529 CrossRef PubMed.
- B. Le Ouay, C. Watanabe, S. Mochizuki, M. Takayanagi, M. Nagaoka, T. Kitao and T. Uemura, Nat. Commun., 2018, 9, 3635 CrossRef.
- K. A. Rubinson and S. Krueger, Polymer, 2009, 50, 4852–4858 CrossRef.
- K. Kioka, N. Mizutani, N. Hosono and T. Uemura, ACS Nano, 2022, 16, 6771–6780 CrossRef PubMed.
- S. Chapel, F. Rouvière, V. Peppermans, G. Desmet and S. Heinisch, J. Chromatogr. A, 2021, 1653, 462399 CrossRef.
- X. Jiang, A. van der Horst and P. J. Schoenmakers, J. Chromatogr. A, 2002, 982, 55–68 CrossRef CAS.
- A. Peristyy, P. N. Nesterenko, A. Das, D. M. D’Alessandro, E. F. Hilder and R. D. Arrua, Chem. Commun., 2016, 52, 5301–5304 RSC.
Footnotes |
| † Electronic supplementary information (ESI) available: Synthesis of compounds, powder X-ray diffractions, microscopy images, chromatograms, and adsorption kinetics data. See DOI: https://doi.org/10.1039/d4cc04902k |
| ‡ Present address: AIST Chubu, National Institute of Advanced Industrial Science and Technology, 4-205, Sakurazaka, Moriyama-ku, Nagoya, Aichi 463-8560, Japan. |
| This journal is © The Royal Society of Chemistry 2024 |

