Combining high energy ball milling and liquid crystal templating method to prepare magnetic ordered mesoporous silica. A physico-chemical investigation†
Alessandra
Scano
 *ae,
Edmond
Magner
 b,
Martina
Pilloni
a,
Luciano
Atzori
 a,
Marzia
Fantauzzi
 a,
Sawssen
Slimani
cd,
Davide
Peddis
 cde,
Gonzalo Garcia
Fuentes
f and
Guido
Ennas
 ae
ae
aDepartment of Chemical and Geological Sciences, University of Cagliari, SS 554 Bivio per Sestu, 09042, Monserrato, CA, Italy. E-mail: alessandra.scano@unica.it
bDepartment of Chemical Sciences, Bernal Institute, University of Limerick, V94 T9PX, Limerick, Ireland
cChemistry and Industrial Chemistry Department, University of Genova, Via Dodecaneso 31, 16146-Genova, Italy
dInstitute of Structure of Matter – Consiglio Nazionale delle Ricerche, Monterotondo Stazione, 00016, Rome, Italy
eNational Interuniversity Consortium of Materials Science and Technology (INSTM), Via Giuseppe Giusti 9, 50121 Firenze, Italy
fAsociación de la Industria Navarra, Ctra. Pamplona, 1 – Edificio AIN, 31191 Cordovilla, Pamplona, Spain
First published on 11th January 2024
Abstract
The physico-chemical investigation of superparamagnetic MCM41 like materials prepared by the novel combination of high energy ball milling and a liquid crystal templating method is presented. Structural, morphological, textural, thermal, and preliminary magnetic characterization demonstrated the successful combination of the two synthesis techniques, avoiding the problems associated with the current methods used for the preparation of magnetic ordered mesoporous silica. MCM41 like materials with high specific surface area values (625–720 m2 g−1) and high mesopore volumes in the range 1–0.7 cm3 g−1 were obtained. The ordered mesoporous structure and accessible pores were maintained after the inclusion of increasing amounts of the magnetic component in the silica structure. All the samples showed superparamagnetic behaviour.
1. Introduction
The successful application of biological entities such as enzymes, antibodies, and other proteins as well as whole cells in biotechnology is dependent on the ability to successfully stabilise the biological component, in what is often an unnatural environment, while retaining its function and activity. This stabilisation is frequently achieved by entrapment or immobilisation in organic and inorganic structures. The successful immobilisation depends on the type of support, activation method and coupling procedure (Scheme 1).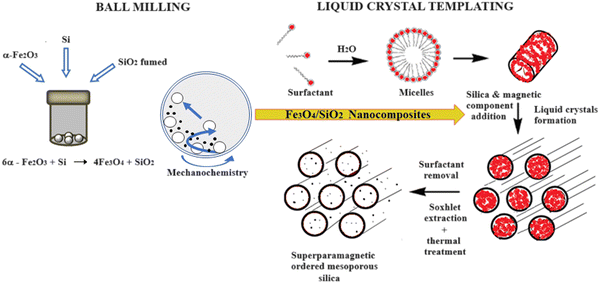 | ||
| Scheme 1 Synthesis scheme for the preparation of superparamagnetic ordered mesoporous silica materials by a combination of ball milling and liquid crystal templating methods. | ||
Ordered mesoporous silica (OMS) materials have been extensively examined as supports for the immobilisation of biological entities such as proteins or enzymes as they possess high surface areas, large pore volumes, uniformity, and tailorable pore size distributions.1–4 Magnetic monodomains have also received considerable interest because of their superparamagnetic behaviour – they are attracted to a magnetic field without retention of residual magnetism after the field removal.5–10 However, the direct use of magnetic nanoparticles (Mag-NPs) for immobilisation of biological entities on the surface of the particles implies some stability and activity problems being exposed to environmental factors, such as temperature, pH and protease that can induce their denaturation.11 Thus, the combination of Mag-NPs and OMS to obtain magnetic OMS (Mag–OMS) is of interest as they not only provide large surface areas for high loading of biocatalysts, but also the ability to be easily separated from the reaction mixture by means of the application of an external magnetic field.12–14 Moreover, typical Mag-NPs aggregation will be avoided by embedding them in the silica matrix, while increasing the biocompatibility and chemical stability of the final material.15 Mag–OMS materials that combine the advantages of OMS and Mag-NPs open new opportunities to generate multifunctional platforms with applications in areas such as site-selective and controlled drug release. To this end, some requirements should be fulfilled. First, the Mag–OMS should show high saturation magnetisation Ms, and high magnetic susceptibility to rapidly respond to an applied magnetic field. Therefore, no leaching of the magnetic component from the mesostructured silica should occur. The magnetic component should not occlude the mesoporous structure which has to be accessible to the host biomolecules. The fulfilment of these features is directly connected to the chosen Mag–OMS synthesis method. Literature reports describe three main preparation methods: (i) post-loading,16,17 (ii) co-nanocasting,18 and (iii) sol–gel coating.19 Each method possesses drawbacks (Table 1), such as the obstruction of the mesopores by the magnetic nanoparticles in the post-loading method, the degradation of the magnetic component due to strong acidic working media in co-nanocasting or the small mesopore size (∼3.0 nm) obtained by the sol–gel method.20 Moreover, all of the above-mentioned methods suffer from the low quantities of Mag-NPs that can be synthesised (around 100–300 mg), limiting the large-scale application of Mag–OMS.21 Thus, the preparation of materials with high magnetization, high surface area and pore volume is still a challenge. We propose a novel approach that combines the “solid state method” high energy ball milling (HEBM) and the liquid-crystal templating method (LCT) to obtain magnetic MCM41 like supports (M_MCM41) for the immobilisation of biological entities (Scheme 1).22
| Preparation method | Method description | Method drawbacks | Ref. |
|---|---|---|---|
| Post-loading method | Loading of magnetic NPs into pre-synthesized mesoporous materials by the impregnation of the mesoporous silica using iron precursors in solution, followed by the in situ precipitation of the magnetic NPs inside the pores. | Obstruction of the pores of the host silica-based materials by the magnetic NPs; very low surface area, low pore volume, and poor accessibility of the pores. | 16 and 17 |
| Nano-casting method | Impregnation of the mesoporous material during its preparation with an iron oxide precursor, and in situ conversion of the precursor species in the mesopore channels, followed by the removal of the surfactant template. | Possible degradation of the magnetic component due to the surrounding media (i.e., strong acidic media). | 18 |
| Sol–gel method | Deposition of an ordered mesostructured layer on the surface of the magnetic NPs via the hydrolysis and condensation of silica precursors in the presence of a template that is subsequently removed. | Small pore size. | 19 |
HEBM, an interesting technique from both a practical and an economical point of view, was used to prepare magnetite–silica nanocomposites (Fe3O4/SiO2 NCs) with different SiO2 amounts.23 Then, these nanocomposites were used as the source of both silica and magnetic components in the preparation of MCM41-like materials according to the LCT mechanism. Literature reports have described the use of the HEBM technique for the preparation of various nanomaterials24–26 but to the best of our knowledge, not for the synthesis of Fe3O4/SiO2 nanocomposites or for the preparation of magnetic MCM41-like materials.
Here, we describe a detailed physico-chemical investigation of the M_MCM41-like materials prepared in our laboratory, correlating the material features to the amount of the magnetic component in the samples and to the starting Fe3O4/SiO2 nanocomposite chosen. Our magnetic ordered mesoporous silica not only has a large surface area and pore volume which are not affected by the increasing amount of the magnetic component, but also possesses superparamagnetic behaviour. The latter is surely correlated with the amount of silica in the starting Fe3O4/SiO2 NC.
2. Materials and methods
2.1. Chemicals
All the reagents were used without further purification. Hematite (α-Fe2O3, 99.9%) was purchased from Carlo Erba. Silicon (Si, 99.9%) was obtained from Fluka. Fumed silica (SiO2, 99.8%), cetyltrimethylammonium bromide (CTAB, 99%), ammonia aqueous solution (NH3, 28.0%), tetrametylammonium hydroxide pentahydrate (TMAOH·5H2O, 97%), methanol, and ethanol were purchased from Sigma-Aldrich. Ultrapure water (18.2 MΩ cm) was obtained from a Millipore Milli-Q water purification system.2.2. Synthesis of Fe3O4/SiO2 nanocomposites
Fe3O4/SiO2 nanocomposites with different SiO2 amounts were prepared by a high energy ball milling (HEBM) technique, according to the following equation:21| 6α-Fe2O3 + Si → 4Fe3O4 + SiO2 |
2.3. Synthesis of magnetic-MCM41-like material
Magnetic MCM41 materials (M_MCM41) were synthesised by using fumed SiO2 and different amounts of Fe3O4/SiO2 6, 20 or 50% nanocomposites (Table 2), according to the LCT method reported in the literature27 and using a novel composition recently published by the authors,28 which was adapted to include the magnetic component.| Sample | Fe3O4 (wt %) | SSA (m2 g−1) | V p (cm3 g−1) | d 100 spacing (nm) | a 0 (nm) | D p (BET) (nm) | D w (nm) |
|---|---|---|---|---|---|---|---|
| Fumed silica | — | 203 | 0.93 | — | — | 2.82 | — |
| MCM41 | — | 1039 | 1.30 | 4.41 | 5.09 | 2.90 | 2.19 |
| 1M_MCM41 | 4 | 625 | 1.04 | 4.16 | 4.80 | 2.80 | 2.00 |
| 2M_MCM41_6 | 13 | 640 | 0.62 | 4.01 | 4.63 | 2.54 | 2.09 |
| 2M_MCM41_20 | 13 | 636 | 0.64 | 3.87 | 4.47 | 2.24 | 2.23 |
| 2M_MCM41_50 | 13 | 720 | 0.73 | 4.05 | 4.68 | 2.41 | 2.27 |
In a typical synthesis procedure, cetyltrimethylammonium bromide – CTAB (3.6500 g) was dissolved in 18.0 mL of Milli-Q water and stirred for 2 h, at 35 °C to obtain the template solution. 1.3 mL of an aqueous NH3 (28.0 wt%) solution was added dropwise to the resultant clear surfactant solution that was then stirred for 30 minutes. Independently, dispersions of different amounts of the Fe3O4/SiO2 NCs and fumed SiO2 (Table 2), 6.0 mL of water and 7.11 mL of tetramethylammonium hydroxide (TMAOH) aqueous solution (25.0 wt%) were prepared and mixed with the template solution, stirring the final mixture for 1 h at 55 °C.
The resulting gel was transferred into a Teflon®-lined stainless-steel autoclave and aged in an oven at 100 °C for 4 days. After cooling to room temperature, the precipitate was recovered by filtration, washed with a hydroalcoholic solution (190 mL of methanol + 10 mL of Milli-Q water), and dried at room temperature for 12 h. The template was removed by Soxhlet extraction in ethanol for 12 h and then dried in air for 12 h. The final samples were then thermally treated in a home-made quartz tubular oven at a temperature of 410 °C for 30 minutes under argon flux to remove any residual surfactant. It is in accordance with the fact that CTAB is more difficult to be removed after synthesis than other surfactants.29
The following samples were prepared:
1M_MCM41 – synthesised using the Fe3O4/SiO2_6 nanocomposite to obtain a magnetic component final content of 4 wt%;
2M_MCM41_6 – synthesised using the Fe3O4/SiO2_6 nanocomposite to obtain a magnetic component final content of 13 wt%;
2M_MCM41_20 – synthesised using the Fe3O4/SiO2_20 nanocomposite to obtain a magnetic component final content of 13 wt%;
2M_MCM41_50 – synthesised using the Fe3O4/SiO2_50 nanocomposite to obtain a magnetic component final content of 13 wt%.
A further sample without magnetic component (labelled as MCM41) was also prepared with the same synthesis conditions to be used for comparison.28
2.4. Characterization of Fe3O4/SiO2 NCs and magnetic-MCM41 like materials
The structural characterization of the nanocomposites was carried out using X-ray powder diffraction (XRPD). The XRPD patterns were collected by a Siemens D500 diffractometer with MoKa radiation, in the Bragg–Brentano geometry in the range 5 < 2θ < 45° with steps of 0.05° and a counting time of 16 s per step. Qualitative analysis of XRPD patterns was determined using the PDF database (PCPDF-WIN, JCPDS-International Center for Diffraction Data, Swarthome, PA). The milling process was monitored at different milling times.For the structural characterization of the magnetic-MCM41 like materials, a Philips X’pert PRO MPD instrument was employed using the Cu Kα line at 1.542 Å, in the low angle range of 1–6 2θ degrees, with a step size of 0.025 2θ degrees operated at 40 kV and a current of 35 mA, collecting enough counts for each step to optimise the signal/noise ratio. The main interplanar distance (d100 spacing) has been deduced for each sample from the XRPD analysis using eqn (1):30
| d100 = λ/2sen100 | (1) |
| a0 = 2d100/√3 | (2) |
Nitrogen gas sorption measurements were also performed using an ASAP 2020 apparatus operating at 77 K. The samples were pre-heated to 150 °C under vacuum for 24 h. The pore size distribution was obtained by the thermodynamically based Barret–Joyner–Halenda (BJH) method using adsorption and desorption branches of the nitrogen isotherm, taking into consideration the artefact coming from the BJH-desorption, due to the tensile strength effect.31 The total pore volume for each sample was obtained by the single point adsorption at p/p0 = 0.99.32,33 The surface areas were calculated by the Brunauer–Emmett–Teller (BET) equation according to consistency criteria.34
XRPD with BJH data was also used to obtain the value of the medium wall-thickness (Dw), by eqn (3):35
| Dw = a0 − Dp | (3) |
![[thin space (1/6-em)]](https://www.rsc.org/images/entities/char_2009.gif) :
:![[thin space (1/6-em)]](https://www.rsc.org/images/entities/char_2009.gif) 2010. The spectra were acquired in the standard lens mode and the emission angle was 53°.
2010. The spectra were acquired in the standard lens mode and the emission angle was 53°.
To compensate for sample charging, a flood-gun neutralizer was used. The binding energy scale was referenced to the aliphatic C 1s at 285.0 eV.
Transmission electron microscopy (TEM) was used to study the morphology of both the nanocomposites and the magnetic-MCM41 like material. Microscopy observations were carried out using a JEOL CX200 (JEOL USA, Inc.) operating at 200 kV. The samples were dispersed in octane in an ultrasonic bath and dropped onto a conventional carbon-coated copper grid.
Surface morphology and chemical composition were determined by field emission scanning electron microscopy (FE-SEM) and energy dispersive spectroscopy (EDS) using a Hitachi S-4800 FE-SEM operating at 20 kV.
FTIR analysis was performed using a Bruker Tensor 27 spectrophotometer, equipped with a diamond-ATR accessory and a DTGS detector. 128 scans at a resolution of 2 cm−1 in the wave number range 4000–400 cm−1 were carried out.
Simultaneous Thermogravimetric and Differential Scanning Calorimetric analysis STG-DSC measurements were carried out using an STA6000 PerkinElmer instrument carried out under nitrogen or oxygen flow (40 mL min−1) with a 10 °C min−1 ramp rate. Different portions of the same sample were measured first in an oxygen atmosphere for monitoring the oxidation of magnetite and second in a nitrogen atmosphere to compare the thermal effect. Thermomagnetic (TMG) experiments were performed in the TGA-7 PerkinElmer instrument under argon flow (40 mL min−1), applying to the sample a small static magnetic field (∼20 mT). Variations in the sample magnetization with temperature are recorded as apparent weight changes in the sample. Temperature calibration of the TGA-7 and STA600 was checked by using the Curie points of nickel, perkalloy and iron standards. To delete the free water step/endo peak in the range of 25–100 °C, a preliminary isothermal step at 100 °C for 15 minutes was adopted for all thermal analysis experiments.
NH3 TPD analyses were performed on the magnetic-MCM41 like materials by using a TPD/R/O 1100 apparatus (ThermoQuest). In a typical test, the sample (0.050 g) was outgassed in a flow of pure He (30 cm3 min−1) at 300 °C for 1 h. After cooling at room temperature, the sample was saturated with pure NH3 through a pulse procedure. Then, the sample was purged with He (30 cm3 min−1) at 100 °C for 1 h to remove physisorbed ammonia. Finally, the TPD analysis was carried out under flowing He (30 cm3 min−1) while heating (10 °C min−1) from 100 °C to 800 °C (held for 1 h), and the species desorbed was monitored by a thermal conductivity detector (TCD) and a quadrupole mass spectrometer (Thermo Fisher Scientific) through which the presence of NH3 and H2O was investigated.
Preliminary DC magnetization measurements were performed using a superconducting quantum interference device (SQUID) magnetometer. The samples, in the form of powder, were fixed in a capsule, to prevent any movement of the powder during the measurements, and all the magnetic measurements were normalised by the real mass of the measured sample. The field dependence of the magnetization was measured at 300 K in the interval ± 5 T of the applied field. For the thermal dependence of magnetization, the zero-field cooled (ZFC) and field cooled (FC) procedures were carried out. For ZFC measurements, the sample is first cooled from room temperature to 5 K in zero field; then, the magnetization (MZFC) is recorded warming up from 5 to 300 K, applying a static magnetic field of 2.5 mT. With the same magnetic field applied, MFC was recorded during the cooling from 300 to 5 K.
3. Results
3.1. Fe3O4/SiO2 nanocomposites
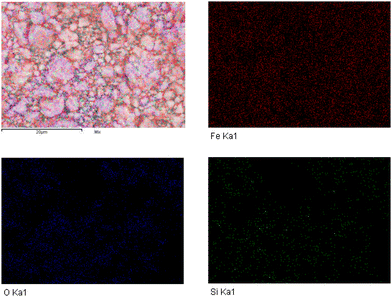
XRPD analysis showed the presence of characteristic Fe3O4 diffraction peaks and diffused haloes typical of a SiO2 amorphous phase in all the samples (Fig. 1). The presence of Fe3O4 as the only spinel phase in the nanocomposite was confirmed by TGA analysis in an oxidant atmosphere with an RT-650 °C ramp, which showed a progressive weight increment up to 103.42%. The average crystallite size of Fe3O4 was estimated to be 4.8 nm by the Scherrer equation36 The only difference between the three diffraction patterns is that the contribution of SiO2 haloes increases with the percentage of SiO2 in the NCs. This result is consistent with TEM and SEM observations. TEM bright field images in fact revealed the formation of Fe3O4/SiO2 agglomerates of irregular shapes due to the milling process with a size around 100–200 nm (Fig. 2a). In the TEM dark field mode, almost spherical Fe3O4 nanoparticles dispersed in the SiO2 matrix with a very narrow particle size distribution were visible (Fig. 2b). The selected area electron diffraction (SAED) pattern (Fig. 2c) confirmed the nanometric magnetite structure suggested by the XRPD data. FE-SEM and EDS analyses showed a uniform dispersion of the phases and a homogeneous distribution of elements in the sample surface (Fig. 3 and 4). During the milling process, energy is transferred from the balls to the powder. It causes the reduction of crystallite grain size and a variety of defects. The progressive dispersion and the intimate mixing at the atomic level, promoting the interdiffusion of the starting compounds, give rise to a solid-state reaction that evolves to the formation of Fe3O4 nanoparticles, homogeneously dispersed in the SiO2 matrix.37,38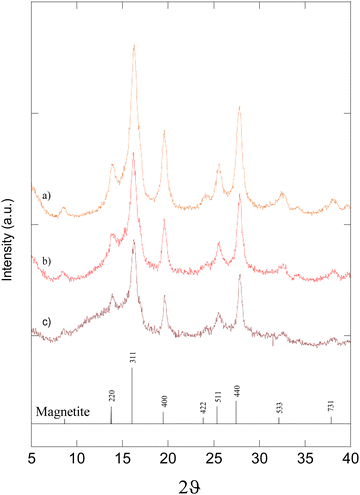 | ||
| Fig. 1 XRPD patterns of the Fe3O4/SiO2 nanocomposites: (a) 6-Fe3O4/SiO2 with 6.0 wt% of SiO2, (b) 20-Fe3O4/SiO2 with 20.0 wt% of SiO2, and (c) 50-Fe3O4/SiO2 with 50.0 wt% of SiO2, respectively. | ||
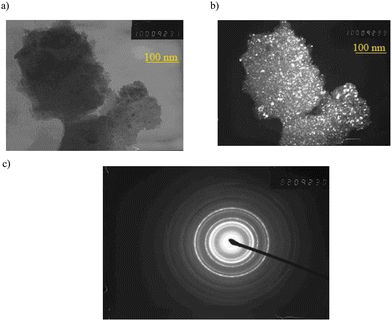 | ||
| Fig. 2 TEM micrographs of the nanocomposite at 6 wt% of SiO2: (a) bright field mode; (b) dark field mode; (c) SAED mode. | ||
3.2. Magnetic MCM41 like materials
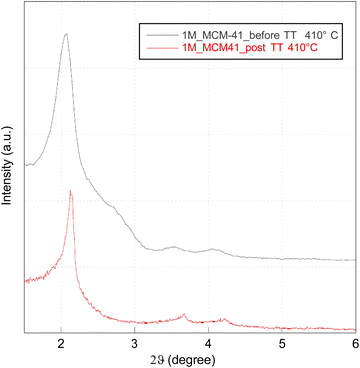
Magnetic MCM41 like materials (M_MCM41) with ordered mesoporous structures were obtained. XRPD low-angle measurements show the diffraction pattern typical of an MCM41 material with a hexagonal lattice structure arrangement, revealing the three main hkl diffraction lines (Fig. 5).32,39 The first (100) sharp diffraction line indicates a long-range order of a hexagonal lattice symmetry, while the higher angle signals (110) and (200) confirm the presence of a symmetrical hexagonal pore structure.32,39,40 In contrast to other recent studies reported in the literature, our data show that the ordered mesoporous structure was maintained even with the introduction of increasing amounts of the magnetic component. Moreover, the magnetic nanoparticles did not significantly affect the silica mesopores as demonstrated by the presence of well defined (110) and (200) diffraction lines in all samples.30,41 With respect to a standard MCM41 like material, the position of the sharp (100) diffraction line is slightly shifted to higher values, as shown in Fig. 5. This shift increased with the increment in the magnetic content. d100 interplanar spacing values and lattice mesoporous parameters (a0) were also calculated for each sample (Table 2), showing a decrease of both values with the increasing magnetic component content. This can be explained by a contraction of the unit cell due to the presence of the Mag-NPs in the silica structure and as a result of the thermal treatment at 410 °C, necessary for the complete removal of the template. The shift in fact was not observed prior to thermal treatment as shown in Fig. 6 for the 1M_MCM41 sample. Similarly, the d100 spacing and the a0 values were close to the ones obtained for the standard MCM41 sample. The contraction of the unit cell can also explain the decrease in Dw in the samples prepared with the Fe3O4/SiO2_6 NC. This is not observed in the 2M_MCM41_20 and 2M_MCM41_50 prepared with different starting NCs. While the pore diameter (Dp) is slightly decreased with respect to the standard MCM41 sample. The structural properties of the samples are listed in Table 2. Finally, some comments are mandatory regarding the intensity of the sharp 100 diffraction lines. A first decrease of the intensity is observable when comparing 1M_MCM41 and 2M_MCM41 samples indicating a better incorporation of Fe3O4/SiO2 nanocomposite in the mesoporous matrix of the 2M_MCM41_6 sample. The same trend is also visible in the rest of the 2M_MCM41 series, indicating a successful incorporation into the MCM41 structure of the nanocomposites containing the highest amount of silica.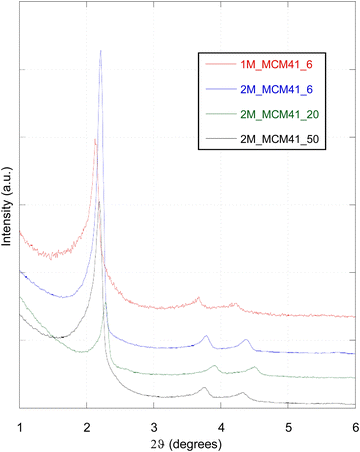 | ||
| Fig. 5 Low-angle X-ray powder diffraction patterns of the magnetic MCM41-like materials (M_MCM41 samples). | ||
The wide-angle diffraction patterns of the M_MCM41 samples show the typical halo of the amorphous silica together with low intensity Bragg peaks in the positions assigned to the Fe3O4 spinel structure (JCPDF card no. 19-0629) (Fig. 7). However, we cannot exclude the formation of γ-Fe2O3 after the thermal treatment for the template removal. The two spinel phases cannot be distinguished easily by standard X-ray diffraction techniques since they have a very similar crystal structure. Thermal analysis STG-DSC of 2M_MCM41 series carried out under an oxygen atmosphere and compared to the sample measured under the same conditions but with an inert nitrogen atmosphere indicates the oxidation of the sample in the range of 200–400 °C (Fig. 8). Despite the typical dihydroxylation of SiO2 observed in both thermograms, when working under an oxygen atmosphere, a significant bump in the temperature range of 200–400 °C is observed and confirmed by a simultaneous exothermic peak in the DSC thermogram. Such behaviour confirms the presence of magnetite in the M_MCM41 like samples. After the oxygen thermal treatment, a hematite phase was present in the XRPD pattern (data not shown).
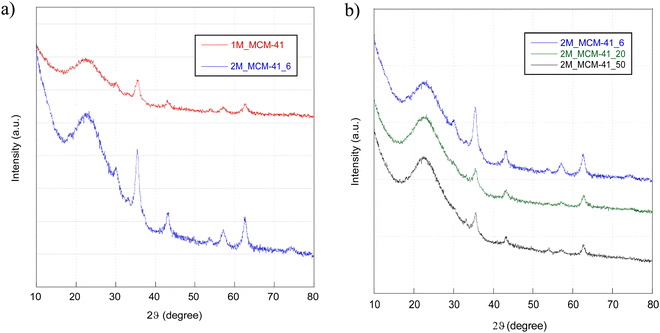 | ||
| Fig. 7 Wide-angle X-ray powder diffraction patterns of (a) 1M_MCM41 and 2M_MCM41_6; (b) 2M_MCM41_6, 2M_MCM41_20 and 2M_MCM41_50. | ||
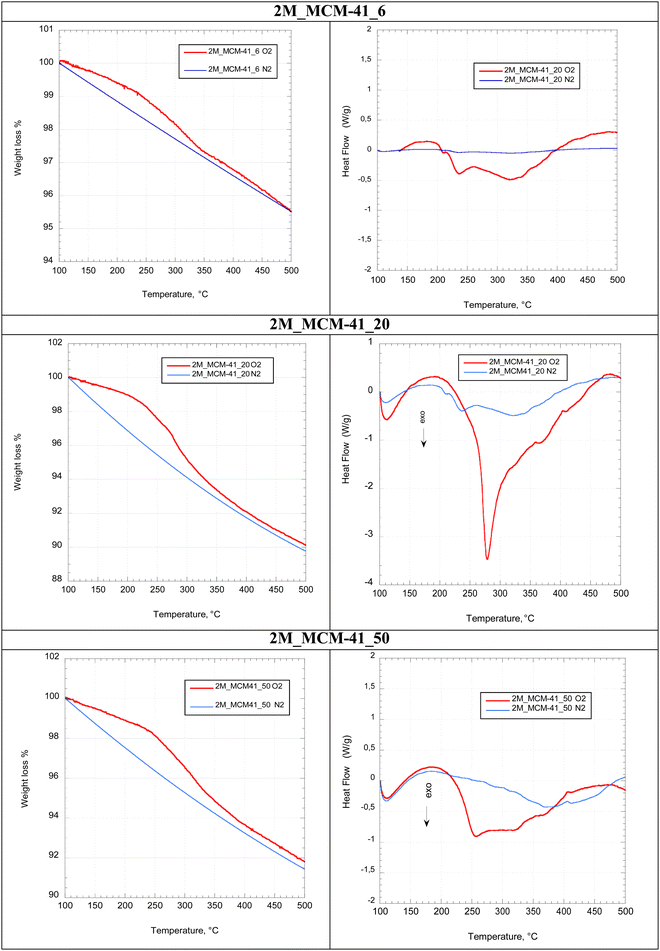 | ||
| Fig. 8 TG (left side) and DSC (right side) curves of the 2M_MCM41 series samples under O2 and N2 atmosphere. | ||
XPS spectra were acquired for clarifying the chemical state of iron in the samples.
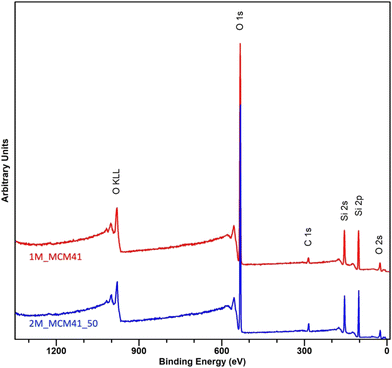
In Fig. 9, the survey spectra of 1M_MCM41 and 2M_MCM41_50 samples are shown. The signals ascribed to Si and O are detected together with a small contribution of carbon that is always present at the surface of samples exposed to the atmosphere. No signals of iron are clearly detected in the survey spectra.
High-resolution Fe 2p spectra (S1, ESI†) were recorded with many scans in order to increase the signal-to-noise ratio.
Fe 2p spectra are composed of a doublet Fe 2p3/2–Fe 2p1/2 due to the spin–orbit coupling with an energy separation of about 13 eV and with an intensity ratio of 2![[thin space (1/6-em)]](https://www.rsc.org/images/entities/char_2009.gif) :
:![[thin space (1/6-em)]](https://www.rsc.org/images/entities/char_2009.gif) 1.
1.
Despite the bulk concentration of iron in the samples being expected to be high enough to provide clearly detectable Fe signals, the Fe 2p doublet is barely visible even in the case of the 2M_MCM41_50 sample (13 wt%), and it is not detected for the 1M_MCM41 (4 wt%) sample.
To distinguish between the different chemical states of iron, curve fitting of the signals is required; thus, model curves determined on standard reference materials should be adapted to the experimental ones; due to the poor signal-to-noise ratio of the Fe 2p signal also in the case of the 2M_MCM41_50 sample, no curve-fitting procedure was attempted.
The reason for such a low intensity signal might be ascribed to the XPS sampling depth, for electrons emitted from iron and travelling through an inorganic silica matrix.
The sampling depth can be estimated as 3λ![[thin space (1/6-em)]](https://www.rsc.org/images/entities/i_char_2009.gif) cos
cos![[thin space (1/6-em)]](https://www.rsc.org/images/entities/char_2009.gif) θ, where λ is the inelastic mean free path, and θ is the emission angle (53° in our experiments). According to the semi-empirical approach proposed by Seah and Dench, λ (nm) can be estimated by eqn (4):
θ, where λ is the inelastic mean free path, and θ is the emission angle (53° in our experiments). According to the semi-empirical approach proposed by Seah and Dench, λ (nm) can be estimated by eqn (4):
| λ = A/KE2 + B × √KE | (4) |
With a binding energy value of 711 eV for the Fe 2p3/2 signal, the resulting kinetic energy value is KE = (1486.6 – 711) eV = 775.6 eV and λ is estimated to be 2.7 nm; the sampling depth, d = 3λ![[thin space (1/6-em)]](https://www.rsc.org/images/entities/i_char_2009.gif) cos
cos![[thin space (1/6-em)]](https://www.rsc.org/images/entities/char_2009.gif) θ, is estimated to be equal to 4.8 nm.
θ, is estimated to be equal to 4.8 nm.
Such results substantiate the hypothesis that the iron oxide is located inside the pores and that iron signals are attenuated from at least two MCM41 silica walls, considering the estimated attenuation length.
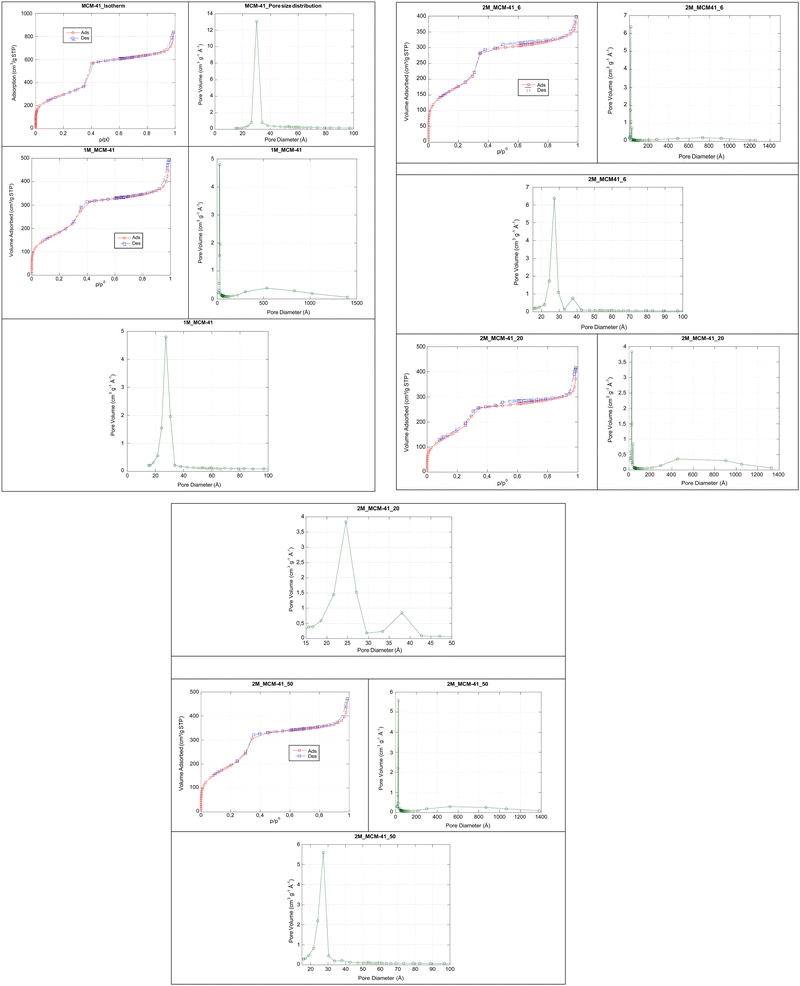
The ordered mesoporous structure of the material was also confirmed by the nitrogen sorption isotherm due to the capillary condensation/evaporation of nitrogen gas in the mesoporous at different relative pressures, depending on the pore size (Fig. 10). All the samples showed a type IV isotherm, typical of an MCM41 structure, according to the International Union of Pure and Applied Chemistry (IUPAC) nomenclature,35 confirming that the presence of the magnetic component did not affect the ordered mesoporous structure. When analysing the isotherm more in detail, a slight difference between the MCM41 and the M_MCM41 series was observed. The former shows a very sharp defined mesopore filling step in the relative pressure (p/p0) range 0.3–0.4, while in the M_MCM41 samples, a first mesoporous filling step was also observed in a wider range as soon as the amount of the magnetic component was increasing independently from the starting NC, demonstrating that the pores are accessible. A decrease in the peak height and sharpness was also visible, which indicates a lower mesoporous volume when compared to the MCM41 sample. The second low peak at 3.8 nm in the 2M_MCM41_6 and 2M_MCM41_20 samples is an artefact peak caused by the tensile strength effect.31 A second filling step at higher relative pressures (0.8–1) indicates the presence of larger pores in M_MCM41 samples, also confirmed by the pore size distribution curve. In all the samples, a first narrow pore size distribution was observed, with a slight decrease in the average pore diameter with the increment of the magnetic component (1M_MCM41 Dp = 2.80 nm) and moving from 2M_MCM41_6 (Dp = 2.54 nm) to 2M_MCM41_50 (Dp = 2.41 nm). The second peak with a broader distribution is instead ascribed to interparticle pores as previously reported.42 M_MCM41 samples exhibited a lower SSA value in comparison with the MCM41 sample. This may arise from the presence of interparticle pores and from some Mag-NPs partially located in some mesopores in agreement with the XPS results, while the weight fraction of the magnetic component can be an indirect cause of the SSA decrease. However, the SSA values of our M_MCM41 sample are larger than the SSA of magnetic mesoporous silica reported in the literature.20
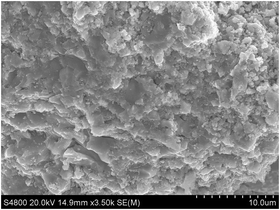
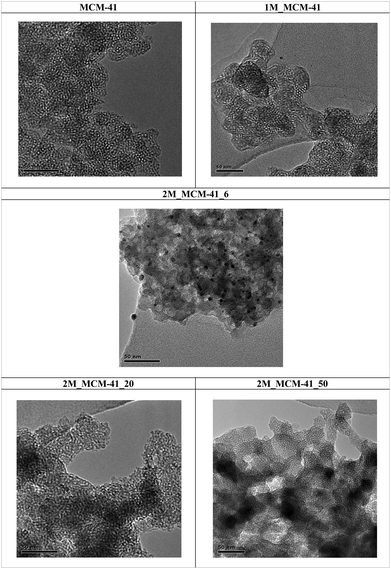
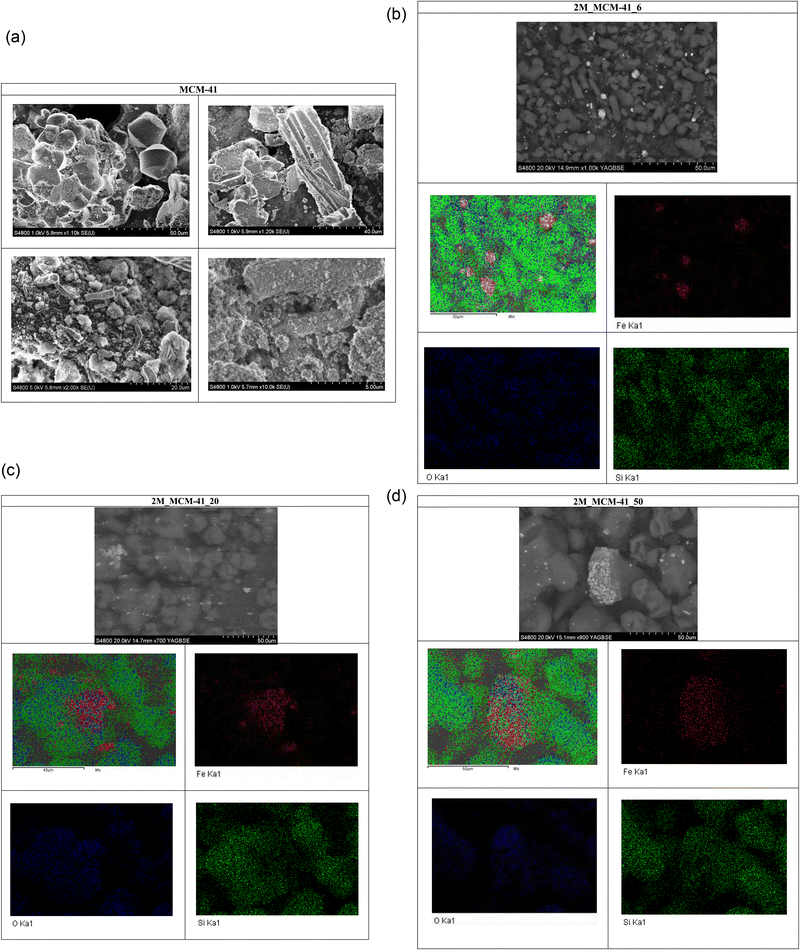
TEM analysis confirmed the 2D-hexagonal mesoporous structure of M_MCM41 which is similar to the MCM41 like material (Fig. 10). Moreover, the location of the Mag-NPs in the MCM41 structure was visible (i.e. 2M_MCM41_6, Fig. 11). The most reasonable assumption is that the Mag-NPs form part of the silica walls as also visible in SEM micrographs and in the elemental distribution maps from EDX. In fact, the SEM analysis of the M_MCM41 samples showed the presence of silica agglomerates of irregular shape including the magnetite nanoparticles in their structure and on their surface, providing direct evidence of their dispersion in the MCM41 material without affecting the accessibility of the pores, in agreement with nitrogen sorption results (Fig. 12b–d). Mag-NPs’ dimensions increase with respect to the original NCs, especially visible in the 2M_MCM41 samples. SEM micrographs of MCM41 like samples also showed the presence of irregular agglomeration together with octahedral and rod-like shape particles, not visible in the M_MCM41 samples (Fig. 12a). The formation of interparticle pores was also evident in both standard and magnetic samples.
All the samples, with and without a magnetic component, have similar FTIR spectra (Fig. 13a), with vibrations for a typical siliceous material: Si–OH stretching (∼3500 cm−1), Si–O–Si stretching (∼1050 cm−1) together with a shoulder at ∼1200 cm−1, Si–OH bending (960 cm−1), and Si–O bending (790 cm−1).43 Comparing the MCM41 with the magnetic MCM41-like samples, it is evident that the incorporation of Fe3O4 causes a decrease in the intensity of the Si–OH band at 960 cm−1. It could be ascribed to the adsorption of the iron phase onto the silica surface and, therefore, the decrease of the hydroxyl groups. Moreover, the spectrum ranging from 400–1000 cm−1 of the magnetic MCM41 shows a signal at 440–580 cm−1 originating from the Fe–O vibration44 (Fig. 13b).
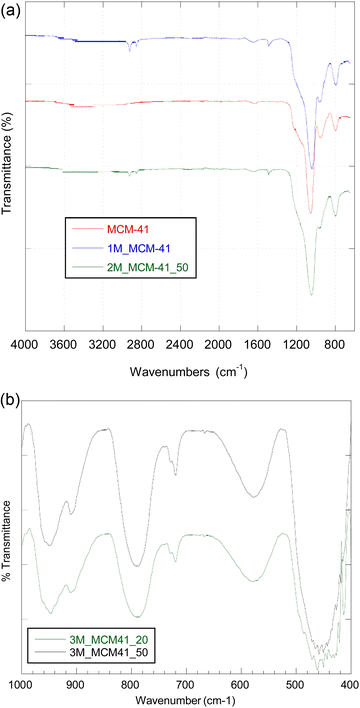 | ||
| Fig. 13 (a) FTIR spectra of the MCM41 and M_MCM41 samples. (b) FTIR finger print detail of 2M_MCM41_20 and 2M_MCM41_50 samples. | ||
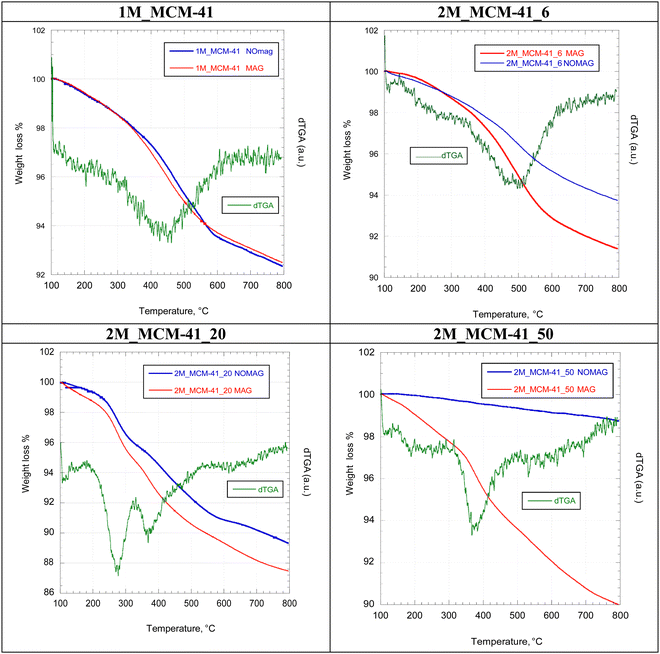
The thermomagnetic experiments carried out for the M_MCM41 samples reported in Fig. 14 show the different behaviour of the samples when thermally treated in the presence/absence of a small static magnetic field. A magnetization loss recorded as apparent weight loss is more significant for the sample thermally treated in the presence of a magnetic field in the range between 350 and 500 °C. In the 2M_MCM41_20 sample, the thermomagnetic curve shows a double step at 270 and 370 °C. In all samples, the magnetization loss is reversible. Such values are a Curie point estimation of the magnetic component embedded in the SiO2 matrix.
Concerning the acid properties of the magnetic MCM41 like samples investigated by means of NH3 TPD measurements, TCD profiles (Fig. 15) show very large contributions at temperatures higher than 400 °C irrespective of the sample. However, as revealed by the QMS detector, these peaks cannot be ascribed to ammonia desorption. In contrast, TCD profiles resemble the QMS signals of water, whose desorption could be due to the removal of silanol groups on the sample surface. The absence of desorption peaks related to ammonia in the range of 100–800 °C indicates that the prepared samples are not characterized by significant acid properties.
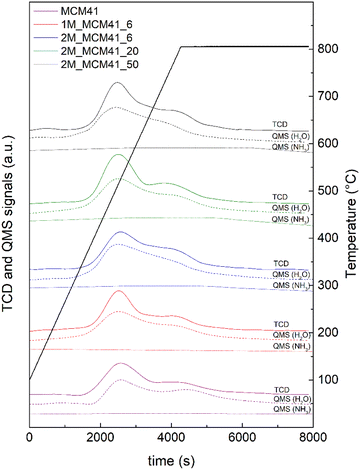 | ||
| Fig. 15 TCD profiles (solid lines) and Quadrupole Mass Spectrometer (QMS) signals of ammonia (dotted lines) and water (dashed lines) during the NH3 TPD analyses. | ||
Finally, a very preliminary investigation of magnetic properties has been performed on the samples 1_MCM41, 2M_MCM41_6 and 2M_MCM41_50. Thermal dependence of magnetization measured with the ZFC-FC protocol (not reported here) shows complete irreversibility among MFC and MZFC, suggesting that a fraction of blocked particles is still present at 300 K. On the other hand, the field dependence of magnetization recorded at 300 K (Fig. 16) shows zero remanence and zero coercivity,45 indicating a negligible fraction of blocked particles and that most of the samples are in the superparamagnetic regime.46 As a rough qualitative observation, it is noteworthy that the approach to the saturation is quite similar for 1_MCM41 and 2M_MCM41_6 samples showing an S-shaped superparamagnetic curve, while the 2M_MCM41_50 sample shows an M vs H with a strong tendency of saturation (Fig. 16). This induces us to believe that the magnetism of the M_MCM samples has been strongly influenced by the magnetic behaviour of the Fe3O4/SiO2 NCs used as precursors. A deep investigation on the magnetic properties of the samples is in progress.23
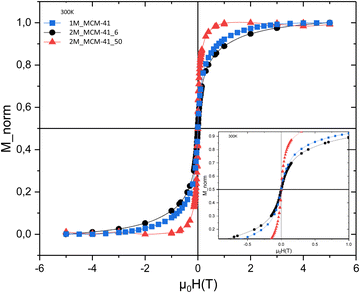 | ||
| Fig. 16 Field dependence of magnetization recorded at 300 K for the samples 1M_MCM41, 2M_MCM41_6 and 2M_MCM41_50. | ||
4. Conclusions
The physico-chemical investigation carried out in this work demonstrated the successful combination of high energy ball milling and the liquid crystal templating method in the preparation of magnetic ordered mesoporous silica. The use of mechanochemistry in the preparation of the starting Fe3O4–SiO2 nanocomposites is fundamental to (i) limit the magnetic nanoparticles’ aggregation, (ii) to protect the magnetic component from the MCM41 synthesis reaction media, (iii) to promote the inclusion of the magnetic component into the mesoporous silica structure, and (iv) consequently to achieve high surface areas and high pore volume as well as accessibility of the pores. Our novel strategy could be used for the preparation of plenty of magnetic ordered mesoporous silica-based materials using different surfactants as templates, opening new ways to the synthesis and characterization of such fascinating materials.Conflicts of interest
There are no conflicts to declare.Acknowledgements
This work was supported by Programma Master&Back FSE 2007 – 2013 Regione Autonoma della Sardegna; FUNCOAT Project – Functionalization of Surfaces of Materials for High Added Value Applications CONSOLIDER-INGENIO 2010 – CSD2008-00023 and Fondazione di Sardegna – Progetti Biennali di Ateneo Annualità 2018 (CUP F74I19000940007). The authors are very grateful to Prof. Antonella Rossi for the worthwhile discussions. Dr Wynette Redington is gratefully acknowledged for performing part of the XRPD analysis.References
- P. S. N. Zadeh and B. Åkerman, J. Phys. Chem. B, 2017, 121(12), 2575–2583 CrossRef PubMed
.
- M. Kalantari, M. Yu and Y. Yang,
et al.
, Nano Res., 2017, 10, 605–617 CrossRef CAS
.
- C. Xu, C. Lei and C. Yu, Front. Chem., 2019, 7, 1–12 CrossRef PubMed
.
- A. L. Ajiboye, V. Trivedi and J. Mitchell, Drug Dev. Ind. Pharm., 2020, 46(4), 576–586 CrossRef CAS PubMed
.
- D. Peddis, M. V. Mansilla, S. Mørup, C. Cannas, A. Musinu, G. Piccaluga, F. D. Orazio, F. Lucari and D. Fiorani, J. Phys. Chem. B, 2008, 112, 8507–8513 CrossRef CAS PubMed
.
- S. Laurent, D. Forge, M. Port, A. Roch, C. Robic, L. V. Elst and R. N. Muller, Chem. Rev., 2008, 108, 2064–2110 CrossRef CAS PubMed
.
- C. Sun, J. S. H. Lee and M. Zhang, Adv. Drug Delivery Rev., 2000, 60, 1252–1265 CrossRef PubMed
.
- P. Xu, G. M. Zeng, D. L. Huang, C. L. Feng, S. Hu, M. H. Zhao, C. Lai, Z. Wei, C. Huang and G. X. Xie,
et al.
, Sci. Total Environ., 2012, 424, 1–10 CrossRef CAS PubMed
.
- P. Xu, G. M. Zeng, D. L. Huang, C. Lai, M. H. Zhao, Z. Wei, N. J. Li, C. Huang and G. X. Xie, Chem. Eng. J., 2012, 203, 423–431 CrossRef CAS
.
- W. W. Tang, G. M. Zeng, J. L. Gong, J. Liang, P. Xu, C. Zhang and B. B. Huang, Sci. Total Environ., 2014, 468–469, 1014–1027 CrossRef CAS PubMed
.
- J. Xu, J. Sun, Y. Wang, J. Sheng, F. Wang and M. Sun, Molecules, 2014, 19(8), 11465–11486 CrossRef PubMed
.
- Y. Zhang, Q. Yue, M. M. Zagho, J. Zhang, A. A. Elzatahry, Y. Jiang and Y. Deng, ACS Appl. Mater. Interfaces, 2019, 11(10), 10356–10363 CrossRef CAS PubMed
.
- A. Ulu, S. Abbas, A. Noma, S. Koytepe and B. Ates, Nanomed., Biotechnol., 2018, 46, 1035–1045 CAS
.
- M. Golshekan and F. Shirini, Silicon, 2020, 12, 747–757 CrossRef CAS
.
- M. Pilloni, J. Nicolas, V. Marsaud, K. Bouchemal, F. Frongia, A. Scano, G. Ennas and C. Dubernet, Int. J. Pharm., 2010, 401, 103–112 CrossRef CAS PubMed
.
- K. R. Lee, S. Kim, D. H. Kang, J. I. Lee, Y. J. Lee, W. S. Kim, D. Cho, H. Bin Lim, J. Kim and N. H. Hur, Chem. Mater., 2008, 20, 6738–6742 CrossRef CAS
.
- H.-M. Song and J. I. Zink, Phys. Chem. Chem. Phys., 2016, 18, 24460–24470 RSC
.
- L. M. Guo and J. L. Shi, Nano-Micro Lett., 2009, 1, 27–29 CrossRef CAS
.
- Y. Deng, Y. Cai, Z. Sun, J. Liu, C. Liu, J. Wei and W. Li, J. Am. Chem. Soc., 2010, 132, 8466–8473 CrossRef CAS PubMed
.
- Y. Deng, Y. Cai, Z. Sun and D. Zhao, Chem. Phys. Lett., 2011, 510, 1–13 CrossRef CAS
.
- A. Scano, V. Cabras, F. Marongiu, D. Peddis, M. Pilloni and G. Ennas, Mater. Res. Express, 2017, 4(2), 1–11 Search PubMed
.
- A. Scano, E. Magner, M. Pilloni, D. Peddis, F. Sini, S. Slimani and G. Ennas, J. Nanosci. Nanotechnol., 2021, 21, 5 Search PubMed
.
- A. Scano, V. Cabras, F. Marongiu, D. Peddis, M. Pilloni and G. Ennas, Mater. Res. Express, 2017, 4(2), 1–11 CrossRef
.
- P. D. Castrillo, D. Olmos, D. R. Amador and J. González-Benito, J. Colloid Interface Sci., 2007, 308(2), 318–324 CrossRef CAS PubMed
.
- A. Sorrentino, G. Gorrasi, M. Tortora, V. Vittoria, U. Costantino and F. Marmottini,
et al.
, Polymer, 2005, 46(5), 1601–1608 CrossRef CAS
.
- Y. G. Zhu, Z. Q. Li, D. Zhang and T. Tanimoto, J. Appl. Polym Sci., 2006, 99(2), 501–505 CrossRef CAS
.
- U. Ciesla and F. Schüth, Microporous Mesoporous Mater., 1999, 27, 131–149 CrossRef CAS
.
- A. Scano, F. Ebau, V. Cabras, F. Sini and G. Ennas, J. Nanosci. Nanotechnol., 2021, 21, 5 Search PubMed
.
- J. He, S. Unser, I. Bruzas, R. Cary, Z. Shi, R. Mehra, K. Aron and L. Sagle, Colloids Surf., B, 2018, 163, 140–145 CrossRef CAS PubMed
.
- X. S. Zhao, G. Q. Lu and G. J. Millar, Ind. Eng. Chem. Res., 1996, 35(7), 2075–2090 CrossRef CAS
.
- W. Lai, S. Yang, Y. Jiang, F. Zhao, Z. Li, B. Zaman, M. Fayaz, X. Li and Y. Chen, Adsorption, 2020, 26, 633–644 CrossRef CAS
.
- C. T. Kresge, M. E. Leonowicz, W. J. Roth, J. C. Vartuli and J. S. Beck, Nature, 1992, 359, 710–712 CrossRef CAS
.
- E. P. Barret, L. G. Joyner and P. P. Halenda, J. Am. Chem. Soc., 1951, 73, 373–380 CrossRef
.
-
J. Rouquerol, F. Rouquerol, P. Llewellyn, G. Maurin and K. Sing, Adsorption by Powders and Porous Solids, Academic Press Oxford (UK), New York, NY, 2nd edn, 2013 Search PubMed
.
- M. Kruk, M. Jaroniec, Y. Sakamoto, O. Terasaki, R. Ryoo and H. Ko, J. Phys. Chem. B, 2000, 104(2), 292–301 CrossRef CAS
.
-
H. P. Klug and L. E. Alexander, X-Ray Diffraction Procedures, John Wiley & Sons Inc., 2nd edn, 1974, pp. 687–703, ISBN 978-0-471-49369-3 Search PubMed
.
- A. Corrias, G. Ennas, A. Musinu, G. Paschina and D. Zedda, J. Mater. Res., 1997, 12(10), 2767–2772 CrossRef CAS
.
-
E. Colacino, G. Ennas, I. Halaz, A. Porcheddu and A. Scano, Mechanochemistry: from soft matter to hard materials, An Introducion and a Practical Guide, De Gruyter, 2021 Search PubMed
.
- J. S. Beck, J. C. Vartuli, W. J. Roth, M. E. Leonowicz, C. T. Kresge, K. D. Schmitt, C. T. W. Chu, D. H. Olson, E. W. Sheppard, S. B. McCullen, J. B. Higgins and J. L. Schlenke, J. Am. Chem. Soc., 1992, 114, 10834–10843 CrossRef CAS
.
- S. Zhou, W. Jin, Y. Ding, B. Shao, B. Wang, X. Hu and Y. Kong, Dalton Trans., 2018, 47, 16862–16875 RSC
.
- L. Yu, H. Bi, L. Yu and H. Bi, J. Appl. Phys., 2012, 111(7), 07B514 CrossRef
.
- X. Li, H. Yu, Y. He and X. Xue, J. Anal. Methods Chem., 2012, 928720 Search PubMed
.
- S. Zamani, V. Meynen, A. M. Hanu, M. Mertens, E. Popovici, S. Van Doorslaer and P. Cool, Phys. Chem. Chem. Phys., 2009, 11, 5823–5832 RSC
.
- M. Saraei, Z. Ghasemi, G. Dehghan, M. Hormati and K. Ojaghi, Monatsh. Chem., 2017, 148, 917–923 CrossRef CAS
.
-
Magnetic Properties of Fine Particles, ed. J. L. Dormann and D. Fiorani, eBook, 1st edn, 1992, ISBN: 9780444597410 Search PubMed
.
- G. Muscas, G. Concas, S. Laureti, A. M. Testa, R. Mathieu, J. A. De Toro, C. Cannas, A. Musinu, M. A. Novak, C. Sangregorio, S. S. Leei and D. Peddis, Phys. Chem. Chem. Phys., 2018, 20, 28634–28643 RSC
.
Footnote |
| † Electronic supplementary information (ESI) available. See DOI: https://doi.org/10.1039/d3cp04213h |
| This journal is © the Owner Societies 2024 |

