Fabrication of bimetallic MOF-74 derived materials for high-efficiency adsorption of iodine†
Wen-Ze
Li
 ,
Fu-Yu
Guo
,
Jing
Li
,
Xiao-Sa
Zhang
,
Yu
Liu
and
Jian
Luan
,
Fu-Yu
Guo
,
Jing
Li
,
Xiao-Sa
Zhang
,
Yu
Liu
and
Jian
Luan
 *
*
College of Science, Shenyang University of Chemical Technology, Shenyang, 110142, P. R. China. E-mail: 2010044@stu.neu.edu.cn
First published on 22nd July 2024
Abstract
Owing to their high porosity, open metal sites, and huge surface area, metal–organic framework (MOF) materials are commonly employed in iodine adsorption processes. Bimetallic MOFs have drawn a lot of attention since mono-metal MOFs have been unable to keep up with the demand. Bimetallic MOF materials still have drawbacks, including limited adsorption capacity, extended adsorption time, poor stability, and poor selectivity, despite their positive performance in radioactive iodine capture. It has been therefore difficult to develop adsorbents with quick iodine adsorption rates and high iodine adsorption efficiency. This study investigated the adsorption properties of a series of bimetallic MOF-74 materials (Mn–Co-MOF-74, Mn–Zn-MOF-74, and Mn–Ni-MOF-74) for radioactive iodine, as well as their design and synthesis utilizing the reflux approach. It was discovered that the adsorption performance of Mn–Ni-MOF-74 for radioiodine was superior to that of the other two bimetallic MOF-74 materials. Using the bimetallic Mn–Ni-MOF-74 as a precursor, a variety of bimetallic MOF-74 derived carbon compounds (Mn–Ni-CX) were prepared by high-temperature pyrolysis. Simultaneously, the structure of the material and the iodine adsorption characteristics have been thoroughly studied.
1. Introduction
Growing levels of both natural and man-made contaminants in air and water systems have resulted in a wide range of toxicological hazards that have significant impacts on human health.1–4 The public is particularly concerned about the large-scale leakage of low-concentration radioactive iodine isotopes (129I and 131I) from nuclear waste and accidents.5129I is a radioactive isotope of iodine with an exceptionally long half-life of 15.7 × 10⁶ years and long-lasting effects on the environment. Despite having a short half-life (about 8 days), 131I is harmful to the thyroid and interferes with human metabolism.6,7 To lessen the effects on the ecosystem and human health, it is imperative to develop techniques for capturing and storing iodine over the long term. The removal of inorganic contaminants from wastewater has been documented using a variety of techniques in recent studies, including filtration, membrane separation, ion exchange, electrochemistry, etc.8,9 The adsorption method is superior to the other methods because it can be used to treat a wide range of target pollutants in water and has fewer cost and energy requirements. It can also be utilized in a wide range of pH values. Activated carbon, zeolite, silica, and chalcogenide elements are currently the most prevalent adsorbents; nevertheless, their ability to adsorb iodine and organoiodides is limited.10–12 In contrast to conventional commercial adsorbents, emerging porous materials such as covalent organic frameworks (COFs), porous organic polymers (POPs), and metal–organic frameworks (MOFs) have highly customizable pore topologies and abundant surface functionalities.13–22 Innovative adsorption methods can be used to collect molecular iodine and organic iodides, opening up new possibilities for the development of high-performing adsorbents.The efficient structure of metal–organic framework (MOF) materials—for example, MOF-74, which is one of the best adsorption materials because of its large specific surface area, uniform pore size, permanent porosity, structural diversity, resistance to high-temperature decomposition, and open metal sites—allows for a variety of applications, including liquid purification, catalysis, gas storage and separation, and structural diversity. Sensing and electrochemical energy storage MOFs have demonstrated promising capabilities in wastewater purification by adsorption methods and have been widely utilized to adsorb heavy metals and other inorganic contaminants from water due to their high porosity, utility, flexibility, and superior crystallinity.23–27 An and co-workers prepared fractionally porous Mg-MOF-74 rich in flaws, which had a strong trapping effect and increased the adsorption capacity of CO2.28
But as scientists strive for ever-higher MOF performance, these mono-metal MOFs have been unable to keep up with the demand, and thus bimetallic MOFs have drawn a lot of interest.29–32 In order for a single metal MOF to form a central bimetallic cluster and retain both the nature of the original MOF and the physical and chemical properties of the second metal, it is necessary to introduce a second metal into a single metal MOF. This allows the MOFs to modify their framework while also enhancing the performance diversity of each individual MOF. For example, Cu and Zn bimetallic embedded porous carbon (CuZn@C) was prepared by carbonizing ZIF-8 pre-grown on CuO nanosheets. It possessed a good porous structure, large specific surface area, uniform bimetallic active site distribution, and strong adsorption capacity (60 mg g−1) for dibenzothiophene (DBT).33 Bimetallic FeCu-MOFs with chlorine-containing functional groups have been designed and synthesized by the hydrothermal method with the aid of ultrasound.34 The prepared bimetallic FeCu-MOFs exhibited good crystallinity, high elemental dispersion, and high removal efficiency for gaseous element mercury (HgO). The mercury equilibrium adsorption capacity of FeCu-MOFs could reach 12.27 mg g−1. Bimetallic MOF materials have demonstrated positive results in the capture of radioactive iodine; nonetheless, many drawbacks remain, including low adsorption capacity, poor stability, and extended adsorption time. It is therefore difficult to develop adsorbents with quick iodine adsorption rates and high iodine adsorption efficiency.
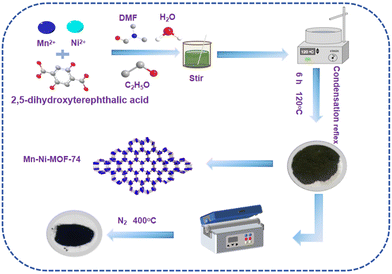
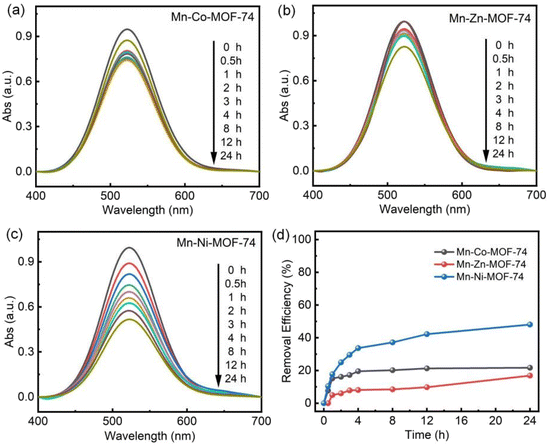
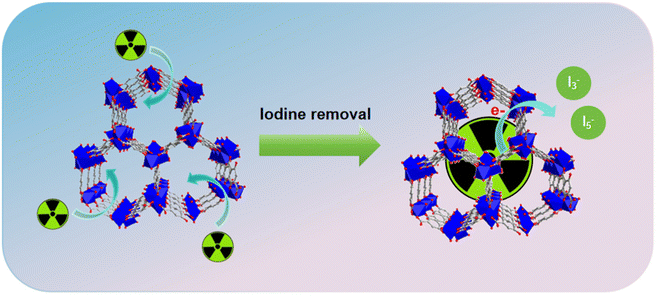
Based on the above considerations, a series of bimetallic MOF-74 materials (Mn–Co-MOF-74, Mn–Zn-MOF-74 and Mn–Ni-MOF-74) were designed and prepared by the reflux method using the Mn metal ion as the first metal ion and different second metal ions. The adsorption performance of Mn–Ni-MOF-74 for radioactive iodine was studied, and it was found that Mn–Ni-MOF-74 had better adsorption performance than the other two bimetallic MOF-74 materials (Scheme 1). A series of bimetallic MOF-74 derived carbon materials (Mn–Ni-CX) were prepared by pyrolysis at high temperature using the bimetallic Mn–Ni-MOF-74 as a precursor. Mn–Ni-C400 had a strong adsorption capacity of 219 mg g−1 for radioactive iodine. As a result, the bimetallic material formed from Mn–Ni-MOF-74 proved to be a viable material for trapping radioactive iodine, and this study offered a workable technical method for doing so.
2. Experimental section
2.1 Synthesis of bimetallic MOF-74
![[thin space (1/6-em)]](https://www.rsc.org/images/entities/char_2009.gif) :
:![[thin space (1/6-em)]](https://www.rsc.org/images/entities/char_2009.gif) 1, v/v) was added. The resulting solution was transferred to a spherical bottle for condensation reflux at 120 °C for 6 h, followed by standing for 12 h. Then, the product was collected by extraction and filtration, washed three times with DMF and ethanol respectively, and dried in a vacuum drying oven at 80 °C for 6 h.
1, v/v) was added. The resulting solution was transferred to a spherical bottle for condensation reflux at 120 °C for 6 h, followed by standing for 12 h. Then, the product was collected by extraction and filtration, washed three times with DMF and ethanol respectively, and dried in a vacuum drying oven at 80 °C for 6 h.
2.2 Synthesis of Mn–Ni-MOF-74 derivative materials (Mn–Ni-CX)
2.3 Synthesis of monometal MOF-74
![[thin space (1/6-em)]](https://www.rsc.org/images/entities/char_2009.gif) :
:![[thin space (1/6-em)]](https://www.rsc.org/images/entities/char_2009.gif) 1, v/v) was added. The resulting solution was transferred to a spherical bottle for condensation reflux at 120 °C for 5 h, followed by standing for 4 h. Then, the product was collected by extraction and filtration, washed three times with DMF and ethanol, respectively, and dried in a vacuum drying oven at 80 °C for 6 h.
1, v/v) was added. The resulting solution was transferred to a spherical bottle for condensation reflux at 120 °C for 5 h, followed by standing for 4 h. Then, the product was collected by extraction and filtration, washed three times with DMF and ethanol, respectively, and dried in a vacuum drying oven at 80 °C for 6 h.
2.4 Synthesis of Mn/Ni-MOF-C400 derivative materials
2.5 Characterization
Fourier transform infrared (FTIR) spectroscopy (potassium bromide compression method) was performed using a Varian 6400-400-IR spectrometer. Powder X-ray diffraction (PXRD) data were collected using a CuKα diffractometer. The morphology and structure of Mn–Co-MOF-74, Mn–Zn-MOF-74, Mn–Ni-MOF-74 and the derived Mn–Ni-CX materials were characterized using a scanning electron microscope (SEM, Nova Nano 430) and an energy dispersive X-ray (EDX) detector. The thermal stability of Mn–Co-MOF-74, Mn–Zn-MOF-74, Mn–Ni-MOF-74 and the derived material Mn–Ni-CX was determined using a thermogravimetric analyzer (NETZSCH STA 449C). The UV-vis absorption spectrum was recorded using an SP-1900 UV-vis spectrophotometer. X-ray photoelectron spectroscopy (XPS) measurements were performed using a Kratos Axis 165 photoelectron spectrometer to assess the elemental composition and bonding energy of fresh and negative iodine samples. The Raman spectra of Mn–Ni-C400 and I@Mn–Ni-C400 were recorded using a high-resolution confocal Raman spectrometer (Horiba LabRAM HR800) with a 532 nm laser. The metal contents of the materials were detected by ICP-AES (Thermo ICAP PRO).2.6 Adsorption experiment
Iodine with a purity of 99.8% was employed as the iodine source in each of the experiment's iodine solutions. Cyclohexane was chosen as the non-polar solvent to prevent polar solvent interference with the host–guest interaction between the MOF and iodine. A predefined amount of iodine was added to cyclohexane, and the mixture was subjected to ultrasonic treatment for 30 min to prepare the iodine–cyclohexane solution.Initially, a 0.001 mol L−1 iodine–cyclohexane solution was prepared at ambient temperature and atmospheric pressure. A dry tiny glass bottle containing 5 mg of the sample was filled with 5 mL of the iodized cyclohexane solution mentioned above. The bottle was then placed on a stirring table and stirred. Samples were collected every 24 h, at intervals of 0.5, 1, 2, 3, 4, 8, 12 and 24 h. An ultraviolet spectrophotometer was used to detect the absorbance of iodine after samples were taken at predetermined intervals and the solution in the bottle was filtered. The adsorption capacity of the iodine solution was calculated using formula (1):
| W = [(I0 − It)/I0 × C × V]/m × 100 | (1) |
3. Results and discussion
3.1 Structural characterization of Mn–Co-MOF-74, Mn–Zn-MOF-74 and Mn–Ni-MOF-74
The PXRD patterns of Mn–Co-MOF-74, Mn–Zn-MOF-74 and Mn–Ni-MOF-74 are shown in Fig. 1a–c. The characteristic peaks of the three bimetallic MOF-74 materials at 2θ = 6.8° and 11.7° were consistent with the characteristic diffraction peaks of the simulated PXRD pattern of MOF-74.35–37 According to the results, the produced bimetallic MOF-74 possessed the typical MOF-74 structure. It is known that the first metal is replaced by the second metal when the second metal is added to the crystal, keeping the first metal's position unchanged. This shows that the second metal atom now occupies the position previously occupied by the first metal in the lattice.38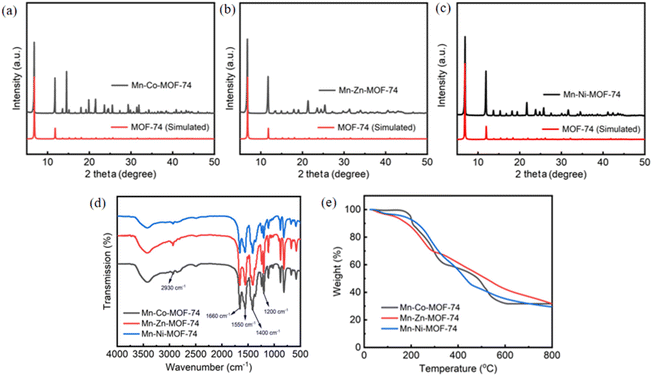 | ||
| Fig. 1 The PXRD patterns of simulated and fresh samples of Mn–Co-MOF-74 (a), Mn–Zn-MOF-74 (b), and Mn–Ni-MOF-74 (c). (d) FTIR spectra of bimetallic MOF-74. (e) TG curves of bimetallic MOF-74. | ||
The FTIR spectra of Mn–Co-MOF-74, Mn–Zn-MOF-74 and Mn–Ni-MOF-74 were recorded in the frequency range of 4000–500 cm−1 (Fig. 1d). First, the peaks at 3500–3300 cm−1 of the three bimetallic MOF-74 materials were found to be wide and blunt, due to the stretching vibrations of the –OH group.39 Second, the characteristic peaks of the three materials at 2930 cm−1 were caused by the stretching vibration and bending vibration of C–H groups.40 Third, the characteristic peaks of the three materials at 1660 and 1550 cm−1 were due to the stretching vibrations of –COOH and C![[double bond, length as m-dash]](https://www.rsc.org/images/entities/char_e001.gif) O.41 Fourth, the characteristic peaks of the three materials at 1400 cm−1 were caused by the C
O.41 Fourth, the characteristic peaks of the three materials at 1400 cm−1 were caused by the C![[double bond, length as m-dash]](https://www.rsc.org/images/entities/char_e001.gif) C stretching vibration of mononuclear aromatics, corresponding to the benzene ring skeleton vibration, indicating that the organic ligand was retained in the target product.42 Fifth, the characteristic peaks of the three materials at 1200 cm−1 were caused by the stretching vibration of the C–O group.43
C stretching vibration of mononuclear aromatics, corresponding to the benzene ring skeleton vibration, indicating that the organic ligand was retained in the target product.42 Fifth, the characteristic peaks of the three materials at 1200 cm−1 were caused by the stretching vibration of the C–O group.43
The thermal stability of the three bimetallic Mn–Co-MOF-74, Mn–Zn-MOF-74 and Mn–Ni-MOF-74 materials was determined under a nitrogen atmosphere and in the temperature range of 20–800 °C (Fig. 1e). The TG curve made it evident that there were three significant mass loss stages and that the initial decomposition temperatures of the three bimetallic MOF-74 materials were nearly the same. Furthermore, all of the three materials lose weight at nearly the same rate in the end. During the initial phase, the mass loss resulting from the release of guest molecules in the sample channel caused the sample to gradually lose weight. Mn–Co-MOF-74, Mn–Zn-MOF-74, and Mn–Ni-MOF-74 exhibited weight loss rates of 11.10%, 9.50%, and 7.70%, respectively. Due to the release of bound guest molecules in the sample and the mass loss resulting from partial pore collapse, the sample clearly lost weight in the second stage. Mn–Co-MOF-74, Mn–Zn-MOF-74 and Mn–Ni-MOF-74 exhibited weight loss rates of 37.70%, 46.70%, and 47.40%, respectively. The collapse of the majority of the pores during the third stage caused mass loss and structural damage.
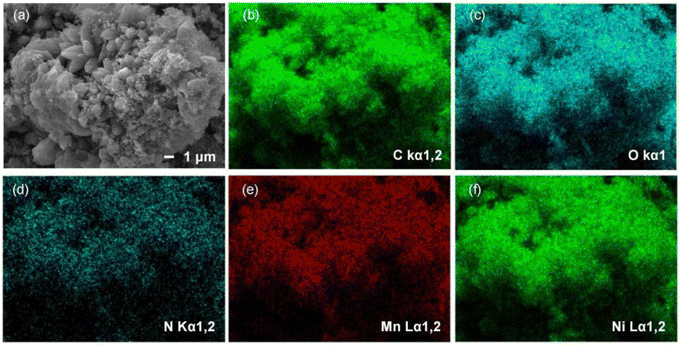
The morphology and elemental distribution of the three bimetallic materials, Mn–Co-MOF-74, Mn–Zn-MOF-74 and Mn–Ni-MOF-74, were characterized using SEM and EDX images. As shown in Fig. S1 and S2,† Mn–Co-MOF-74 and Mn–Zn-MOF-74 exhibited a rod-like structure, and the EDX images revealed that Mn and Co, and Mn and Zn elements were evenly distributed, indicating that the two metal elements were evenly distributed in the bimetallic MOF-74. Mn–Ni-MOF-74 had a petal-like structure made up of agglomerated acicular crystals, as shown in Fig. 2. EDX images revealed that Mn and Ni elements were uniformly distributed, suggesting that the two metal elements were uniformly dispersed in Mn–Ni-MOF-74. Mn–Ni-MOF-74 had a distinct petal-like morphology because this material system generated a unique heterogeneous structure during phase transition. Macroscopic strain differences resulted from different volume changes in various phases during cooling. As a result of this strain differential, stress eventually concentrated on the material's surface, where it took the shape of a fracture with petals. The petal-like shape with a greater specific surface area and number of active sites improved the material's adsorption capacity.44,45 According to the above characterization, it was found that the appearance of MOF-74 was affected by the introduction of second metal ions, and the differing morphologies of the three bimetallic MOF-74 materials might be one of the reasons for their different iodine adsorption properties.
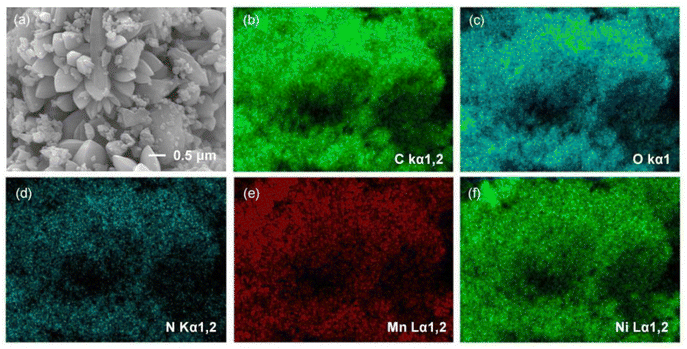 | ||
| Fig. 2 (a) SEM image of Mn–Ni-MOF-74. (b–f) EDX elemental distribution mapping images of Mn–Ni-MOF-74. | ||
3.2 Structural characterization of Mn–Ni-C200, Mn–Ni-C400 and Mn–Ni-C600
In order to further investigate the structural changes of Mn–Ni-MOF-74 derived materials during carbonization, Mn–Ni-C200, Mn–Ni-C400 and Mn–Ni-C600 were analyzed by PXRD, as shown in Fig. 3a. When the calcination temperature reached 600 °C, the small-angle diffraction peaks of MOF-74 (2θ = 7.0° and 12.0°) disappeared, and the skeleton of the material collapsed.46 The diffraction peaks at 2θ = 35.1°, 40.6° and 58.7° corresponded to the MnO structure,47 the diffraction peaks at 2θ = 44.4°, 51.8° and 76.3° corresponded to the metal Ni structure,48 and the diffraction peak at 2θ = 47.6° corresponded to the Mn3O4 structure.49 | ||
| Fig. 3 (a) PXRD patterns of Mn–Ni-C200, Mn–Ni-C400 and Mn–Ni-C600. (b) FTIR spectra of Mn–Ni-C200, Mn–Ni-C400 and Mn–Ni-C600. (c) TG curves of Mn–Ni-C200, Mn–Ni-C400 and Mn–Ni-C600. | ||
The FTIR spectra of Mn–Ni-C200, Mn–Ni-C400 and Mn–Ni-C600 were recorded in the frequency range of 4000–500 cm−1, as shown in Fig. 3b. The characteristic peak of Mn–Ni-C200 at 2930 cm−1 was caused by the stretching vibration and bending vibration of the C–H group.40 The characteristic peaks of Mn–Ni-C200 at 1656 and 1556 cm−1 were due to the stretching vibrations of –COOH and C![[double bond, length as m-dash]](https://www.rsc.org/images/entities/char_e001.gif) O.41 The characteristic peaks of Mn–Ni-C400 and Mn–Ni-C600 at 1544 and 1630 cm−1, respectively, were due to the stretching vibration of C
O.41 The characteristic peaks of Mn–Ni-C400 and Mn–Ni-C600 at 1544 and 1630 cm−1, respectively, were due to the stretching vibration of C![[double bond, length as m-dash]](https://www.rsc.org/images/entities/char_e001.gif) O.50 The characteristic peaks of Mn–Ni-C200 and Mn–Ni-C400 at 1405 and 1403 cm−1, respectively, were caused by the C
O.50 The characteristic peaks of Mn–Ni-C200 and Mn–Ni-C400 at 1405 and 1403 cm−1, respectively, were caused by the C![[double bond, length as m-dash]](https://www.rsc.org/images/entities/char_e001.gif) C stretching vibration of mononuclear aromatic hydrocarbons, corresponding to the benzene ring skeleton vibration, indicating that the organic ligand was retained in the target product.42
C stretching vibration of mononuclear aromatic hydrocarbons, corresponding to the benzene ring skeleton vibration, indicating that the organic ligand was retained in the target product.42
The thermal stability of Mn–Ni-C200, Mn–Ni-C400 and Mn–Ni-C600 derived from Mn–Ni-MOF-74 was measured under a nitrogen atmosphere in the temperature range of 20–800 °C (Fig. 3c). It could be clearly seen that the three derived materials began to decompose after about 200 °C and reached a stable state after 400 °C. The final weight losses of Mn–Ni-C200, Mn–Ni-C400 and Mn–Ni-C600 were 64.60%, 31.40% and 17.50%, respectively.
The morphology and elemental distribution of Mn–Ni-C200, Mn–Ni-C400 and Mn–Ni-C600 materials derived from Mn–Ni-MOF-74 were characterized using scanning electron microscopy and EDX images, as shown in Fig. 4, S3 and S4.† The EDX images of the three derived materials show that they are all made of agglomerated acicular crystals and exhibit petal-like shapes. The Mn and Ni elements are also uniformly distributed. With the increase of calcination temperature, the petal structure partially collapsed, and the petal size of Mn–Ni-C600 was the smallest. The findings demonstrated that pyrolysis at various temperatures had an impact on the morphology of the materials derived from Mn–Ni-MOF-74 and that variation in morphology could account for some of the observed differences in iodine adsorption characteristics.
The specific surface area and pore analysis results of Mn–Ni-C200, Mn–Ni-C400 and Mn–Ni-C600 are shown in Fig. 5. The specific surface areas of Mn–Ni-C200, Mn–Ni-C400 and Mn–Ni-C600 were 136, 229 and 262 m2 g−1, respectively, and the average pore radii were 1.2, 9.5 and 5.9 nm, respectively. It was clear that when the calcination temperature increased, the material made of Mn–Ni-MOF-74 had an increased specific surface area. As the temperature increased, Mn–Ni-C400 transformed into a macroporous structure. The material framework disintegrated at around 600 °C, converting Mn–Ni-C600 into a mesoporous structure. It was evident from our previous work51 that the original Mn-MOF-74 had a BET surface area of up to 386 m2 g−1, and the thermogravimetric study revealed that as the temperature increased, the framework of Mn-MOF-74 started to disintegrate. It could be observed from the FTIR spectrum (Fig. S5†) that the position of the characteristic peak of monometallic Mn-MOF-74 was the same46–49 as that of bimetallic Mn-MOF-74, which indicated that bimetallic Mn-MOF-74 retained the structural characteristics of monometallic Mn-MOF-74. Through comparison, it could be seen that the surface area of the new material decreased during pyrolysis. This might be due to the collapse of the frameworks, which exposed more active sites, proving that the metals in the material played an important role.
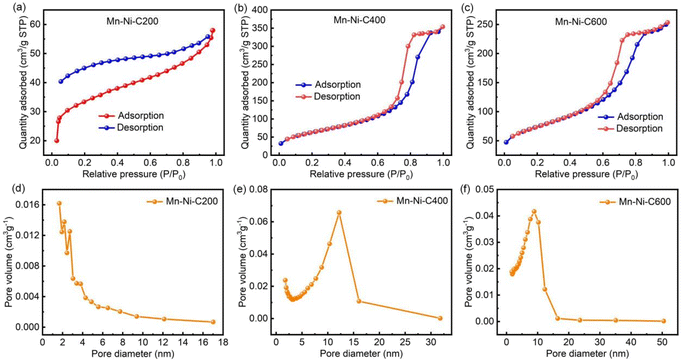 | ||
| Fig. 5 Specific surface area and pore analysis of Mn–Ni-C200 (a and d), Mn–Ni-C400 (b and e) and Mn–Ni-C600 (c and f). | ||
3.4 Iodine adsorption performance test
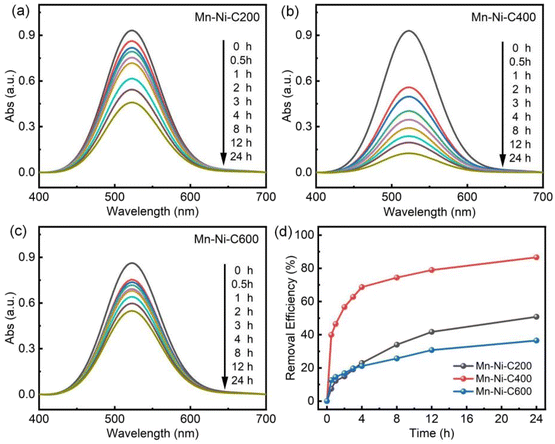
| Materials | Removal rate (%) |
|---|---|
| Mn–Co-MOF-74 | 21.69 |
| Mn–Zn-MOF-74 | 16.89 |
| Mn–Ni-MOF-74 | 65.36 |
| Mn–Ni-C200 | 50.79 |
| Mn–Ni-C400 | 86.56 |
| Mn–Ni-C600 | 36.45 |
Inductively coupled plasma atomic emission spectrometry (ICP-AES) was used to examine the metal components of the bimetallic MOF-74 and the pyrolyzed Mn–Ni-CX samples, which helped determine how the bimetallic system affected the iodine adsorption performance. The data shown in Table S1† indicate that there was a relatively high content of additional secondary metals, such as Zn, Co, and Ni, and that this content increased as the pyrolysis temperature increased. Based on these experimental findings, it was hypothesized that increasing the heat treatment temperature would enhance the iodine adsorption capacity. On the other hand, the iodine adsorption performance declined with excessive metal presence. Excessive metal accumulation might be the cause of this phenomenon as it reduces the dispersion and impairs the adsorption of iodine molecules.52
The iodine adsorption experiment was conducted on single-metal Mn-MOF-74 and Ni-MOF-74 (Fig. S6†) in order to investigate the role played by each metal in Mn–Ni-C400. It could be seen that Mn-MOF-74 had a weaker adsorption capacity for iodine than Ni-MOF-74, and their iodine removal rates were 41.44% and 65.69%, respectively. The iodine adsorption experiment was conducted using the derivative materials of Mn-MOF-74 and Ni-MOF-74, which were developed at the optimal heat treatment temperature of 400 °C. As a result, Ni-MOF-C400 had a considerable adsorption capacity and a clearance rate of up to 79.69%. Therefore, it could be inferred that the second metal Ni played an important role in the iodine adsorption process.
3.5 Kinetic analysis of iodine adsorption
The adsorption characteristics of Mn–Ni-C400 were investigated further using the Freundlich and Langmuir models.53 The Langmuir model assumed that the adsorption process was homogeneous on the surface, while the Freundlich model assumed that the adsorption process was heterogeneous on the surface. The linear forms of the Langmuir model and the Freundlich isotherm are expressed by eqn (2) and (3), respectively: | (2) |
 | (3) |
As shown in Fig. 9, the experimental trend described by the Langmuir model was found to be slightly better than that described by the Freundlich model, with R2 values of 0.9769 and 0.9348, respectively. This suggested that the homogeneity of the MOF surface resulted in the adsorption of iodine ions in a monolayer manner.54 It could be clearly seen from Table 2 that for the Langmuir model, the qmax generated by the Ce/qe to Ce curve was 326 mg g−1 and the KL value was 0.0081 L mg−1. A graph of log(qe) to log(Ce) yielded a KF value of 1.69 (mg g−1) (L mg−1)1/n.
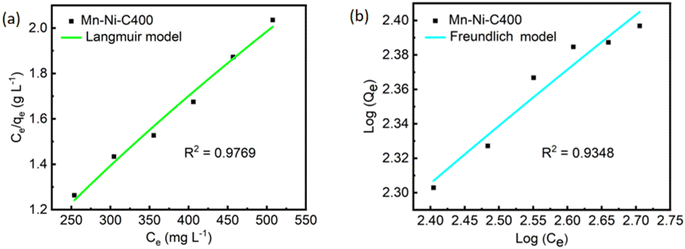 | ||
| Fig. 9 Langmuir (a) and Freundlich (b) models of Mn–Ni-C400 at six different concentrations for Mn–Ni-C400. | ||
| Model | Parameter | Mn–Ni-C400 |
|---|---|---|
| Langmuir | q max (mg g−1) | 326 |
| K L (L mg−1) | 0.0081 | |
| R 2 | 0.9769 | |
| Freundlich | K F (mg g−1) (L mg−1)1/n | 1.69 |
| n | 2.83 | |
| R 2 | 0.9348 |
3.6 Adsorption mechanism
 | ||
| Fig. 10 (a) PXRD patterns of Mn–Ni-C400 and Mn–Ni-C400@I. (b) FTIR spectra of Mn–Ni-C400 and Mn–Ni-C400@I. (c) TG curves of Mn–Ni-C400 and Mn–Ni-C400@I. | ||
In order to explore whether iodine adsorption would affect the morphology of Mn–Ni-C400, the morphology and elemental distribution of Mn–Ni-C400 and Mn–Ni-C400@I were characterized using SEM and EDX images (Fig. 11). It could be clearly seen that the iodized sample Mn–Ni-C400@I still maintained the original petal-like structure composed of agglomerated acicular crystals, but particles were attached to the surface of the acicular crystals. The EDX image showed the presence of C, N, O, Mn, Ni and I, which were uniformly distributed on the surface of the material.
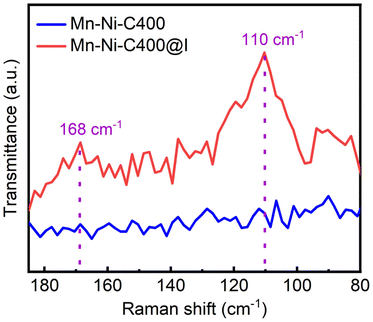
The chemical state of iodine in Mn–Ni-C400@I after iodine adsorption was investigated. First, the Raman spectra of Mn–Ni-C400 and Mn–Ni-C400@I before and after iodine adsorption were recorded. As shown in Fig. 12, there is no obvious characteristic peak on the Raman spectra of Mn–Ni-C400, but there are characteristic peaks at 110 and 168 cm−1 on the Raman curve of Mn–Ni-C400@I after iodine adsorption, corresponding to the peaks of I3− and I5−, respectively.55 The above analysis results showed that the iodine in Mn–Ni-C400@I mainly existed in the form of polyiodide anions, and there was charge interaction with Mn–Ni-C400, which led to the formation of I3− and I5− complexes.56
In order to further explore the iodine adsorption mechanism, XPS analysis was performed on Mn–Ni-C400 and Mn–Ni-C400@I. As shown in Fig. 13, the XPS spectrum of Mn–Ni-C400, together with the 3d spectrum, shows 0.005 M (for clear peak intensity) iodine adsorption. After adsorption, I 3d peaks appeared in the range of 610.0 to 640.0 eV, which were attributed to I 3d5/2 and I 3d3/2 and adsorbed on Mn–Ni-C400.57,58 According to the binding energies of 3d5/2 and 3d3/2, iodine was adsorbed on Mn–Ni-C400 in the form of I2 molecules at 631.0 eV and 619.6 eV, respectively.59
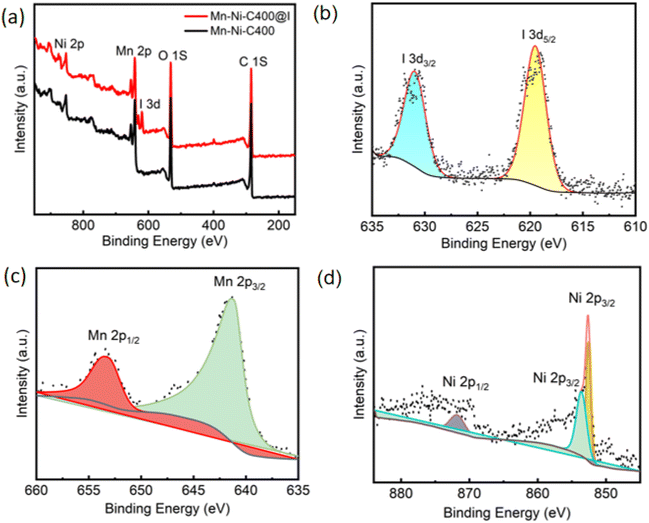 | ||
| Fig. 13 (a) XPS spectra of Mn–Ni-C400 and Mn–Ni-C400@I. (b) I 3d of Mn–Ni-C400@I. (c) Mn 2p of Mn–Ni-C400@I. (d) Ni 2p of Mn–Ni-C400@I. | ||
According to the above analysis, the adsorption performance of Mn–Ni-C400 for iodine might be related to the following factors (Scheme 2). The first is the macroporous structure of Mn–Ni-C400, whose pore size was 9.5 nm with a BET specific surface area of 229 m2 g−1. One theory was that the porosity of Mn–Ni-C400 contributed to its excellent iodine adsorption performance. Secondly, according to the analysis of XPS results, I was mainly adsorbed on Mn–Ni-C400 in the form of simple substances, and 3d peaks of I appeared in the range of 610.0 to 640.0 eV, which was due to the adsorption of I 3d to Mn–Ni-C400. The Raman spectrum study indicated that the iodine in Mn–Ni-C400@I was mostly present as polyiodide anions and that charge interactions with Mn–Ni-C400 led to iodine adsorption by Mn–Ni-C400. The Mn 2p spectrum (Fig. 13c) showed the diffraction peaks of Mn 2p1/2 and Mn 2p3/2 corresponding to the binding energies of 653.4 eV and 641.3 eV, respectively,60–62 and the Ni 2p spectrum (Fig. 13d) showed the diffraction peak of Ni 2p1/2 corresponding to the binding energy of 871.8 eV.63 Furthermore, the XPS analysis revealed no chemical link between the metal and iodine, and the binding energies of 852.6 and 853.6 eV were ascribed to the diffraction peak of Ni 2p3/2.64 As a result, Mn–Ni-C400 primarily relies on physical adsorption to adsorb iodine.
Iodine vapor was investigated in order to learn more about the adsorption characteristics of Mn–Ni-C400 (Fig. S10a†). Iodine and 10 mg of Mn–Ni-C400 were heated to 75 °C for 24 h in a closed container for these studies. The amount of iodine vapor adsorbed reached 720 mg g−1 once the adsorption approached saturation after 24 hours, as indicated by eqn (4):
| W = [(Mt − M0)/m0] × 100 | (4) |
This was because, despite initially having a lot of free pores, the adsorption process proceeded more slowly as iodine was adsorbed because fewer free pores were accessible. Iodine vapor in cyclohexane solution exhibited a greater adsorption capacity than iodine itself, likely because the solvent molecules are co-encapsulated.65 The iodine adsorption capacity of Mn–Ni-C400 in cyclohexane was compared with that of other materials reported in the literature.66–68 The results showed that the iodine adsorption capacity of Mn–Ni-C400 in cyclohexane was higher than that of some other materials reported (Table S2†). Therefore, Mn–Ni-C400 is a promising material for radioiodine capture. Similarly, Mn–Ni-C400 that had adsorbed iodine solution was subjected to a desorption experiment (Fig. S10b†). The Mn–Ni-C400 (5 mg) loaded with iodine solution was added to 5 mL of ethanol. The absorption spectra of iodine released at different times were measured by the UV-vis spectra of the samples. The color of the solvent changed from colorless to dark brown due to the absorption bands of polyiodide ions and iodine molecules in ethanol, observed at 290 and 360 nm, respectively. A comparison of the PXRD patterns of Mn–Ni-C400 and Mn–Ni-C400@I (Fig. 10a) showed that the framework of the material did not collapse after iodine adsorption, indicating the good stability of the material, and the position of the diffraction peak of the material did not change significantly, indicating that the crystal structure of the two materials did not change. Moreover, no diffraction peak corresponding to iodine and metal coordination was observed, further indicating that the adsorption was physical adsorption. Recyclability is a prerequisite for developing iodine-capturing adsorbents that would meet practical production needs, achieve cost-effectiveness, and find useful applications. The adsorption properties of the regenerated adsorbent are shown in Fig. S10c.† After five cycles, the adsorption capacity did not decrease significantly, indicating that the synthetic material is reusable.
4. Conclusion
By using the reflux approach, a number of bimetallic MOF-74 materials were effectively synthesized for the iodine adsorption process. Mn–Ni-MOF-74 exhibited superior adsorption capability for radioiodine. By pyrolyzing a series of bimetallic materials at 400 °C, the Mn–Ni-C400 series exhibited strong iodine adsorption capabilities. Experiments were conducted consecutively in order to further investigate the effects of varying reaction temperature, iodine solution concentration, and interfering ions on removal efficiency. Ultimately, further examination of the process suggested that the porosity of Mn–Ni-C400 contributes to its high iodine adsorption performance.Author contributions
Wen-Ze Li: Writing – original draft; resources; and project administration. Fu-Yu Guo: Writing – original draft; visualization; and validation. Jing Li: Writing – original draft; investigation; and formal analysis. Xiao-Sa Zhang: Methodology and software. Yu Liu: Conceptualization; methodology; and project administration. Jian Luan: Writing – review & editing; investigation; and resources.Data availability
The data supporting this article have been included as part of the ESI.†Conflicts of interest
The authors declare no competing financial interest.Acknowledgements
This work was financially supported by the Science and Technology Department of Liaoning Province (2022-NLTS-18-05 and 2023JH2/101300231) and the Liaoning Provincial Department of Education (LJKMZ20220790, LJKMZ20220793 and LJKMZ20220795).References
- R. P. Schwarzenbach, B. I. Escher, K. Fenner, T. B. Hofstetter, C. A. Johnson, U. von Gunten and B. Wehrli, Science, 2006, 313, 1072–1077 CrossRef CAS PubMed.
- D. Luo, Y. He, J. Tian, J. L. Sessler and X. Chi, J. Am. Chem. Soc., 2022, 144, 113–117 CrossRef CAS PubMed.
- J. E. T. Hoeve and M. Z. Jacobson, Energy Environ. Sci., 2012, 5, 8743–8757 RSC.
- M. R. Wiesner, G. V. Lowry, P. Alvarez, D. Dionysiou and P. Biswas, Environ. Sci. Technol., 2006, 40, 4336–4345 CrossRef CAS PubMed.
- A. Saiz-Lopez, J. M. C. Plane, A. R. Baker, L. J. Carpenter and R. von Glasow, Chem. Rev., 2012, 112, 1773–1804 CrossRef CAS PubMed.
- F. C. Kupper, M. C. Feiters, B. Olofsson, T. Kaiho, S. Yanagida, M. B. Zimmermann, L. J. Carpenter, G. W. Luther, Z. L. Lu, M. Jonsson and L. Kloo, Angew. Chem., Int. Ed., 2011, 50, 11598–11620 CrossRef PubMed.
- A. Saiz-Lopez, J. M. C. Plane, A. R. Baker, L. J. Carpenter, R. von Glasow, J. C. G. Martin, G. McFiggans and R. W. Saunders, Chem. Rev., 2012, 112, 1773–1804 CrossRef CAS PubMed.
- F. Ahmadijokani, H. Molavi, M. Rezakazemi, T. M. Aminabhavi and M. Arjmand, Chem. Rev., 2021, 445, 214037 CAS.
- M. Taseidifar, F. Makavipour, R. M. Pashley and A. F. M. M. Rahman, Environ. Technol., 2017, 8, 182–190 Search PubMed.
- R. Li, Y. Zhao, Y. Chen, Z. Liu, B. Han and Z. Li, Commun. Chem., 2018, 1, 69 CrossRef.
- Z. Fei, F. D. Bobbink, E. Paunescu, R. Scopelliti and P. J. Dyson, Inorg. Chem., 2015, 54, 10504–10512 CrossRef CAS PubMed.
- Z. Zhang, X. Dong, J. Yin, Z. G. Li, X. Li, D. Zhang, T. Pan, Q. Lei, X. Liu, Y. Xie, F. Shui, J. Li, M. Yi, J. Yuan, Z. You, L. Zhang, J. Chang, H. Zhang, W. Li, Q. Fang, B. Li, X. H. Bu and Y. Han, J. Am. Chem. Soc., 2022, 144, 6821–6829 CrossRef CAS PubMed.
- X. Yang, X. Liu, Y. Liu, X. F. Wang, Z. Chen and X. Wang, Front. Chem. Sci. Eng., 2023, 17, 395–403 CrossRef CAS.
- P. H. M. Andrade, M. Moreau, N. Henry, M. T. Bakouche, S. Duval, C. Volkringer, T. Loiseau, M. Hureau and A. Moissette, J. Phys. Chem. C, 2023, 127, 4618–4635 CrossRef CAS.
- M. Leloire, C. Walshe, P. Devaux, R. Giovine, S. Duval, T. Bousquet, S. Chibani, J. Paul, A. Moissette and H. Vezin, Chem. – Eur. J., 2022, 28, 2021–4437 Search PubMed.
- S. Shetty, N. Baig, S. A. Wahed, A. Hassan, N. Das and B. Alameddine, Polymers, 2023, 15, 4153 CrossRef CAS PubMed.
- N. Baig, S. Shetty, S. S. Pasha, S. K. Pramanik and B. Alameddine, Polymer, 2022, 239, 124467 CrossRef CAS.
- S. Shetty, N. Baig and B. Alameddine, Polymers, 2022, 14, 4818 CrossRef CAS PubMed.
- N. Baig, S. Shetty, S. S. Habib, A. A. Husain, S. Al-Mousawi and B. Alameddine, Polymers, 2022, 14, 3727 CrossRef CAS PubMed.
- C. Liu, Y. Jin, Z. Yu, L. Gong, H. Wang, B. Yu, W. Zhang and J. Jian, J. Am. Chem. Soc., 2022, 144, 12390–12399 CrossRef CAS PubMed.
- T. Liu, Y. Zhao, M. Song, X. Pang, X. Shi, J. Jia, L. Chi and G. Lu, J. Am. Chem. Soc., 2023, 145, 2544–2552 CrossRef CAS PubMed.
- Y. Xie, T. Pan, Q. Lei, C. Chen, X. Dong, Y. Yuan, W. Al Maksoud, L. Zhao, L. Cavallo, I. Pinnau and Y. Han, Nat. Commun., 2022, 13, 2878 CrossRef CAS PubMed.
- K. L. Lauren, E. Kreno, O. K. Farha, M. Allendorf, R. P. Van Duyne and J. T. Hupp, Chem. Rev., 2012, 112, 1105–1125 CrossRef PubMed.
- K. Jayaramulu, D. P. Dubal, A. Schneemann, V. Ranc, C. Perez-Reyes, J. Stráská, T. Kment, M. Otyepka, R. A. Fischer and R. Zboil, Adv. Funct. Mater., 2019, 29, 1902539 CrossRef.
- J. Yang and Y. W. Yang, Small, 2020, 16, 1906846 CrossRef CAS PubMed.
- T. Wang, L. Gao, J. Hou, S. J. A. Herou, J. T. Griffiths, W. Li, J. Dong, S. Gao, M. M. Titirici, R. V. Kumar, A. K. Cheetham, X. Bao, Q. Fu and S. K. Smoukov, Nat. Commun., 2019, 10, 1340 CrossRef PubMed.
- Y. Wang, H. Jin, Q. Ma, K. Mo, H. Mao, A. Feldhoff, X. Cao, Y. Li, F. Pan and Z. Jiang, Angew. Chem., Int. Ed., 2020, 59, 4365–4369 CrossRef CAS PubMed.
- A. H. Fei, T. W. Jian, L. Xin, Y. H. Mei, Y. L. Yun, Z. Hao, S. H. Ming and B. Hao, Chem. Eng. J., 2023, 469, 144052 CrossRef.
- A. Wang, M. Luo, B. Luo, Y. Song, Z. Yang, M. Li and B. Shi, Ind. Eng. Chem. Res., 2022, 61, 3941–3951 CrossRef CAS.
- X. Zhang, J. S. Luo, K. Wan, D. Plessers, B. Sels, J. X. Song, L. G. Chen, T. Zhang, P. Y. Tang, J. R. Morante, J. Arbiol and J. Fransaer, J. Mater. Chem. A, 2019, 7, 1616–1628 RSC.
- S. M. El-Sheikh, D. I. Osman, O. I. Ali, W. G. Shousha, M. A. Shoeib, S. M. Shawky and S. M. Sheta, Appl. Surf. Sci., 2021, 562, 150202 CrossRef CAS.
- H. Y. Chen, Y. Q. Huo, K. Z. Cai and Y. Teng, Synth. Met., 2021, 276, 116761 CrossRef CAS.
- Q. Huo, J. S. Li, X. R. Qi, G. Q. Liu, X. B. Zhang, B. Y. Zhang, Y. Ning, Y. F. Fu, J. M. Liu and S. Y. Liu, Chem. Eng. J., 2019, 378, 122106 CrossRef CAS.
- Z. Zhang, J. Liu, Z. Wang and J. Y. Zhang, Ind. Eng. Chem. Res., 2021, 60, 781–789 CrossRef CAS.
- R. N. Hu, H. Y. Huang, H. Chen, J. H. Zhang, Q. M. Zhong, X. Wu and S. T. Yang, Environ. Sci.: Processes Impacts, 2024, 26, 710–720 RSC.
- J. G. Flores, J. A. Pliego, N. M. Guaregua, I. A. Ibarra and M. S. Sanchez, Catal. Today, 2022, 394–396, 295–303 CrossRef CAS.
- Y. Shi, Q. Chu, W. Xiong, J. S. Gao, L. Huang, Y. Q. Zhang and Y. Ding, Chem. Eng. Process., 2021, 159, 108232 CrossRef CAS.
- H. Kim and C. S. Hong, CrystEngComm, 2021, 23, 1377–1387 RSC.
- Z. Gao, L. Liang, X. Zhang, P. Xu and J. Sun, ACS Appl. Mater. Interfaces, 2021, 13, 61334–61345 CrossRef CAS PubMed.
- G. Dang, H. Lam, A. Nguyen, D. Le, T. Truong and N. Phan, J. Catal., 2016, 337, 167–176 CrossRef CAS.
- A. Vimont, J. M. Goupil, J. C. Lavalley, M. Daturi, S. Surble, C. Serre, F. Millange, G. Ferey and N. Audebrand, J. Am. Chem. Soc., 2006, 128, 3218–3227 CrossRef CAS PubMed.
- K. Tan, S. Zuluaga, Q. Gong, P. Canepa, H. Wang, J. Li, Y. J. Chabal and T. Thonhauser, Chem. Mater., 2014, 26, 6886–6895 CrossRef CAS.
- C. R. Muniz, J. M. G. Vallejo, P. J. Merkling and S. Calero, ACS Appl. Mater. Interfaces, 2022, 12, 54980–54990 CrossRef PubMed.
- J. Shi, H. B. Tai, D. W. Xu, X. M. Kang and Z. L. Liu, Dalton Trans., 2024, 53, 3167–3179 RSC.
- C. F. Zhao, H. Y. Liu, J. W. Liu, Y. H. Shi, S. G. Wang, Q. W. Tang, X. B. Zhu, H. M. Zhang and Y. Zhao, RSC Adv., 2023, 13, 8706–8717 RSC.
- K. Kim, J. Culp, P. Ohodnicki, P. Thallapally and J. Tao, ACS Appl. Mater. Interfaces, 2021, 13, 35223–35231 CrossRef CAS PubMed.
- B. Yang, H. J. Quan, J. Gao, S. H. Wang, N. Wang and C. L. Sun, J. Alloys Compd., 2021, 889, 161680 CrossRef.
- X. J. Hong, C. L. Song, Z. M. Wu, Z. H. Li, Y. P. Cai, C. X. Wang and H. Wang, Chem. Eng. J., 2021, 404, 126566 CrossRef CAS.
- J. X. Feng, S. H. Ye, X. F. Lu, Y. X. Tong and G. R. Li, ACS Appl. Mater. Interfaces, 2015, 7, 11444–11451 CrossRef CAS PubMed.
- Q. Zhang, Y. Liu, Z. Wang, P. Wang, Z. Zheng, H. Cheng, X. Qin, X. Zhang, Y. Dai and B. Huang, J. Colloid Interface Sci., 2022, 617, 578–584 CrossRef CAS PubMed.
- W. Z. Li, J. Li, W. L. Ma, X. S. Zhang, Y. Liu and J. Luan, Talanta, 2024, 269, 125496 CrossRef CAS PubMed.
- C. D. Agostino, G. Brett, G. Divitini, C. Ducati, G. J. Hutchings, M. D. Mantle and L. F. Gladden, ACS Catal., 2017, 7, 4235–4241 CrossRef.
- T. Alghamdi, P. O. Aina, A. A. Rownaghi and F. Rezaei, ACS Appl. Mater. Interfaces, 2023, 15, 33621–33632 CrossRef CAS PubMed.
- D. Chen, T. Ma, X. Zhao, X. Jing, R. Zhao and G. Zhu, ACS Appl. Mater. Interfaces, 2022, 14, 47126–47135 CrossRef CAS PubMed.
- M. Colovi'c, M. Hajzeri, M. Tramšek, B. Orel and A. K. Surca, Sol. Energy Mater. Sol. Cells, 2021, 220, 110863 CrossRef.
- Y. Z. Tang, Z. J. He, W. J. Xue, H. l. Huang and G. L. Zhang, Chem. Eng. J., 2023, 470, 144211 CrossRef CAS.
- G. Li, Y. Huang, J. Lin, C. Yu, Z. Liu, Y. Fang, Y. Xue and C. Tang, Chem. Eng. J., 2020, 382, 122833 CrossRef CAS.
- X. Li, H. Xiong and Q. Jia, ACS Appl. Mater. Interfaces, 2019, 11, 46205–46211 CrossRef CAS PubMed.
- J. Chen, A. Gu, E. D. Miensah, Y. Liu, P. Wang, P. Mao, C. Gong, Y. Jiao, K. Chen and Y. Yang, J. Hazard. Mater., 2021, 416, 126097 CrossRef CAS PubMed.
- G. C. Allen, S. J. Harris, J. A. Jutson and J. M. Dyke, Appl. Surf. Sci., 1989, 37, 111–134 CrossRef CAS.
- B. J. Tan, K. J. Klabunde and P. M. A. Sherwood, J. Am. Chem. Soc., 1991, 113, 855–861 CrossRef CAS.
- V. DiCastro and G. Polzonetti, J. Electron Spectrosc. Relat. Phemon., 1989, 48, 117–123 CrossRef CAS.
- A. M. Venezia, R. Bertoncello and G. Deganello, Surf. Interface Anal., 1995, 23, 239–247 CrossRef CAS.
- E. E. Khawaja, M. A. Salim, M. A. Khan, F. F. Al-Adel, G. D. Khattak and Z. Hussain, J. Non-Cryst. Solids, 1989, 110, 44–52 CrossRef.
- T. M. Geng, G. F. Chen, L. Z. Ma, C. Zhang, W. Y. Zhang and H. Xu, Eur. Polym. J., 2019, 115, 37–44 CrossRef CAS.
- R. L. Yu, Q. F. Li, T. Zhang, Z. L. Li and L. Z. Xia, Process Saf. Environ. Prot., 2023, 174, 770–777 CrossRef CAS.
- M. Li, G. Y. Yuan, Y. Zeng, Y. Y. Yang, J. L. Liao, J. J. Yang and N. Liu, J. Radioanal. Nucl. Chem., 2020, 324, 1167–1177 CrossRef CAS.
- J. Y. Xian, Z. Y. Huang, X. X. Xie, C. J. Lin, X. J. Zhang, H. Y. Song and S. R. Zheng, Chin. J. Struct. Chem., 2023, 42, 100005 CrossRef CAS.
Footnote |
| † Electronic supplementary information (ESI) available. See DOI: https://doi.org/10.1039/d4dt01554a |
| This journal is © The Royal Society of Chemistry 2024 |

