 Open Access Article
Creative Commons Attribution 3.0 Unported Licence
Precursor- and waste-free synthesis of spark-ablated nanoparticles with enhanced photocatalytic activity and stability towards airborne organic pollutant degradation†
Sarka
Drdova
ab,
Min
Gao
ab,
Olga
Sambalova
 b,
Robin
Pauer
c,
Zhouping
Zhou
d,
Sofia
Dimitriadou
e,
Andreas
Schmidt-Ott
de and
Jing
Wang
 *ab
*ab
aInstitute of Environmental Engineering, ETH Zurich, 8093 Zürich, Switzerland. E-mail: jing.wang@ifu.baug.ethz.ch
bLaboratory for Advanced Analytical Technologies, Empa – Swiss Federal Laboratories for Materials Science and Technology, 8600 Dübendorf, Switzerland
cElectron Microscopy Center, Empa – Swiss Federal Laboratories for Materials Science and Technology, 8600 Dübendorf, Switzerland
dChemical Engineering Department, Delft University of Technology, 2600 AA Delft, The Netherlands
eVSPARTICLE B.V, 2629 JD Delft, The Netherlands
First published on 3rd January 2024
Abstract
Photocatalyst synthesis typically involves multiple steps, expensive precursors, and solvents. In contrast, spark ablation offers a simple process of electrical discharges in a gap between two electrodes made from a desirable material. This enables a precursor- and waste-free generation of pure metal oxide nanoparticles or mixtures of various compositions. This study presents a two-step method for the production of photocatalytic filters with deposited airborne MnOx, TiO2, and ZnO nanoparticles using spark ablation and calcination processes. The resulting MnOx and TiO2 filters demonstrated almost twice the activity with outstanding performance stability, as compared to sol–gel MnO2 and commercial TiO2. The introduced method is not only simple, precursor- and waste-free, and leads to superior performance for the case studied, but it also has future potential due to its versatility. It can easily produce mixed and doped materials with further improved properties, making it an interesting avenue for future research.
Environmental significanceThe presented spark ablation and direct deposition of photocatalytic nanoparticles for the production of functionalized filters hold significant environmental and nanotechnology implications, offering a promising solution to address challenges associated with air pollution. Firstly, this innovative method reduces the environmental impact of photocatalyst production by eliminating complexity and the need for costly and potentially harmful precursors, while minimizing waste generation during the synthesis process. Secondly, this study highlights the importance of nanotechnology in advancing environmental sustainability, as the spark-ablated and calcined nanoparticles exhibited superior photocatalytic performance and durability compared to traditionally synthesized materials. The simplicity, sustainability, and adaptability to produce various materials and mixtures make the presented method a promising avenue for future research in environmental pollution remediation. |
Introduction
Atmospheric and indoor air pollutants, such as nitrogen and carbon oxides (NOx and CO) and volatile organic compounds (VOCs), represent a serious risk for human health in indoor and outdoor environments. VOCs are widely used in both domestic and industrial activities.1–3 Many VOC emissions are toxic, carcinogenic, mutagenic, or teratogenic, and they can affect the building occupants' comfort and health, a phenomenon referred to as the sick building syndrome.4 VOC removal by adsorption is well established in environmental and indoor air control technologies. In this process, the pollutants are simply transferred from the gas phase onto the surface of the solid phase requiring additional treatment steps. On the other hand, photocatalysis based on semiconductors has proved to be an effective, inexpensive, and environmentally friendly process that enables the oxidation of VOCs into water and carbon dioxide. The traditional process of photocatalysis generates highly energetic electrons (e−) and holes (h+) upon light irradiation, which contribute to the formation of reactive oxygen species, such as O2˙− and OH˙ radicals, capable of decomposing organic pollutants.2 Titanium dioxide (TiO2) and zinc oxide (ZnO) are by far the most commonly used and studied photocatalytic semiconductors mainly due to their exceptional optical and electronic properties, high efficiency, environmental harmlessness and low cost.1 Owing to their wide band gap, the conventional photocatalysts require UV irradiation for the activation, which makes them inapt for solar irradiation offering only about 4% of the UV spectrum. In order to utilize the full solar spectrum, visible-infrared light-driven catalysts have been extensively investigated mainly by catalyst doping, which enables reduction of the wide band gap.5 Recently, manganese oxide (MnO2) and its nanocomposites have been investigated for photocatalytic and photothermocatalytic performance owing to their effective activation by visible and infrared irradiation, which represent the majority of the solar spectrum.6–9 In addition to that, MnO2 is also attractive due to its inexpensiveness, earth-abundance, and environmental benignity.8 Similarly, Mn3O4, Mn2O3, and MnO have been investigated for their photocatalytic properties.7,8,10 Given the complexity of the driving mechanism that further exacerbated by the multitude of manganese oxide variations, the investigation of the primary driving mechanism in most cases poses a substantial challenge yet holds profound significance.11 It is believed that the oxidation activity is based on either light-driven thermal catalysis or the synergy of photochemical and thermochemical effects involving both photogenerated electron–hole pairs and the activation of surface lattice oxygen due to the temperature elevation.6,12,13Although much effort has been devoted to the development of an efficient UV and solar-light-driven photocatalyst and understanding of the underlying mechanisms, there are several common challenges for practical applications, such as complex synthesis routes, various optical absorption properties, uncertain charge separation and transfer, and problematic photocatalytic stability.2,5 In general, the catalytic properties depend on the electronic structure of the surface of the catalyst that induces the reaction of adsorbed molecules. The surface properties and curvature affect the adsorption strength as well as the coordination number of catalyst surface atoms, which influences the number of dangling bonds at the surface and alters the electronic orbital configuration. This implies that photoactivity is strongly affected by the size and phase of a semiconductor material.14,15 We will show below that such properties can be optimized through a flexible nanoparticle synthesis method.
Traditionally, the production of semiconductor nanoparticles is performed by wet-chemistry routes, such as sol–gel and hydrothermal methods.16 These techniques provide unique possibilities for tailoring the size and phase of nanoparticles, but they employ precursor solutions that can lead to impurities and the production of hazardous waste. There are several gas-phase alternatives for nanoparticle production, such as a flame synthesis17 or material ablation using lasers and sparks.18,19 Both ablation-based and flame-based nanoparticle syntheses have their own merits and limitations and the choice between the two methods depends on specific requirements. In general, the main advantage of flame synthesis is the relatively high production rate whereas contamination during high-temperature reactions, limited material compatibility, and proper control of the synthesis parameters involving solvents and precursors are the main limitations.17 In contrast, laser ablation18 and spark ablation19 provide simple and easy-to-control, versatile, and environmentally friendly alternatives. The nanoparticle formation in these processes is based on the direct and local evaporation of bulk materials without the involvement of any precursors or waste production. Therefore, the ablation-based methods offer material versatility and high purity of produced nanoparticles.20 While these gas-phase methods offer a promising alternative for nanoparticle production, it is worth noting that a low production rate is the main limitation.21
Spark ablation production of catalytic nanoparticles has gained attention in recent years owing to its unique capability to generate pure metal or semiconductor nanoparticles, mixtures of various compositions,22–24 or their oxides. It is a waste-free synthesis that requires no expensive chemicals or precursors except the substance or mixture of substances intended to form the resulting nanoparticles. During the synthesis of spark ablated nanoparticles, short electrical discharges are induced in the gap between the two electrodes that consist of the substance or composite of choice. The sparks are generated in high frequency forming a plasma where the temperature can exceed 20![[thin space (1/6-em)]](https://www.rsc.org/images/entities/char_2009.gif) 000 K. As a result, the electrodes are ablated by evaporation in a few microseconds. After extinction of the spark, the formed vapour is cooled by adiabatic expansion and by the surrounding stream of inert gas and it condenses to form atomic clusters and sub-20 nm nanoparticles, which are free from surfactants and precursors. The main advantages of spark ablation are i) simplicity and scalability of the process, ii) high purity of produced nanoparticles, iii) facile control of nanoparticle size in the size range where the electronic and optical properties and surface-to-volume characteristics extend bulk material properties significantly, iv) facile control of nanoparticle composition, and v) waste-free environment-friendly process.15,25,26 These characteristics have made this method a perfect candidate for various applications. In particular, the method has been used for the production of diverse materials such as pure metals (W, Cu, Ag, Nb, Pd, Au, Mg, Sb), alloys (Fe/Cu, Fe/Zn), and oxides (CdO, Fe2O3), which have been employed for heterogeneous catalysis, solar energy conversion, or as chemical sensors.15,22,25,26 Among the aforementioned application domains, spark ablated semiconducting materials would have great potential for the development of a novel approach to further enhance the photocatalytic and photothermocatalytic performances. Despite that, few studies have been devoted to the evaluation of spark-ablated nanoparticles for photocatalytic applications. For example, spark-ablated nanoparticles have been used for aerosol catalysis, which was developed as a tool to study the behaviour of catalyst particles with regard to their characteristic properties such as size, morphology, and surface conditions.27 This approach is, however, mainly suitable for analytic purposes, while practical photocatalytic applications would require catalyst immobilization on a supporting material.28 In this regard, spark ablation has been employed to produce functional textiles with antimicrobial activity through aerosol deposition of spark-ablated silver nanoparticles.29 To the best of our knowledge, spark-ablated nanoparticles have never been evaluated for application in photocatalysis, i.e. UV and/or visible-infrared driven photocatalytic decomposition of airborne organic pollutants. In addition, owing to the continuous character of the spark ablation process, nanoparticle generation can beneficially be coupled to direct nanoparticle deposition onto filter media. Photocatalytic filters can thus be manufactured in a single process where the deposition is based on Brownian motion and van-der-Waals-force adherence.15
000 K. As a result, the electrodes are ablated by evaporation in a few microseconds. After extinction of the spark, the formed vapour is cooled by adiabatic expansion and by the surrounding stream of inert gas and it condenses to form atomic clusters and sub-20 nm nanoparticles, which are free from surfactants and precursors. The main advantages of spark ablation are i) simplicity and scalability of the process, ii) high purity of produced nanoparticles, iii) facile control of nanoparticle size in the size range where the electronic and optical properties and surface-to-volume characteristics extend bulk material properties significantly, iv) facile control of nanoparticle composition, and v) waste-free environment-friendly process.15,25,26 These characteristics have made this method a perfect candidate for various applications. In particular, the method has been used for the production of diverse materials such as pure metals (W, Cu, Ag, Nb, Pd, Au, Mg, Sb), alloys (Fe/Cu, Fe/Zn), and oxides (CdO, Fe2O3), which have been employed for heterogeneous catalysis, solar energy conversion, or as chemical sensors.15,22,25,26 Among the aforementioned application domains, spark ablated semiconducting materials would have great potential for the development of a novel approach to further enhance the photocatalytic and photothermocatalytic performances. Despite that, few studies have been devoted to the evaluation of spark-ablated nanoparticles for photocatalytic applications. For example, spark-ablated nanoparticles have been used for aerosol catalysis, which was developed as a tool to study the behaviour of catalyst particles with regard to their characteristic properties such as size, morphology, and surface conditions.27 This approach is, however, mainly suitable for analytic purposes, while practical photocatalytic applications would require catalyst immobilization on a supporting material.28 In this regard, spark ablation has been employed to produce functional textiles with antimicrobial activity through aerosol deposition of spark-ablated silver nanoparticles.29 To the best of our knowledge, spark-ablated nanoparticles have never been evaluated for application in photocatalysis, i.e. UV and/or visible-infrared driven photocatalytic decomposition of airborne organic pollutants. In addition, owing to the continuous character of the spark ablation process, nanoparticle generation can beneficially be coupled to direct nanoparticle deposition onto filter media. Photocatalytic filters can thus be manufactured in a single process where the deposition is based on Brownian motion and van-der-Waals-force adherence.15
In the present study, one-step production of two types of materials was demonstrated employing the spark-ablation method simply by selecting different electrode materials. First, solar light active MnO2 nanoparticles, and second, the traditional UV active photocatalytic nanoparticles, i.e. TiO2 and ZnO, were generated and directly deposited onto glass fiber filters. The bespoken functionalized filters were calcined under an air atmosphere in order to improve the crystallinity and oxidation states of the materials. After that, the filter samples were characterized and evaluated for the simulated solar light-driven photo(thermo)catalytic and UV photocatalytic performance. In addition, their catalytic performances and stabilities were compared to the sol–gel prepared MnO2 and commercially available TiO2 and ZnO nanoparticles. It was proven that the spark-ablation method generates photocatalytic nanoparticles of unique properties resulting in superior catalytic performances and stability in comparison to the nanoparticles produced by sol–gel and commercial products.
Experimental
Characterization
XRD (X-ray diffraction) analysis of coated filters was performed using a PANalytical X'Pert PRO diffractometer (PANalytical, Netherlands) equipped with a Johansson monochromator (Cu Kα1 radiation, λ = 1.5406 Å). Raman spectroscopy of coated filters was performed using a Raman spectrometer LabRAM HR Evolution UV-vis-NIR, Horiba, Japan. The Raman analysis was executed employing a 532 nm laser with an output power of 1500 mW. Electron microscopy (EM) images were recorded on a field-emission scanning electron microscope FEI Nova NanoSEM 230 (FEI, USA) with an accelerating voltage of 10 kV and a working distance of ∼5 mm. Carbon coating was applied before the imaging to avoid surface charging. For transmission electron microscopy (TEM) analysis, the coated filter was dropped into methanol and treated in an ultrasonic bath to detach the powder from the filter fibers. The detached nanoparticles were dispersed in methanol and dropped on a lacey carbon film copper TEM grid. The TEM grid with the sample droplet was dried on a heating plate at 80 °C. TEM images and elemental mappings were recorded using high-resolution scanning transmission electron microscopy (HRTEM) with a camera (Gatan Ultrascan, USA) equipped with STEM, BF, and UDF detectors and energy dispersive X-Ray (EDX; JEOL) on a JEOL JEM2200FS microscope operating at 200 kV. In the TEM images, the diameters of spark-ablated nanoparticles were measured using imaging software (ImageJ) and the statistical analysis was performed for the determination of nanoparticle size distributions. In addition, selected area electron diffraction (SAED) was performed for the analysis of the crystallite structure of spark-ablated nanoparticles. The d-spacing values were obtained from the measurement of the SAED ring diameters using ImageJ software. The d-spacing values were then compared with the standard values of the corresponding Miller indices (hlk) and with the values obtained from an online indexing tool (https://www.odpin.com/). Optical properties were analyzed using a UV-vis-NIR spectrophotometer (UV-3600, Shimadzu). The transmittance and reflectance of the coated glass fiber filters were measured using a UV-vis-NIR with a high-performance double monochromator over the wavelength range of 300 nm to 1500 nm, which was enabled by three detectors (photomultiplier tube (PMT), In-GaAs, and cooled PbS). BaSO4 was used as a baseline and spectralon was used as a reference for reflectance. Spectral absorbance was determined as absorbance = 1 − (reflectance + transmittance). The Tauc plot and first derivative analysis of the absorption spectra were employed to determine the absorption edges and optical band gaps.30–32 X-ray photoelectron spectroscopy (XPS) was performed using a Physical Electronics Quantum 2000 instrument with a monochromatic Al Kα radiation source with an energy of 1486.6 eV. Charge neutralization was accomplished with a dual beam charge neutralization system, using low energy electron and argon ion beams (1 V bias, 20 μA current). XPS survey spectra (BE ranging from 0 to 1100 eV) were recorded with a step size of 0.5 eV at a constant pass energy of 117 eV (power 47.9 W and beam diameter ≈200 μm). High-resolution spectra of the main constituents were recorded with a step size 0.13 eV at a constant pass energy of 58.7 eV. All spectra were calibrated with the C 1s peak of adventitious carbon at 284.8 eV and fitted with mixed Gaussian–Lorentzian components after Shirley background subtraction using CasaXPS software. The peaks in the corresponding core levels of Mn and Ti components were fitted following the empirical models provided by Ilton et al.33 and Oku et al.,34 respectively. The area of the corresponding peaks was used for the estimation of the average surface oxidation state of materials.Spark-ablated nanoparticle production
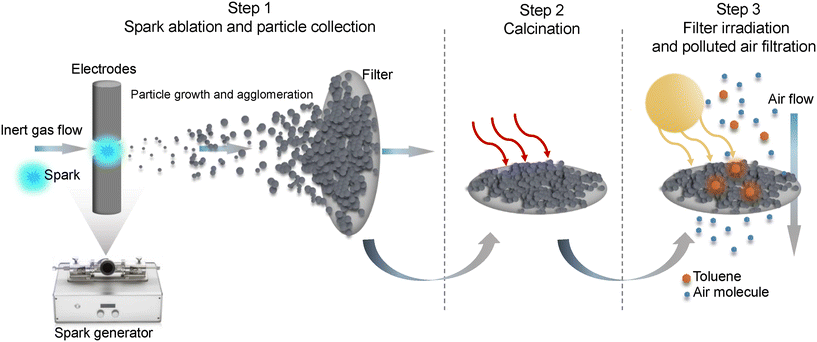
The preparation of samples and the photocatalytic evaluation consisted of three steps as illustrated in Fig. 1, i.e. the generation of nanoparticles using a spark generator followed by direct nanoparticle deposition on a filter, calcination in an air environment to improve oxidation, and irradiation of samples in a photocatalytic reactor. In the first step, manganese oxide, titanium dioxide, and zinc oxide (denoted as MnOx Sp, TiO2 Sp and ZnO Sp, respectively) were produced using the spark ablation (Sp) method. In this process, electrical discharges are initiated between two electrodes made from manganese (95% purity), and titanium and zinc both of 99.99% purity (dimensions of the electrodes: 6 mm diameter and 27 mm length, ChemPur, Germany). The electrodes are mounted onto the holders co-axially, facing each other. Repetitive sparks are induced in the gap between them, each of which forms a vapor cloud of the electrode material, which rapidly condenses into nanoparticles that have the same composition as the electrodes.35 The produced nanoparticles are carried away from the gap by a stream of carrier gas (argon, 99.999% Carbagas, Switzerland). During the manipulation and cleaning of the spark generator, essential protective measures were implemented including the use of a lab coat, gloves, safety goggles, and an FFP3 particulate respirator to ensure adequate protection against potential contact with nanoparticles.The first step of nanoparticle production was directly coupled with the nanoparticle deposition onto a glass fiber filter (LydAir AX1720HD, Lydall Performance Materials, USA). The spark-ablated MnOx and TiO2 nanoparticles were generated using a voltage of 1.3 kV and current of 6 mA and spark-ablated ZnO was generated using 1.2 kV. Different flow rates of the carrier gas were used in order to control the nanoparticle sizes (10 L min−1, 5 L min−1, and 1 L min−1), with higher flow rates producing smaller particles. The corresponding samples prepared with the different flow rates are denoted as Sp10, Sp5, and Sp1, respectively. A VSParticle model G1 was used for the production of MnOx and TiO2.21 This generator, Mn and Ti electrodes, and a filtration unit were provided by VSPARTICLE B.V. (The Netherlands). Spark-ablation of Zn electrodes was performed using a lab-scale spark-generator (TU Delft). The filters were weighted before and after the spark-ablation process in order to determine the mass of loaded nanoparticles. In the second step, the coated filters with spark-ablated nanoparticles were calcined at 350 °C, 450 °C, and 450 °C for 14 hours in air at normal pressure (Nabertherm N3/R Muffle Furnace, Germany). The main criterion to determine the calcination temperature was the thermal stability of a substrate filter. The employed glass fiber filters can usually withstand operating temperatures up to 500 °C. Based on the literature review, the calcination temperature 450 °C was selected for TiO2 materials. In the case of MnOx, preliminary calcination experiments to prepare the catalysts for toluene degradation were conducted using 150, 350, and 450 °C (Fig. S1†). While the MnOx sample was burnt at 450 °C, 350 °C resulted in the highest degradation rate, and thus, this calcination condition was selected. The duration of calcination of 14 h was set based on the literature review and workplace accessibility. During calcination, the particles are oxidized to their final oxidation level whereas some oxidation has already taken place due to the oxygen impurities in the argon carrier gas. After calcination, the samples were stored under ambient conditions before characterization and photocatalytic tests.
Photocatalytic evaluation
The evaluation of photocatalytic activity was performed in a stainless-steel two-compartment reactor (Fig. S2†), which was designed according to a previous study.36 The filter holder-type reactor contained a borosilicate glass enabling irradiation of a filter sample. For the photocatalytic test, the functionalized filters were sealed between the top and bottom compartments and tested for the degradation of toluene, which was selected as a model pollutant. To test the degradation, a stream of toluene–air mixture (50 ppm toluene, 20% oxygen, rest nitrogen, Carbagas, Switzerland) was mixed from a gas tank into the reactor so that a steady-state concentration of around 25 ppm toluene was reached after the closure and circulation of gas in the photocatalytic system. The concentration of toluene was monitored with a gas chromatograph GC-2014 (Shimadzu, Japan) equipped with an Rtx-Wax separation column and an FID-2014 (Shimadzu, Japan) detector. MnOx Sp samples were irradiated using a halogen lamp simulating the solar spectrum with an intensity of 222 mW cm−2 (equivalent to 1.6-fold intensity of the sun, referring to an annual average of solar irradiation). TiO2 Sp and ZnO Sp samples were irradiated with six UV black light bulb (BLB) lamps (368 nm) emitting a total intensity of 0.6 mW cm−2. The temperature and relative humidity inside the reactor were approximately 22 °C and 20%. A simplified pseudo-first order kinetic model was applied for the degradation of toluene:37ln![[thin space (1/6-em)]](https://www.rsc.org/images/entities/char_2009.gif) C0/C = k1·t C0/C = k1·t | (1) |
In addition, a comparison with the traditionally prepared photocatalytic materials was performed. MnOx nanoflakes were produced by the sol–gel method following a previously reported procedure.6 Commercially available TiO2 and ZnO nanoparticles used for comparison were purchased from Sigma Aldrich (titanium(IV) oxide nanopowder, 21 nm primary particle size (TEM), ≥99.5% trace metals basis) and from VWR International GmbH (zinc oxide, NanoArc ZN-0605). In addition, ZnO nanorods were produced following a procedure from Zhong et al.39 These nanoparticles were suspended in demineralized water with 1.5 wt% and sonicated for at least 30 minutes. After that, the filter medium was dipped into the suspension for 10 minutes, withdrawn, dried, and stored under ambient conditions. Such prepared filters were tested in the same photocatalytic configuration as the spark-ablated samples.
Results and discussion
Characterization of spark-ablated nanoparticles
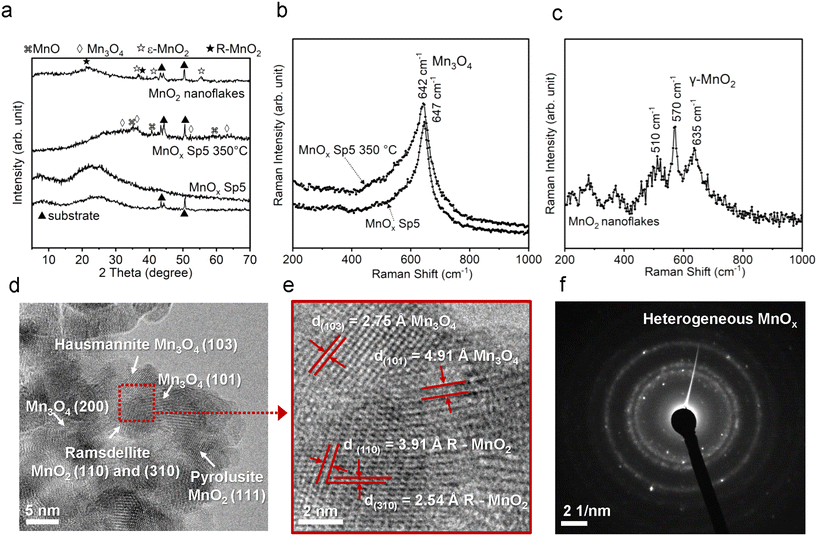
In order to elucidate the local crystal structure and its changes after the calcination of the spark-ablated MnOx sample, Raman spectroscopy was conducted. The Raman analysis was executed employing a 532 nm laser with an output power of 1500 mW. Recognizing the potential susceptibility of manganese oxides to laser-induced degradation during Raman analysis,42 we systematically explored four discrete power conditions, specifically 0.1%, 1%, 5%, and 10% of the full laser power (as illustrated in Fig. S3†). The test aimed to ascertain the most optimal parameters for mitigating sample degradation. The results indicated that a laser power setting of 1%, corresponding to 15 mW, in combination with a 100× magnification and an accumulation time of 60 seconds, effectively minimized sample degradation. Consequently, these parameters were selected for subsequent evaluation. Notably, the Raman spectra of the spark-ablated MnOx samples, both in their as-prepared and calcined states, exhibited similarities. These Raman spectra displayed relatively weak bands at approximately 260 cm−1, 330 cm−1, 410 cm−1, 464 cm−1, and 564 cm−1, as well as a pronounced band at 640 cm−1. The bands situated at approximately 560 cm−1 and 640 cm−1 are characteristic of the stretching vibration of Mn–O–Mn and Mn–O, respectively, where the strong vibration at 640 cm−1 could be associated with the Mn–O stretching vibration of Mn2+ in tetrahedral coordination within the hausmannite Mn3O4 phase.42,43 In contrast, the sol–gel prepared MnO2 sample unveiled a distinct Raman spectrum, featuring bands at 220 cm−1, 279 cm−1, 370 cm−1, 510 cm−1, 570 cm−1, 635 cm−1, 680 cm−1, and 740 cm−1. The pronounced vibration at the band above 500 cm−1 is attributed to the internal MnO6 octahedral Mn–O stretch and O–Mn–O bend modes, where the complex Raman spectrum showing multiple peaks reflects a lower symmetry of the Mn–O octahedral environment of the ramsdellite matrix with pyrolusite intergrowths.44 In addition, a comparative evaluation of Mn–O vibrational frequencies at around 640 cm−1 of the as-prepared and calcined samples revealed pronounced broadening and redshifting from 647 cm−1 to 642 cm−1 subsequent to the calcination (Fig. S4†). This phenomenon suggested lattice expansion stemming from an augmented presence of oxygen vacancies caused by the calcination process.43 Remarkably, this broadening was even more pronounced compared to the sol–gel prepared MnO2 sample, indicating a more substantial lattice distortion attributable to a higher concentration of oxygen vacancies.
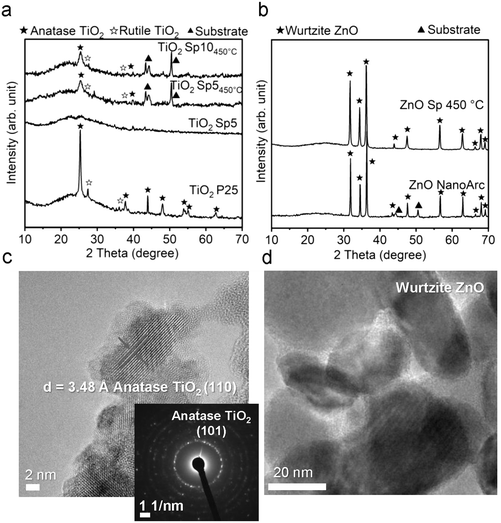
To further investigate the microstructure of spark-ablated nanoparticles, the deposited nanoparticles were collected from the collection filters and examined with high-resolution transmission electron microscopy (HRTEM) and selected area electron diffraction (SAED) analysis (Fig. 2d–f). HRTEM image analysis of interplanar distances confirmed the heterogeneous nature of MnOx SP, where the lattice structure was determined using the standard relation connecting the interplanar distance (d) of samples with standard values of interplanar distances and Miller indices (hkl). The results revealed the presence of three MnOx polymorphs: hausmannite Mn3O4, ramsdellite and pyrolusite MnO2 (Fig. 2d and e). The intergrowth domains of ramsdellite and pyrolusite varieties are generally assigned to γ-MnO2.45 The corresponding SAED data showed bright diffraction rings, which demonstrated the formation of polycrystalline MnOx consisting of the three polymorphs (Table S1†). This shows that spark-ablation synthesis in argon followed by calcination in air at 350 °C for 14 h led to the formation of mixed-valence Mn3O4 and γ-MnO2. For TiO2 SP, the HRTEM and SAED analyses were used to confirm the anatase crystalline structure, as shown in Fig. 3c and Tables S2.†
The findings from XRD, Raman spectroscopy, HRTEM and SAED demonstrated that the spark ablation method produced hausmannite Mn3O4 as the predominant crystalline structure, which is a stable manganese phase at high temperature.46 The formation of the hausmannite phase is favored due to the rapid heating during the spark ablation of the electrode material where the temperature of local “hot spots” can reach 10![[thin space (1/6-em)]](https://www.rsc.org/images/entities/char_2009.gif) 000 K.26 Similarly, the formation of MnO and Mn3O4 has been reported to be thermodynamically favored in oxygen-lean high-temperature processes such as the flame and laser ablation syntheses.47,48 This would suggest that the Mn electrode is vaporized to form mainly the Mn3O4 phase in the stream of the oxygen-lean carrier gas. The subsequent calcination of the Sp sample led to the increased crystallinity as shown by the increase of Raman intensity (Fig. 2b). In the course of spark ablation of TiO2, the XRD analysis revealed that the spark ablation method produced mainly the amorphous Ti phase, which was transformed to anatase during the calcination. The presence of anatase was further confirmed by HRTEM and SAED analysis. This preference for anatase formation can be ascribed to the specific particle size conditions and the calcination temperature below 600 °C, where anatase represents the thermodynamically stable crystalline phase.49
000 K.26 Similarly, the formation of MnO and Mn3O4 has been reported to be thermodynamically favored in oxygen-lean high-temperature processes such as the flame and laser ablation syntheses.47,48 This would suggest that the Mn electrode is vaporized to form mainly the Mn3O4 phase in the stream of the oxygen-lean carrier gas. The subsequent calcination of the Sp sample led to the increased crystallinity as shown by the increase of Raman intensity (Fig. 2b). In the course of spark ablation of TiO2, the XRD analysis revealed that the spark ablation method produced mainly the amorphous Ti phase, which was transformed to anatase during the calcination. The presence of anatase was further confirmed by HRTEM and SAED analysis. This preference for anatase formation can be ascribed to the specific particle size conditions and the calcination temperature below 600 °C, where anatase represents the thermodynamically stable crystalline phase.49
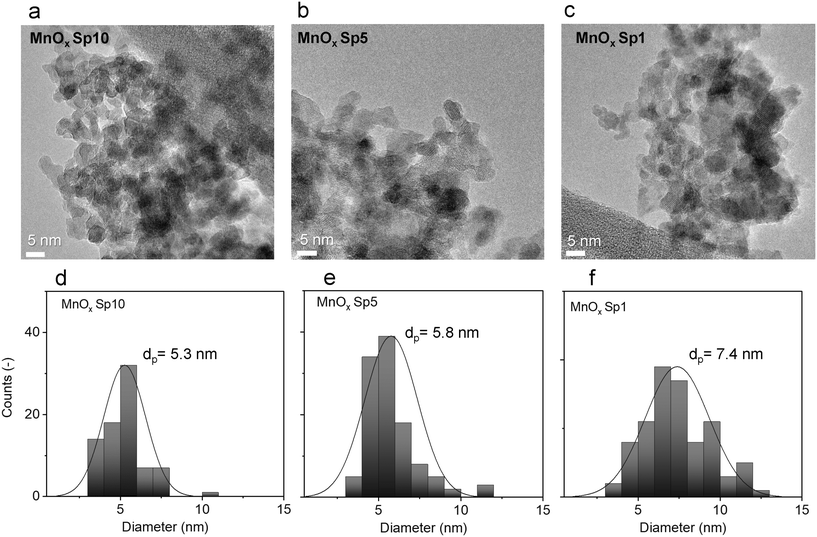
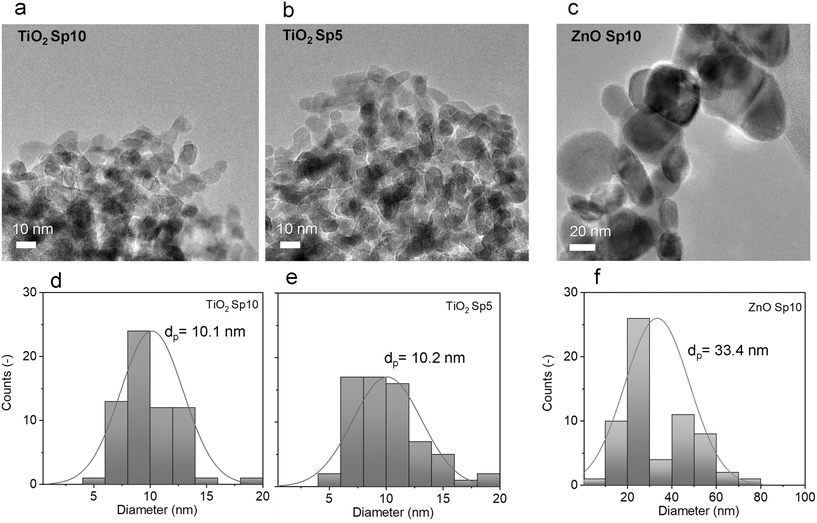
Furthermore, TEM images were used for nanoparticle size analysis. The TEM images of the Sp samples showed sphere-like primary particles with relatively narrow normal, approximately Gaussian, size distributions. The particle size increased with decreasing flow rate of the carrier gas. The count median diameters (CMD) of MnOx Sp nanoparticles were 5.3 nm, 5.8 nm, and 7.4 nm for 10 L min−1, 5 L min−1, and 1 L min−1 flow rates, respectively (Fig. 4). For TiO2, the sizes were 10.1 nm and 10.2 nm for 10 L min−1 and 5 L min−1 flow rates, respectively (Fig. 5). The size of ZnO Sp nanoparticles was determined as 33.4 nm with a wide size distribution for the flow rate of 10 L min−1.
The effect of different flow rates on the particle size is attributed to the increased cooling rate and transport velocity of primary particles with a higher flow rate. This reduces sintering and coalescence between primary particles and results in a smaller particle size and narrower size distributions.50 In particular, metal particles show complete coalescence (i.e. they retain a sphere-like shape) during the first stage of growth.20 At a given temperature, there is a maximum size for complete coalescence to take place. The so-called primary particle size (the size of the smallest “round” structures observed in an agglomerated structure) depends on the coalescence behavior of the material (bulk and surface diffusion of the atoms) under their temperature history. For the present case, where the metal is (partially) oxidized during particle growth by O2 impurity in the carrier gas and the composition changes continuously, the process is complex and rather unpredictable. The primary particles form agglomerates in the gas phase and continued to agglomerate on the substrate. As oxidation is likely not complete when agglomeration begins, we have to assume that it continues while the primary particles are in contact in the aerosol phase and after deposition on the filter fibre. This chemical conversion leads to the displacement of atoms in the nanostructured solid, which, together with the thermodynamic driving force towards surface minimization, may lead to further sintering and coalescence. This phenomenon, which can be referred to as “oxidation-induced coalescence”, has been observed during the oxidation of iron nanoparticles.51 To our knowledge, this phenomenon has barely been studied systematically.
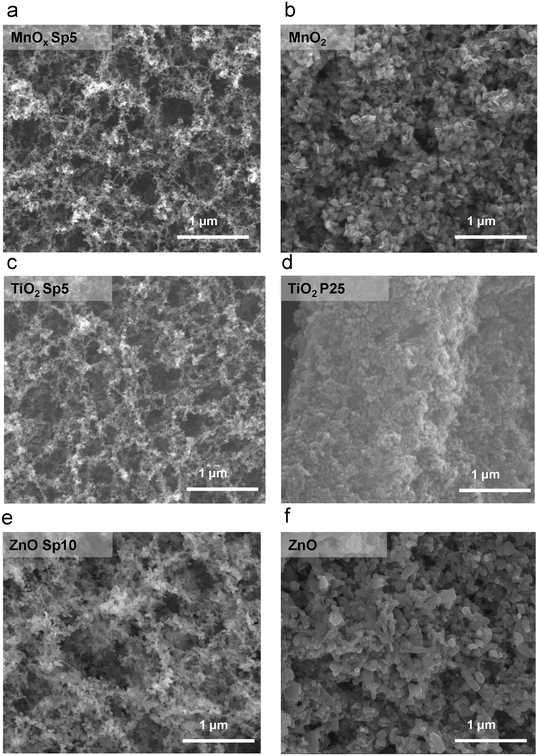
The size range of collected nanoparticles indicated that diffusion was the dominant mechanism of deposition, especially for MnOx and TiO2 Sp with sub-20 nm sizes. Structures with high surface-to-volume ratio and high porosity are formed during the particle transport dominated by Brownian motion,15 which is observed by scanning electron microscopy (SEM) imaging in our study (Fig. 6). The SEM images provided an overview of the nanoparticles deposited on the glass fibre substrate. Agglomeration in the aerosol phase forms fractal-like agglomerates, which combine to form porous and web-like layers on the filter fibres (Fig. 6). The Sp nanoparticles were smaller and the deposition structure was more porous compared to the sol–gel MnO2 and commercially available TiO2 and ZnO nanoparticles, which were immobilized by a dip-coating method, where the particles were larger and densely packed on the fibres.
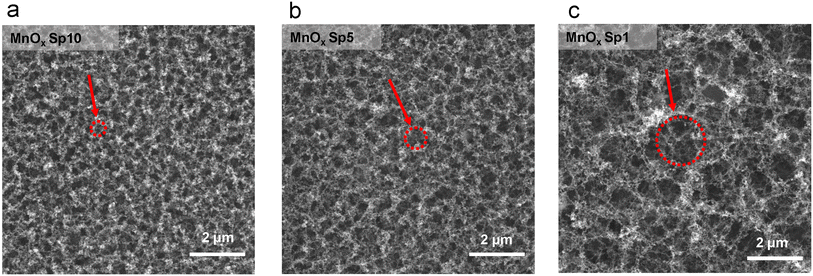
The deposited structures were affected by the different flow rates during Sp nanoparticle generation and deposition. The structures were examined by SEM imaging (Fig. 7), which revealed that the smaller the flow rate, the larger the holes between agglomerated structures (Fig. 7). This can be explained by the fact that under slow flow, there is more time for agglomerate growth in the gas phase, and the resulting larger agglomerates leave more void space between each other after deposition.50,52
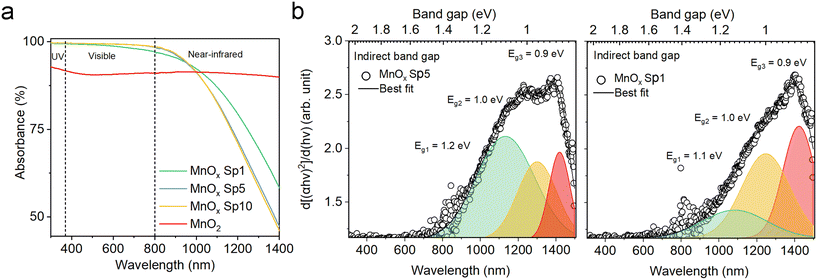
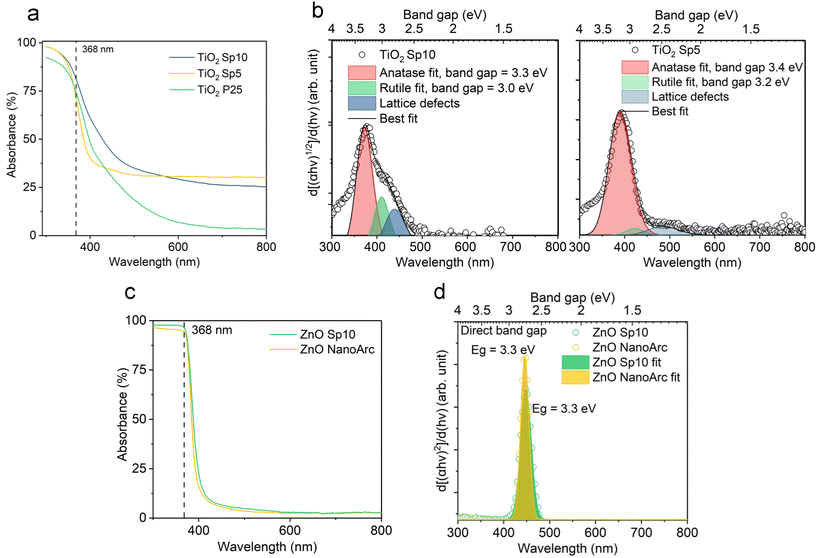
Dark-brownish MnOx Sp samples (Fig. S5a†) demonstrated superior absorption in the UV-vis spectrum, while the absorption decreased in the NIR spectrum (Fig. 8a). The absorption spectra were similar for MnOx Sp10 and Sp5 samples, while Sp1, i.e. the larger particles, showed higher absorption in the NIR spectrum. Using a Tauc plot of the absorption spectra, a band gap of 1.2 eV was estimated for Sp10 and Sp5 samples while a slightly lower band gap of 1.0 eV was observed for the Sp1 sample (Fig. S6a†). Band gap values between 1 eV and 2 eV have been reported previously for MnO2.53,54 In addition, the 1st derivative of the Tauc plot (Fig. 8b) showed that the optical transition from the valence-band electronic structure contained three levels of transitional energy, which accounted for the hausmannite, ramsdellite, and pyrolusite phases of the MnOx Sp sample.32 The present analysis also revealed that the composition changed for the lowest flow rate, i.e. the largest particle size. This could be attributed to the different kinetics of oxidation and coalescence under the low-flow-rate spark ablation process. The sol–gel MnO2 sample showed a constant absorption with no transitional energy observed in the UV-vis spectrum (Fig. 8a and S6b†).
The colors of the just-produced TiO2 Sp and ZnO Sp samples were grey and brown, respectively. During the calcination, the color changed from grey to light grey and from brown to white (Fig. S5b–d†). The color of pure TiO2 and ZnO materials is usually white with absorption in the UV spectrum and their color change is determined by various factors, such as the size of particles, the level of crystallinity, and the existence of defects and impurities. In addition, a microscopic inspection of the spark-ablated nanoparticles before and after calcination was performed using SEM (Fig. S7 and S8†). Our observations revealed no discernible alterations in the size or structure of the deposited nanoparticles. Consequently, we assumed that the observed color change was associated with variations in the oxidation state and the quantity of surface defects. The distinct color of just-produced Sp samples accounted for a low level of crystallization and oxidation, which was further improved after the calcination that induced color blending.55 The calcined TiO2 Sp samples showed a red shift and increased absorption in the UV-vis spectrum (Fig. 9a). The shift and increased absorption are enabled by the delocalization of molecular orbitals at the conduction band edge, which generates shallow and/or deep traps within the band gap.30 In the present study, the band gap characteristics were studied using a commonly used Tauc plot analysis and a more sensitive 1st derivative approach. Using the Tauc plot analysis, the band gaps of the Sp and commercial materials were estimated to be 3.2 eV for TiO2 Sp10 and TiO2 Sp5 compared to 3.1 eV for TiO2 P25 (Fig. S6c†), which corresponded well to the reported values.56 While Sp5 showed a relatively sharp absorption edge, the Sp10 sample showed a gradual decrease of absorption at energies below the determined band gap so-called Urbach tail (Fig. S6c†).5 This additional broad absorption band is a phenomenon caused by the presence of defects, such as Ti3+ interstitials and oxygen vacancies.57 For the Sp10 sample, the presence of defects was further observed in the 1st derivative representation as an additional transition peak at an energy around 2.7 eV (Fig. 9b). The differences in the defect amount and the degree of oxidation were also apparent from the different hues of grey before and after calcination of the Sp10 and Sp5 samples (Fig. S5b and c†). This can be explained by the higher flow rate of the carrier gas during the spark ablation of this sample. In general, the higher flow rate increases dilution and reduces the likelihood of oxidation or other chemical reactions, which can influence the level of oxidation and the amount of bulk and surface defects such as Ti interstitials and oxygen vacancies in the TiO2 structure.26,55 The additional peak at around 2.7 eV, as well as the aforementioned Urbach tail, was also observed to some extent in the commercial TiO2 sample (Fig. S6c and d†). As the color of the commercial TiO2 was white, this observation can be attributed mainly to the presence of impurities and adsorbed hydroxyl groups. Further inspection using the 1st derivative of the Tauc plot revealed two levels of transition energy at 3.3 eV and 3.1 eV representing typical values for the anatase and rutile phases of TiO2.56 The fitting analysis revealed the different anatase/rutile compositions of the TiO2 material (Fig. 9b). While TiO2 Sp10 contained about 15% of rutile, the Sp5 sample consisted of mainly anatase crystalline phases. This observation is in accordance with the XRD pattern intensity comparison (Table S3†). Even though the anatase phase is usually metastable, it becomes more stable than the rutile phase at the nanoscale due to its smaller surface energy.58 The transformation of anatase to rutile is enabled during the calcination above 600 °C, which exceeds the 450 °C used in our study by far.
The samples of ZnO SP, on the other hand, showed optical properties very similar to those of the commercial ZnO. Just a slight increase in the UV absorption along with a red shift was observed from the absorption spectra (Fig. 9c) and the optical band gap was reduced slightly for the ZnO Sp sample (Fig. 9d and S6e†). Both samples showed one transition energy accounting for the wurtzite phase. Similar to TiO2, the red shift and a slight reduction of the optical band gap of ZnO materials are attributed to subband transitions closely associated with the concentration of oxygen vacancies at the surface.59
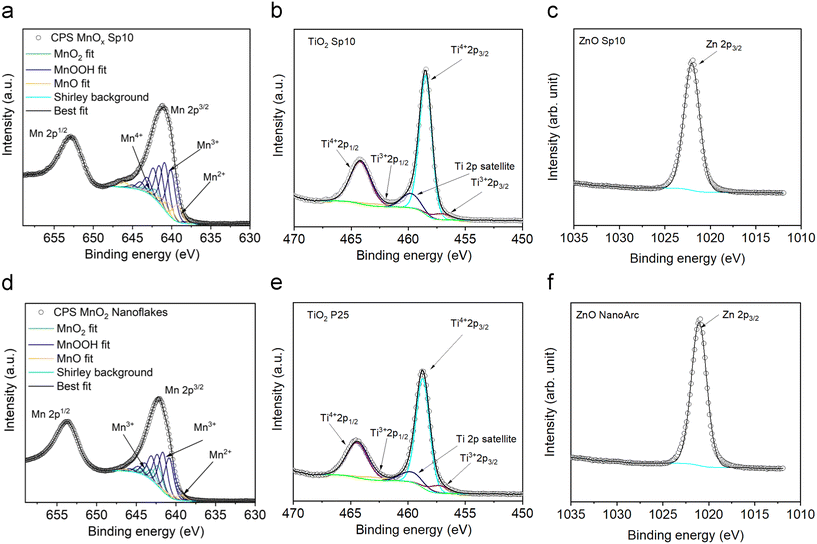
In the same manner, the TiO2 Sp sample was fitted with Ti3+ and Ti4+ standards.34 The obtained value of the AOS was 3.8, similar to the commercial TiO2 sample. These results show the tendency of the Ti material to be stable in the highest oxidation state, though a small amount of reduced Ti3+ was present on the surface. Spark-ablated and commercial ZnO samples showed similar oxidation states. The binding energies of Sp ZnO and TiO2 were slightly shifted in comparison to the commercial samples, which indicated differences in the surface properties. The Ti 2p3/2 binding energy of the TiO2 Sp sample was shifted to lower energy from 458.7 eV to 458.5 for Sp5 and 458.3 for Sp10 eV, which might be assigned to Ti3+ in the TiO2 lattice.63 The Zn 2p3/2 core level of the ZnO Sp sample showed a shift to higher binding energy from 1021.8 eV to 1022.1 eV. This observation is closely related to the concentration of lattice defects and oxygen vacancies.64
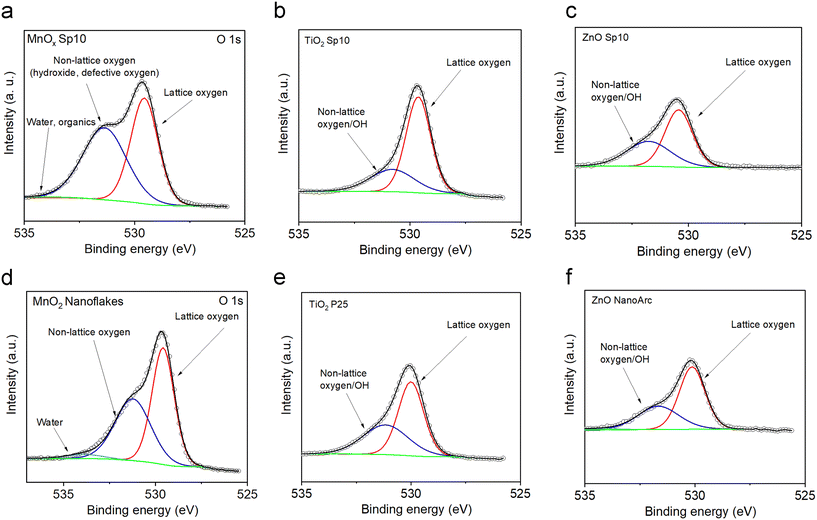
Using fits of the O 1s core level, the ratios between lattice and non-lattice oxygen were determined to investigate the surface defects and oxygen vacancies (Fig. 11).60,64 The data revealed that MnOx Sp nanoparticles contained up to 52% of non-lattice oxygen/surface defects and the highest fraction of non-lattice oxygen (i.e. hydroxyl group, oxygen vacancies, and/or surface defects) was found in the spark-ablated nanoparticles with the smallest size (Fig. 11a and Table S4†). The larger amount of surface defects is ascribed to (i) the small size, (ii) the presence of impurities in the carrier gas, and (iii) the low calcination temperature.65 This observation confirmed the results from Raman spectroscopy (Fig. S4†) where a broadening of the Mn–O vibrational mode at around 640 cm−1 indicated a high level of lattice distortion. TiO2 Sp contained less non-lattice oxygen along with higher AOS values accounting for a less defective surface (24% and 30% of non-lattice oxygen for Sp10 and Sp5 samples, Fig. 11b and Table S5†). This observation is different from the UV-vis spectrometry observation, where the Sp10 sample showed the highest amount of defects through the Urbach tail in the Tauc plot representation (Fig. S6b†). As XPS is a surface-sensitive technique while UV-vis spectrometry can probe bulk properties of materials, this indicates that the TiO2 Sp samples contained mainly bulk defects, which persisted even after the calcination.66 The ZnO Sp sample contained 41% of non-lattice oxygen (Fig. 11c, Table S5†) and the non-lattice oxygen fractions of the sol–gel MnO2 sample, commercial TiO2 P25, and ZnO NanoArc samples were determined as 44%, 41%, and 37%, respectively (Fig. 11d–f and Tables S4 and S5†). It should be noted that the non-Sp samples exhibited different origins of non-lattice oxygen mainly assigned to the surface impurities and adsorbed hydroxyl groups as the preparation of the samples involved an aqueous solution with chemical precursors.
VOC degradation performance
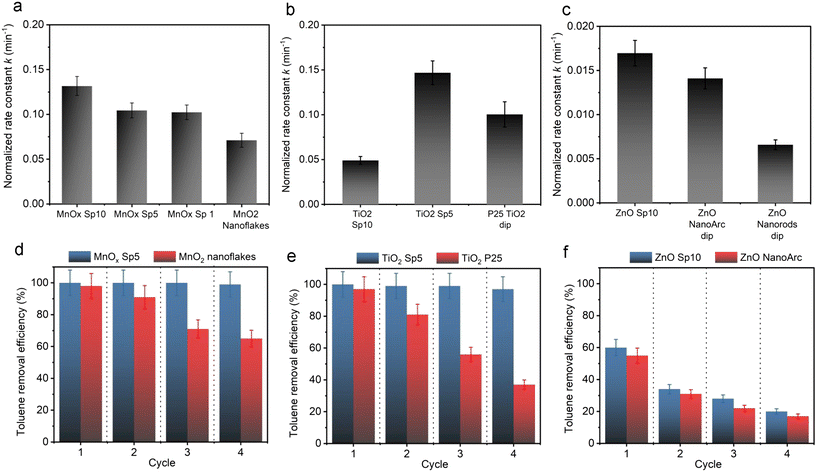
In our study, the smallest nanoparticles were produced by the spark ablation of Mn electrodes. MnOx Sp nanoparticles showed superior photocatalytic performance compared to the sol–gel prepared samples, specifically, all Sp samples led to the complete removal of toluene (around 25 ppm) in less than 50 min using a halogen lamp with 222 mW cm−2 (Fig. 12a and S11†). The mass-normalized 1st order degradation constants were determined as 0.132 min−1, 0.104 min−1, 0.103 min−1, and 0.071 min−1 for Sp10, Sp5, Sp1 MnOx, and sol–gel MnO2 sample, respectively (Table S6†). We ascribed these improvements of the spark-produced samples with respect to the benchmarks to the crystalline structure and the surface properties, e.g., the content of Mn2+/Mn3+/Mn4+ and the oxygen vacancies, which were different for the Sp and sol–gel samples. Specifically, as revealed by XRD and Raman spectroscopy, the spark ablation of Mn electrodes followed by calcination resulted in the formation of Mn3O4 as the predominant manganese crystalline phase. The presence of additional phases was observed using HRTEM, UV-VIS spectrometry, and XPS analysis. The XPS analysis showed the presence of a greater content of Mn3+ with a minor content of Mn2+ and Mn4+ on the surface of the Sp samples indicating the coexistence of Mn3O4 with a small portion of MnO2. In addition, both Raman spectroscopy and XPS revealed a high level of lattice distortion, i.e., oxygen vacancies, which contributed to the reactivity of Sp samples. Based on the literature review, it has been shown that manganese oxides with mixed valence and the presence of active oxygen promote the photodegradation of organic molecules.67 In particular, it has been reported that the oxidation activity of mixed-valence Mn3O4 is based on a thermo-assisted photocatalytic process.11 In this process, during solar irradiation, the d–d orbital electrons of the Mn atom within the [MnO6] octahedron absorb photon energy, leading to a transition from the ground state to an excited state, generating electron–hole pairs. This weakens the Mn–O bond and enhances the activation of lattice oxygen activity. As the light exposure continues, the thermal energy generated through the photothermal effect augments photocatalytic performance by increasing charge transfer. Furthermore, this thermal energy contributes to enhancing lattice oxygen activity, generating additional surface-active oxygen, while the remaining oxygen vacancies are replenished by the surrounding O2 molecules.11,68 The coexistence of various manganese oxides, such as Mn2O3, Mn3O4, and MnO2, has been reported to be beneficial for improved visible-light-driven organic degradation due to their stronger visible light absorption, more active sites, and enhanced charge separation performance.10,69 In such heterojunction nanostructures, the efficient spatial separation and prolonged lifetime of photo-induced carriers (e.g., electrons and holes) can be achieved because the conduction (CB) and valence bands (VB) of Mn2O3 and Mn3O4 are more negative than the CB and VB of MnO2. The reported valence band energies are 0.34, 1.85, and 2.19 eV, respectively, with corresponding conduction band energies of −1.09, −0.35, and 0.43 eV. This thermodynamically allows the migration of excited electrons from the CB of Mn2O3 to the CB of Mn3O4 and to the CB of MnO2, effectively extending the lifespan of photo-induced carriers. Superoxide radicals are generated through reactions between oxygen and electrons on the conduction bands of Mn2O3 and Mn3O4, which can further react with hydrogen ions to form hydroxyl radicals. Conversely, the photogenerated holes remain in the corresponding VB, with MnO2 having the highest conduction band energy of 2.19 eV, where adsorbed hydroxyl ions can be oxidized into hydroxide radicals.69 A similar study70 focused on the degradation of toluene using an α-MnO2/Mn3O4 hybrid system, showing that this nanostructure promoted the generation of superoxide radicals through interfacial charge transfer and provided more oxygen vacancies for dissociative adsorption of oxygen.70 These findings are in line with our observations, where the conduction energies of MnOx samples were estimated to be 1.6 eV and 2.0 eV for Mn3O4 and MnO2,10 respectively, with corresponding conduction bands of 0.4 and 0.8 eV (Fig. S10†). In addition, it was reported that the small-size particles experience low resistance of interfacial charge transfer, which enhances the photocatalytic activity of heterojunction structures.10 The presented results for spark-ablated samples showed that a significant improvement of the degradation rate was observed for the smallest size, i.e. MnOx Sp10. In addition, this sample provided the largest amount of surface defects as indicated by XPS analysis of the O 1s core level (Table S4†) and Raman spectroscopy (Fig. S4†), which could act as additional active sites, and the highest absorption in the visible light spectrum (Fig. 8). The increased absorption in the visible spectrum and the determined band gap indicated that the degradation on spark-ablated manganese oxide samples was driven by the thermal-assisted photocatalytic process rather than light-drive thermocatalysis. The present study primarily focused on the spark ablation production of various materials to assess the suitability of this procedure for photocatalyst synthesis. It should be noted that the comprehensive characterization and evaluation of the oxidation mechanism using heterogeneous spark-ablated manganese oxide were not within the scope of this investigation. Further exploration of this aspect will be necessary in future studies.
Employing TiO2 samples under UV irradiation with an intensity of 0.6 mW cm−2, a significant improvement in the toluene degradation rate was observed for TiO2 Sp5 (Fig. 12b and S11†). This sample showed almost three times and 1.5 times faster toluene removal in comparison to TiO2 Sp10 and commercial TiO2, with a mass normalized rate constant of 0.147 min−1, 0.049 min−1, and 0.100 min−1, respectively (Table S6†). The particle sizes in the Sp10 and Sp5 samples were similar, but Sp5 represented a broader particle size distribution (Fig. 5). In addition, the crystalline structures were different for Sp10 and Sp5. Our analysis above (Fig. 9 and Table S3†) shows that the Sp5 sample was composed of the anatase phase, while the Sp10 sample consisted of about 15% rutile phase. In addition, the XPS analysis showed a slightly higher amount of Ti3+ and defects/oxygen vacancies on the surface of the Sp5 sample. It has been reported that the presence of Ti3+ on the surface of the anatase phase might enhance the activity as it provides additional active sites.71 In addition, anatase is known to experience a slower rate of electron–hole recombination, and thus better access to the catalytically active sites.72 Another indication of different characteristics of structural disorders between Sp10 and Sp5 is a slight difference in the grades of the samples' grey color73 observed after the spark-ablation and calcination. By expanding the range of available light wavelengths as well as by altering the crystalline phase, colored TiO2 can improve the efficiency and versatility of photocatalytic reactions compared to white TiO2 as shown in the present and previous studies.73–75
Both ZnO samples were composed of a typical wurtzite structure, but the Sp sample provided slightly better overall photocatalytic performance compared to the commercial ZnO (Fig. 12c) thanks to a higher amount of surface defects (41% of non-lattice oxygen compared to 37% on the commercial sample) and smaller particle size.
In general, the size of nanoparticles is considered a key factor for improving (photo)catalysis. When the particle size drops below 10 nm, the number of atoms that reach the surface increases rapidly, resulting in a high surface-to-volume ratio, i.e. high amount of available reactive sites, increasing the activity towards pollutant adsorption and photocatalytic oxidation.76 In addition, the decrease in particle size should increase photonic efficiencies because of the improved interfacial charge-carrier transfer rates. However, reducing the particle size below a specific threshold causes surface recombination processes to become dominant. This is due to the majority of electrons and holes being generated close to the surface, and surface recombination occurs faster than interfacial charge-carrier transfer processes. Therefore, an optimum particle size results in a maximal photocatalytic efficiency.77
From the presented findings, it is evident that the spark ablation method can compete with the conventional catalyst synthesis methods in the production of catalytic materials with enhanced reactivity; what's more, it additionally offers simplicity and versatility in nanomaterial production without the usage of expensive precursors and reactants preventing impurities and waste generation. However, the energy demanding calcination step remains necessary for the production of efficient photocatalysts. In future studies, this additional step may be eliminated as the oxidation state could be simply tuned through the introduction of oxygen into the carrier gas during the spark ablation and deposition process. Follow-up studies could focus on the effect of different carrier gases on the properties and photocatalytic performance of spark ablated nanoparticles, similar to a recently reported study producing Co–Ni bimetallic nanoparticles.83 Furthermore, ensuring the mechanical stability of spark-ablated nanostructures on substrates poses a notable challenge for the practical implementation of the presented method, which requires further optimization.
Conclusions
To the best of our knowledge, spark ablation has not been previously reported or evaluated for the production of photocatalytic nanoparticles. Nevertheless, it holds significant potential for advancing the current state by enabling environmentally friendly nanoparticle synthesis with distinct properties that could prove beneficial for photocatalytic reactions. In order to test this hypothesis and provide a comprehensive solution, our focus encompassed the complete trajectory: from the methodology behind nanoparticle synthesis, their strategic deposition, to an analysis of their inherent attributes and subsequent performances. In particular, spark ablation with direct immobilization of the produced nanoparticles onto a glass fibre substrate is introduced as a method for the production of functionalized filters for airborne organic pollutant removal. The filters loaded with MnOx, TiO2, and ZnO nanoparticles were calcined to improve the oxidation state and crystallization. Their photocatalytic activity and stability were evaluated under visible and UV irradiation. It is important to point out that the spark ablation procedure played a pivotal role in the enhanced performance when compared to the benchmark photocatalyst. Given the original nature of our study in terms of applying this technique to photocatalysis, an initial establishment was imperative using benchmark materials such as TiO2. The spark-ablated and calcined MnOx and TiO2 samples demonstrated almost two times better photocatalytic activity towards toluene degradation along with sustained performance durability as compared to sol–gel MnO2 and commercial TiO2. The enhanced photocatalytic performance and outstanding durability are attributed mainly to (i) the small particle size (sub-20 nm particle size) and open nanostructure of particle deposition, i.e. high surface-to-volume ratio and pollutant and light accessibility, (ii) the presence of surface defects/oxygen vacancies, and (iii) the elimination of surface contamination during the production of nanoparticles. This facilitates a comprehensive comparison, affording a clearer picture of the merits and limitations of the spark ablation process in the context of photocatalytic applications. We show that the spark-ablation method is viable for air cleaning control applications. This method provides a simple, versatile and flexible, precursor-free and waste-free alternative to the traditional methods, representing an environment-friendly and green chemistry route for catalyst production. As a proof of concept, this study focused on the production of conventional photocatalytic materials, but spark ablation can provide viable production routes for a wide range of catalytic materials and their mixtures, especially if we consider the unlimited possibilities of doping and mixing for optimizing the process. Therefore, the technique introduced here has the potential of producing and optimizing new photocatalytic materials with unique properties.Data availability statement
All data are included in the manuscript or ESI;† further inquiries are available from the corresponding authors.Author contributions
S. Dr., S. Di, A. S.-O., and J. W. conceived and designed the experiments. S. Di. and A. S.-O. provided the spark generator and electrodes. Z. Z. did preliminary Sp tests and prepared ZnO Sp samples. S. Dr. prepared the photocatalytic filters functionalized with MnOx and TiO2 using the spark generator and sol–gel methods. S. Dr. prepared and characterized the samples with XRD and SEM. S. Dr. performed the photocatalytic degradation and stability tests. M. G. performed Raman spectroscopy analysis. R. P. performed HRTEM and SAED imaging. O. S. analyzed the samples with XPS and helped with data treatment and interpretation. S. Dr. performed data treatment and representation, prepared graphs and figures, and wrote the manuscript with the support of J. W. and A. S.-O.Conflicts of interest
The authors declare that the research was conducted in the absence of any commercial or financial relationships that could be construed as a potential conflict of interest.Acknowledgements
The use of the gas chromatograph setup was supported by SNF project # 121306 “Fundamental Aspects of Photocatalysis and Photoelectrochemistry/Basic Research Instrumentation for Functional Characterization”. The use of photocatalytic equipment and GC/FID was supported by the SNF R'Equip 206021-121306, SNF Marie-Heim-Voegtlin 139698 (Rita Toth) and SCIEX CRUS 10.013 (Krisztina Schrantz). The XPS analysis was supported by R'Equip Grant No. 182987 and SNF 172662. This work was partially supported by the Center for Filtration Research at the University of Minnesota with the Subaward No. W530672710. We would like to thank Robin Carron and Marek Chrapa for their assistance and help with the UV-vis spectroscopy analysis and Artur Braun for the access to the photocatalytic equipment and GC/FID.References
- R. M. Alberici and W. F. Jardim, Photocatalytic destruction of VOCs in the gas-phase using titanium dioxide, Appl. Catal., B, 1997, 14, 55–68 CrossRef CAS.
- S. Wang, H. M. Ang and M. O. Tade, Volatile organic compounds in indoor environment and photocatalytic oxidation: State of the art, Environ. Int., 2007, 33, 694–705 CrossRef CAS.
- C. Yang, G. Miao, Y. Pi, Q. Xia, J. Wu, Z. Li and J. Xiao, Abatement of various types of VOCs by adsorption/catalytic oxidation: A review, Chem. Eng. J., 2019, 370, 1128–1153 CrossRef CAS.
- M. J. Finnegan, C. A. Pickering and P. S. Burge, The sick building syndrome: prevalence studies, Br. Med. J., 1984, 289, 1573 CrossRef CAS.
- H. Yaghoubi, Z. Li, Y. Chen, H. T. Ngo, V. R. Bhethanabotla, B. Joseph, S. Ma, R. Schlaf and A. Takshi, Toward a Visible Light-Driven Photocatalyst: The Effect of Midgap-States-Induced Energy Gap of Undoped TiO2 Nanoparticles, ACS Catal., 2015, 5, 327–335 CrossRef CAS.
- Y. Yang, Y. Li, M. Mao, M. Zeng and X. Zhao, UV–Visible–Infrared Light Driven Thermocatalysis for Environmental Purification on Ramsdellite MnO2 Hollow Spheres Considerably Promoted by a Novel Photoactivation, ACS Appl. Mater. Interfaces, 2017, 9, 2350–2357 CrossRef CAS.
- P. Wu, S. Dai, G. Chen, S. Zhao, Z. Xu, M. Fu, P. Chen, Q. Chen, X. Jin and Y. Qiu, Interfacial effects in hierarchically porous α-MnO2/Mn3O4 heterostructures promote photocatalytic oxidation activity, Appl. Catal., B, 2020, 268, 118418 CrossRef CAS.
- S. Ristig, N. Cibura and S. Strunk, Manganese Oxides in Heterogeneous (Photo)Catalysis: Possibilities and Challenges, Green, 2015, 5(1–6), 23–41 CrossRef CAS.
- S. Drdova, S. Zhao, M. Giannakou, D. Sivaraman, N. Guerrero-Alburquerque, A. Bonnin, R. Pauer, Z. Pan, E. Billeter, G. Siqueira, Z. Zeng, M. M. Koebel, W. J. Malfait and J. Wang, Biomimetic Light-Driven Aerogel Passive Pump for Volatile Organic Pollutant Removal, Adv. Sci., 2022, 9, 2105819 CrossRef PubMed.
- J. Zhao, J. Nan, Z. Zhao, N. Li, J. Liu and F. Cui, Energy-efficient fabrication of a novel multivalence Mn3O4-MnO2 heterojunction for dye degradation under visible light irradiation, Appl. Catal., B, 2017, 202, 509–517 CrossRef CAS.
- T. He, S. Rong, D. Ding, Y. Zhou, N. Zhang and W. He, Facet-Controlled Synthesis of Mn3O4 Nanorods for Photothermal Synergistic Catalytic Oxidation of Carcinogenic Airborne Formaldehyde, ACS Catal., 2023, 13, 8049–8062 CrossRef CAS.
- G. Li, C. Mang, J. Luo, M. Rao, Z. Peng and T. Jiang, Mn-vacancy birnessite for photo-assisted elimination of formaldehyde at ambient condition, J. Colloid Interface Sci., 2022, 618, 229–240 CrossRef CAS PubMed.
- Z. Wang, H. Yu, Y. Xiao, L. Zhang, L. Guo, L. Zhang and X. Dong, Free-standing composite films of multiple 2D nanosheets: Synergetic photothermocatalysis/photocatalysis for efficient removal of formaldehyde under ambient condition, Chem. Eng. J., 2020, 394, 125014 CrossRef CAS.
- J. C. Colmenares and Y.-J. Xu, Heterogeneous photocatalysis, Green Chemistry and Sustainable Technology, 2016, DOI:10.1007/978-3-662-48719-8.
- A. Schmidt-Ott, Spark Ablation: Building Blocks for Nanotechnology, Pan Stanford Publishing, 2020 Search PubMed.
- P. Nyamukamba, O. Okoh, H. Mungondori, R. Taziwa and S. Zinya, Synthetic methods for titanium dioxide nanoparticles: a review, Titanium dioxide-material for a sustainable environment, 2018, vol. 10 Search PubMed.
- B. Schimmoeller, S. E. Pratsinis and A. Baiker, Flame Aerosol Synthesis of Metal Oxide Catalysts with Unprecedented Structural and Catalytic Properties, ChemCatChem, 2011, 3, 1234–1256 CrossRef CAS.
- L. Song, Y. Wang, J. Ma, Q. Zhang and Z. Shen, Core/shell structured Zn/ZnO nanoparticles synthesized by gaseous laser ablation with enhanced photocatalysis efficiency, Appl. Surf. Sci., 2018, 442, 101–105 CrossRef CAS.
- E. Hontañón, J. M. Palomares, M. Stein, X. Guo, R. Engeln, H. Nirschl and F. E. Kruis, The transition from spark to arc discharge and its implications with respect to nanoparticle production, J. Nanopart. Res., 2013, 15, 1–19 CrossRef.
- J. Feng, G. Biskos and A. Schmidt-Ott, Toward industrial scale synthesis of ultrapure singlet nanoparticles with controllable sizes in a continuous gas-phase process, Sci. Rep., 2015, 5, 15788 CrossRef CAS.
- V. Andrey and E. I. Tatiana, in Nanoparticles Technology, ed. A. Mahmood, IntechOpen, Rijeka, 2015, ch. 1, DOI:10.5772/61303.
- N. S. Tabrizi, Q. Xu, N. M. van der Pers, U. Lafont and A. Schmidt-Ott, Synthesis of mixed metallic nanoparticles by spark discharge, J. Nanopart. Res., 2009, 11, 1209–1218 CrossRef CAS.
- N. S. Tabrizi, Q. Xu, N. M. van der Pers and A. Schmidt-Ott, Generation of mixed metallic nanoparticles from immiscible metals by spark discharge, J. Nanopart. Res., 2010, 12, 247–259 CrossRef CAS.
- J. Feng, R. Geutjens, N. V. Thang, J. Li, X. Guo, A. Kéri, S. Basak, G. Galbács, G. Biskos, H. Nirschl, H. W. Zandbergen, E. Brück and A. Schmidt-Ott, Magnetic Phase Transition in Spark-Produced Ternary LaFeSi Nanoalloys, ACS Appl. Mater. Interfaces, 2018, 10, 6073–6078 CrossRef CAS.
- N. S. Tabrizi, M. Ullmann, V. A. Vons, U. Lafont and A. Schmidt-Ott, Generation of nanoparticles by spark discharge, J. Nanopart. Res., 2008, 11, 315 CrossRef.
- T. V. Pfeiffer, J. Feng and A. Schmidt-Ott, New developments in spark production of nanoparticles, Adv. Powder Technol., 2014, 25, 56–70 CrossRef CAS.
- A. P. Weber, M. Seipenbusch, C. Thanner and G. Kasper, Aerosol catalysis on nickel nanoparticles, J. Nanopart. Res., 1999, 1, 253–265 CrossRef CAS.
- A. Y. Shan, T. I. M. Ghazi and S. A. Rashid, Immobilisation of titanium dioxide onto supporting materials in heterogeneous photocatalysis: A review, Appl. Catal., A, 2010, 389, 1–8 CrossRef CAS.
- J. Feng, E. Hontanon, M. Blanes, J. Meyer, X. Guo, L. Santos, L. Paltrinieri, N. Ramlawi, L. C. Smet, H. Nirschl, F. E. Kruis, A. Schmidt-Ott and G. Biskos, Scalable and Environmentally Benign Process for Smart Textile Nanofinishing, ACS Appl. Mater. Interfaces, 2016, 8, 14756–14765 CrossRef PubMed.
- H. Lin, C. P. Huang, W. Li, C. Ni, S. I. Shah and Y.-H. Tseng, Size dependency of nanocrystalline TiO2 on its optical property and photocatalytic reactivity exemplified by 2-chlorophenol, Appl. Catal., B, 2006, 68, 1–11 CrossRef CAS.
- K. A. Michalow, D. Flak, A. Heel, M. Parlinska-Wojtan, M. Rekas and T. Graule, Effect of Nb doping on structural, optical and photocatalytic properties of flame-made TiO2 nanopowder, Environ. Sci. Pollut. Res., 2012, 19, 3696–3708 CrossRef CAS PubMed.
- D. Flak, A. Braun, B. S. Mun, J. B. Park, M. Parlinska-Wojtan, T. Graule and M. Rekas, Spectroscopic assessment of the role of hydrogen in surface defects, in the electronic structure and transport properties of TiO2, ZnO and SnO2 nanoparticles, Phys. Chem. Chem. Phys., 2013, 15, 1417–1430 RSC.
- E. S. Ilton, J. E. Post, P. J. Heaney, F. T. Ling and S. N. Kerisit, XPS determination of Mn oxidation states in Mn (hydr)oxides, Appl. Surf. Sci., 2016, 366, 475–485 CrossRef CAS.
- M. Oku, H. Matsuta, K. Wagatsuma, Y. Waseda and S. Kohiki, Removal of inelastic scattering part from Ti2p XPS spectrum of TiO2 by deconvolution method using O1s as response function, J. Electron Spectrosc. Relat. Phenom., 1999, 105, 211–218 CrossRef CAS.
- M. F. J. Boeije, G. Biskos, B. E. van der Maesen, T. V. Pfeiffer, A. W. van Vugt, B. Zijlstra and A. Schmidt-Ott, in Spark Ablation: Building Blocks for Nanotechnology, ed. A. Schmidt-Ott, Pan Stanford Publishing, 2020 Search PubMed.
- S. Zhao, G. Siqueira, S. Drdova, D. Norris, C. Ubert, A. Bonnin, S. Galmarini, M. Ganobjak, Z. Pan, S. Brunner, G. Nyström, J. Wang, M. M. Koebel and W. J. Malfait, Additive manufacturing of silica aerogels, Nature, 2020, 584, 387–392 CrossRef CAS.
- H. Liu, Z. Lian, X. Ye and W. Shangguan, Kinetic analysis of photocatalytic oxidation of gas-phase formaldehyde over titanium dioxide, Chemosphere, 2005, 60, 630–635 CrossRef CAS.
- M. A. Fox and M. T. Dulay, Heterogeneous photocatalysis, Chem. Rev., 1993, 93, 341–357 CrossRef CAS.
- Z. Zhong, Z. Xu, T. Sheng, J. Yao, W. Xing and Y. Wang, Unusual Air Filters with Ultrahigh Efficiency and Antibacterial Functionality Enabled by ZnO Nanorods, ACS Appl. Mater. Interfaces, 2015, 7, 21538–21544 CrossRef CAS PubMed.
- C. F. Holder and R. E. Schaak, Tutorial on powder X-ray diffraction for characterizing nanoscale materials, ACS Nano, 2019, 13, 7359–7365 CrossRef CAS.
- E. Y. Shaba, J. O. Jacob, J. O. Tijani and M. A. T. Suleiman, A critical review of synthesis parameters affecting the properties of zinc oxide nanoparticle and its application in wastewater treatment, Appl. Water Sci., 2021, 11, 48 CrossRef CAS.
- S. Bernardini, F. Bellatreccia, A. Casanova Municchia, G. Della Ventura and A. Sodo, Raman spectra of natural manganese oxides, J. Raman Spectrosc., 2019, 50, 873–888 CrossRef CAS.
- H. Yang, H. Chen, W. Lin, Z. Zhang, M. Weng, W. Zhou, H. Fan and J. Fu, Facile Preparation of Oxygen-Vacancy-Mediated Mn3O4 for Catalytic Transfer Hydrogenation of Furfural, Ind. Eng. Chem. Res., 2021, 60, 9706–9715 CrossRef CAS.
- C. Julien and M. Massot, Spectroscopic studies of the local structure in positive electrodes for lithium batteries, Phys. Chem. Chem. Phys., 2002, 4, 4226–4235 RSC.
- C. Godart, M. Latroche, C. Freticny and C. Levy-Clement, EXAFS Studies of Synthetic γ-MnO2 and Related Pyrolusite and Ramsdellite Minerals, Phys. Status Solidi A, 1992, 132, 253–268 CrossRef CAS.
- J. Darul, C. Lathe and P. Piszora, Mn3O4 under High Pressure and Temperature: Thermal Stability, Polymorphism, and Elastic Properties, J. Phys. Chem. C, 2013, 117, 23487–23494 CrossRef CAS.
- N. Enríquez-Sánchez, A. R. Vilchis-Nestor, S. Camacho-López, M. A. Camacho-López and M. Camacho-López, Influence of ablation time on the formation of manganese oxides synthesized by laser ablation of solids in liquids, Opt. Laser Technol., 2020, 131, 106418 CrossRef.
- S. Dasappa and J. Camacho, Formation of nanocrystalline manganese oxide in flames: oxide phase governed by classical nucleation and size-dependent equilibria, CrystEngComm, 2020, 22, 5509–5521 RSC.
- A. S. Barnard and H. Xu, An Environmentally Sensitive Phase Map of Titania Nanocrystals, ACS Nano, 2008, 2, 2237–2242 CrossRef CAS.
- S. Ahmad, P. Laiho, Q. Zhang, H. Jiang, A. Hussain, Y. Liao, E.-X. Ding, N. Wei and E. I. Kauppinen, Gas phase synthesis of metallic and bimetallic catalyst nanoparticles by rod-to-tube type spark discharge generator, J. Aerosol Sci., 2018, 123, 208–218 CrossRef CAS.
- A. Cabot, V. F. Puntes, E. Shevchenko, Y. Yin, L. Balcells, M. A. Marcus, S. M. Hughes and A. P. Alivisatos, Vacancy Coalescence during Oxidation of Iron Nanoparticles, J. Am. Chem. Soc., 2007, 129, 10358–10360 CrossRef CAS PubMed.
- A. Schmidt-Ott, In situ measurement of the fractal dimensionality of ultrafine aerosol particles, Appl. Phys. Lett., 1988, 52, 954–956 CrossRef CAS.
- S. Das, A. Samanta and S. Jana, Light-Assisted Synthesis of Hierarchical Flower-Like MnO2 Nanocomposites with Solar Light Induced Enhanced Photocatalytic Activity, ACS Sustainable Chem. Eng., 2017, 5, 9086–9094 CrossRef CAS.
- S.-L. Chiam, S.-Y. Pung and F.-Y. Yeoh, Recent developments in MnO2-based photocatalysts for organic dye removal: a review, Environ. Sci. Pollut. Res., 2020, 27, 5759–5778 CrossRef CAS.
- V. A. Vons, L. C. P. M. de Smet, D. Munao, A. Evirgen, E. M. Kelder and A. Schmidt-Ott, Silicon nanoparticles produced by spark discharge, J. Nanopart. Res., 2011, 13, 4867 CrossRef CAS.
- J. Zhao and X. Yang, Photocatalytic oxidation for indoor air purification: a literature review, Build. Environ., 2003, 38, 645–654 CrossRef.
- P. Makuła, M. Pacia and W. Macyk, How To Correctly Determine the Band Gap Energy of Modified Semiconductor Photocatalysts Based on UV–Vis Spectra, J. Phys. Chem. Lett., 2018, 9, 6814–6817 CrossRef PubMed.
- R. H. R. Castro and B. Wang, The Hidden Effect of Interface Energies in the Polymorphic Stability of Nanocrystalline Titanium Dioxide, J. Am. Ceram. Soc., 2011, 94, 918–924 CrossRef CAS.
- J. Fang, H. Fan, Y. Ma, Z. Wang and Q. Chang, Surface defects control for ZnO nanorods synthesized by quenching and their anti-recombination in photocatalysis, Appl. Surf. Sci., 2015, 332, 47–54 CrossRef CAS.
- B. Bharti, S. Kumar, H.-N. Lee and R. Kumar, Formation of oxygen vacancies and Ti3+ state in TiO2 thin film and enhanced optical properties by air plasma treatment, Sci. Rep., 2016, 6, 32355 CrossRef CAS.
- S. Ardizzone, C. L. Bianchi and D. Tirelli, Mn3O4 and γ-MnOOH powders, preparation, phase composition and XPS characterisation, Colloids Surf., A, 1998, 134, 305–312 CrossRef CAS.
- J. Huang, S. Zhong, Y. Dai, C.-C. Liu and H. Zhang, Effect of MnO2 Phase Structure on the Oxidative Reactivity toward Bisphenol A Degradation, Environ. Sci. Technol., 2018, 52, 11309–11318 CrossRef CAS PubMed.
- D.-N. Pei, L. Gong, A.-Y. Zhang, X. Zhang, J.-J. Chen, Y. Mu and H.-Q. Yu, Defective titanium dioxide single crystals exposed by high-energy {001} facets for efficient oxygen reduction, Nat. Commun., 2015, 6, 8696 CrossRef CAS.
- F.-M. Chang, S. Brahma, J.-H. Huang, Z.-Z. Wu and K.-Y. Lo, Strong correlation between optical properties and mechanism in deficiency of normalized self-assembly ZnO nanorods, Sci. Rep., 2019, 9, 905 CrossRef PubMed.
- M. Augustin, D. Fenske, I. Bardenhagen, A. Westphal, M. Knipper, T. Plaggenborg, J. Kolny-Olesiak and J. Parisi, Manganese oxide phases and morphologies: A study on calcination temperature and atmospheric dependence, Beilstein J. Nanotechnol., 2015, 6, 47–59 CrossRef CAS.
- M. Lau, S. Reichenberger, I. Haxhiaj, S. Barcikowski and A. M. Müller, Mechanism of Laser-Induced Bulk and Surface Defect Generation in ZnO and TiO2 Nanoparticles: Effect on Photoelectrochemical Performance, ACS Appl. Energy Mater., 2018, 1, 5366–5385 CAS.
- Y. Li, S. Han, L. Zhang and Y. Yu, Manganese-Based Catalysts for Indoor Volatile Organic Compounds Degradation with Low Energy Consumption and High Efficiency, Trans. Tianjin Univ., 2022, 28, 53–66 CrossRef CAS.
- S. Fang and Y. H. Hu, Thermo-photo catalysis: a whole greater than the sum of its parts, Chem. Soc. Rev., 2022, 51, 3609–3647 RSC.
- J. Zhao, Z. Zhao, N. Li, J. Nan, R. Yu and J. Du, Visible-light-driven photocatalytic degradation of ciprofloxacin by a ternary Mn2O3/Mn3O4/MnO2 valence state heterojunction, Chem. Eng. J., 2018, 353, 805–813 CrossRef CAS.
- P. Wu, S. Dai, G. Chen, S. Zhao, Z. Xu, M. Fu, P. Chen, Q. Chen, X. Jin, Y. Qiu, S. Yang and D. Ye, Interfacial effects in hierarchically porous α-MnO2/Mn3O4 heterostructures promote photocatalytic oxidation activity, Appl. Catal., B, 2020, 268, 118418 CrossRef CAS.
- Y. Wang, H. Sun, S. Tan, H. Feng, Z. Cheng, J. Zhao, A. Zhao, B. Wang, Y. Luo, J. Yang and J. G. Hou, Role of point defects on the reactivity of reconstructed Anatase titanium dioxide (001) surface, Nat. Commun., 2013, 4, 2214 CrossRef.
- M. Sachs, E. Pastor, A. Kafizas and J. R. Durrant, Evaluation of Surface State Mediated Charge Recombination in Anatase and Rutile TiO2, J. Phys. Chem. Lett., 2016, 7, 3742–3746 CrossRef CAS.
- Y. Liu, P. Chen, Y. Fan, Y. Fan, X. Shi, G. Cui and B. Tang, Grey Rutile TiO(2) with Long-Term Photocatalytic Activity Synthesized Via Two-Step Calcination, Nanomaterials, 2020, 10, 920 CrossRef CAS.
- A. Naldoni, M. Allieta, S. Santangelo, M. Marelli, F. Fabbri, S. Cappelli, C. L. Bianchi, R. Psaro and V. Dal Santo, Effect of Nature and Location of Defects on Bandgap Narrowing in Black TiO2 Nanoparticles, J. Am. Chem. Soc., 2012, 134, 7600–7603 CrossRef CAS PubMed.
- M. S. Hamdy, R. Amrollahi and G. Mul, Surface Ti3+-Containing (blue) Titania: A Unique Photocatalyst with High Activity and Selectivity in Visible Light-Stimulated Selective Oxidation, ACS Catal., 2012, 2, 2641–2647 CrossRef CAS.
- D. Beydoun, R. Amal, G. Low and S. McEvoy, Role of Nanoparticles in Photocatalysis, J. Nanopart. Res., 1999, 1, 439–458 CrossRef CAS.
- Z. Zhang, C.-C. Wang, R. Zakaria and J. Y. Ying, Role of Particle Size in Nanocrystalline TiO2-Based Photocatalysts, J. Phys. Chem. B, 1998, 102, 10871–10878 CrossRef CAS.
- K. Sorathiya, B. Mishra, A. Kalarikkal, K. P. Reddy, C. S. Gopinath and D. Khushalani, Enhancement in Rate of Photocatalysis Upon Catalyst Recycling, Sci. Rep., 2016, 6, 35075 CrossRef CAS.
- J. B. Cha, G. T. Woo, W. S. Han, S. Saqlain, O. H. Seo, K. H. Cho, Y. J. Kim and D. Y. Kim, Surface Modification of TiO2 for Obtaining High Resistance against Poisoning during Photocatalytic Decomposition of Toluene, Catalysts, 2018, 8, 500 CrossRef.
- C. Yu, K. Yang, Y. Xie, Q. Fan, C. Y. Jimmy, Q. Shu and C. Wang, Novel hollow Pt-ZnO nanocomposite microspheres with hierarchical structure and enhanced photocatalytic activity and stability, Nanoscale, 2013, 5, 2142–2151 RSC.
- S. Weon, J. Kim and W. Choi, Dual-components modified TiO2 with Pt and fluoride as deactivation-resistant photocatalyst for the degradation of volatile organic compound, Appl. Catal., B, 2018, 220, 1–8 CrossRef CAS.
- R. Chen, J. Li, H. Wang, P. Chen, X. a. Dong, Y. Sun, Y. Zhou and F. Dong, Photocatalytic reaction mechanisms at a gas–solid interface for typical air pollutant decomposition, J. Mater. Chem. A, 2021, 9, 20184–20210 RSC.
- P. Ternero, M. Sedrpooshan, D. Wahlqvist, B. O. Meuller, M. Ek, J.-M. Hübner, R. Westerström and M. E. Messing, Effect of the carrier gas on the structure and composition of Co–Ni bimetallic nanoparticles generated by spark ablation, J. Aerosol Sci., 2023, 170, 106146 CrossRef CAS.
Footnote |
| † Electronic supplementary information (ESI) available. See DOI: https://doi.org/10.1039/d3en00348e |
| This journal is © The Royal Society of Chemistry 2024 |

