 Open Access Article
UV-LED irradiation for biofouling reduction in drip irrigation emitters fed with wastewater effluent†
Yael
Gilboa
 *a,
Barak
White‡
a,
Inbar
Shlomo
a,
Karl G.
Linden
 b and
Eran
Friedler
 a
a
aFaculty of Civil and Environmental Eng, Technion - Israel Institute of Technology, Haifa 32000, Israel. E-mail: ygilboa@technion.ac.il
bCivil, Environmental, and Architectural Eng, University of Colorado Boulder, Boulder, CO 80303, USA
First published on 5th August 2024
Abstract
Crop irrigation with treated wastewater effluent using drip irrigation has become common as the demand for water supply has increased. Because of the quality characteristics of treated wastewater and the narrow and winding geometry of the drip emitter's structure, it is susceptible to clogging. Emitter clogging reduces flow and increases flow variability between emitters that can lead to water stress on crops, thereby reducing crop yield. Several methods to minimize emitter clogging have been suggested and applied; however many drawbacks are associated with them. The use of UV-LEDs (UV light-emitting diodes) is a non-chemical disinfection method that holds great promise for disinfection and biofouling prevention in irrigation systems. In this research, biofouling formation potential was investigated for 12 weeks, in a large pilot-scale irrigation rig consisting of three parallel pipelines, comparing three disinfection treatments: UV-LED, chlorine, and no treatment. The results indicate that the discharges of UV-LED and chlorine-treated lines were similar. However, analyzing the internal fouling material of the opened drippers revealed the significant advantage of the UV-LED treatment, when both OCT (optical coherence tomography) image processing and EPS (extracellular polymeric substance) secretion within the clogging substances indicated significant biofilm inhibition by UV-LED irradiation as compared to the other alternatives. The present study is a proof-of-concept of a new approach of using UV-LED irradiation for minimizing biofouling formation in emitters fed with treated wastewater. UV-LED technology has great potential to become an attractive and feasible alternative for replacing chlorine as a water disinfection technology, specifically for agriculture use.
Water impactThe use of UV-LEDs, a non-chemical disinfection method, has great potential for disinfection and for limiting biofouling formation in irrigation systems, and may replace chlorine for agriculture use. This research provides evidence on the efficiency of biofilm inhibition by UV-LED irradiation compared to chlorine or no treatment disinfection, at a pilot-scale drip irrigation rig fed with treated wastewater. |
1. Introduction
Agriculture irrigation using treated wastewater effluent (TWW) has become common in the last decades as the demand for water supply has increased, especially in arid and semi-arid areas.1,2 Drip irrigation combined with using TWW has many positive aspects, from advancing water sustainability to energy saving and improving agricultural yields.3 However, due to the emitters' narrow and winding internal structure they may clog, particularly when TWW is used, due to increased chemical and biological fouling. Emitter fouling may reduce flow and the uniformity of water application, reducing the overall irrigation water volume and increasing the variation between the drippers, respectively.4–9Several methods to minimize and/or eliminate emitter clogging have been suggested and used, including pre-filtration, which reduces the amount of suspended organic and inorganic matter entering the drip irrigation system. However, filtration cannot remove all the suspended matter and eventually sediments and microbiological growth accumulate in the emitters.10,11 Another possible method is pressure flushing, in which the pipelines are rinsed by increasing the hydraulic shear force within the pipe system. A flushing velocity of 0.6 m s−1 was reported to be adequate; however it must be performed often to dislodge and transport accumulated sediment.6,12 Acidification was reported as a method to prevent chemical precipitation, yet it may adversely affect soil pH.13,14 The most common method for reducing emitter bio-clogging by bacteria and algae is chlorination.4,6,13,15 That said, there are no unequivocal and unified guidelines for the required chlorine concentrations, exposure duration and timing, for controlling drip-irrigation bio-clogging.4,16 In addition, irrigation with chlorine-containing effluent has its drawbacks: chlorine may damage the dripper structure, leading to a significant decrease in dripper performance;5 the effluent may damage the plants' roots;15 when the effluent contains high ammonia concentrations, chlorination will result in the formation of chloramines which last longer in the distribution system but have lower-efficiency as biocides; organic matter in the effluent increases chlorine demand necessitating the addition of a higher chlorine dose to achieve the same efficiency, and may yield trihalomethanes (THMs) and other disinfection-by-products (DBPs), exhibiting negative health effects.17 Finally, chlorination entails relatively high capital and operational costs due to the need to transport, store and dose chlorine in the field. Therefore, a cheaper, simpler, and more environmentally-, health- and crop-friendly method for emitter biofouling reduction is warranted.
Ultraviolet (UV) irradiation has been used as a common and effective technology for water disinfection and reduction of biofouling in water systems and membranes.18,19 UV disinfection has several advantages over conventional chemical disinfection, such as no chemical addition, storage, and dosing. It does not remain in the water and no harmful DBPs are formed and it has little effect on the environment. However, conventional UV disinfection utilizes mercury lamps, which have disadvantages such as large size and high energy demand. In addition, the lamps are fragile and contain toxic mercury, which is hazardous to the environment and requires proper disposal.20 Recently, UV light-emitting diodes (UV-LEDs) have emerged as a new source for UV irradiation to replace mercury vapor lamps, and have been investigated and used as a tertiary wastewater treatment.20–24 UV-LED technology has several advantages over conventional mercury UV lamps, such as diversity of radiating wavelengths (from deep UV to near UV regions; 210–360 nm), small point light source, mercury-free, durability, compactness, extremely short warm-up time (intermittent-flow friendly), allowing versatile integration, lower energy consumption, and longer lifetime.20,25,26 Since disinfection depends on the spectral sensitivity of the target microorganism rather than the UV source, the efficacy of LEDs for disinfection of protozoa, viruses, and bacteria was proven to be at least as effective as low-pressure UV lamps for a given wavelength and dose combination.27–34 Bacteria (including biofilm-formers) and protozoa such as Cryptosporidium and Giardia that pose a health risk are easily inactivated at low UV doses, while virus inactivation requires higher doses.27 The UV-LED wavelength output is tunable based on material composition,25 making it an ideal technology for optimization of treatment objectives, as the response of each microorganism to different wavelengths is unique.32,33 Few studies have already evaluated the efficacy of UV-LEDs for treated wastewater; however, these are limited;22,23,32,35 in particular, most of them have focused on small-scale systems and there is a lack of case studies involving flow-through UV-LED reactors in large pilot-scale systems of treated wastewater for agricultural use as drip irrigation emitters. In addition, to the best of our knowledge, no attempt has been made to evaluate biofouling clogging inside drippers fed with UV-LED-disinfected effluent at a full-scale pilot drip irrigation rig in long-term studies (few months).
Several methods for analyzing biofouling clogging in drip irrigation have been reported, some of them require extraction and destruction of the clogging sample. Others are non-destructive, proposing to study the samples without extracting them.8 Monitoring emitter discharge is a direct method, which is non-destructive and is suitable for both laboratory-scale and field studies. Dripper flow rate and flow uniformity among drippers are affected by biofilm formation and therefore allow the evaluation of clogging rate and severity.8 Extraction methods, indicative of biofilm formation and quantification, include analysis of biofilms and bacterial activity using extracellular polymeric substances (EPSs). EPS quantification has been widely and efficiently used for studying clogging in drip irrigation.8,36 Quantifying biofilm formation can also be studied by optical coherence tomography (OCT), which provides a three-dimensional view of the sample, and allows the identification of regions most susceptible to biofilm clogging.7,9,37
The main objective of the work was to study the effect of UV-LED irradiation on biofouling formation and to quantify fouling formation mechanisms in emitters fed with TWW. In this study we analyzed the fundamental principles of UV-LED disinfection and evaluated its inactivation efficacy for biofilm-forming bacteria using a collimated-beam apparatus and a flow-through reactor at the laboratory, and at a full-scale pilot drip irrigation rig fed with TWW. To understand biofouling formation in drippers at a full-scale pilot drip irrigation rig we used non-destructive direct methods based on accurate-automatic discharge monitoring and extraction and destruction methods based on OCT and EPS characterization.
2. Materials and methods
2.1 Target organisms and microbiological procedures
Pure culture of green fluorescent protein (GFP) vegetative Bacillus subtilis (NCIB 3610) was used as the representative microorganism and a biodosimeter for the disinfection studies, and as the target microorganism for inactivation tests at the laboratory. B. subtilis is a non-pathogenic Gram-positive bacterium that is highly tractable. Consequently, B. subtilis frequently serves as a model organism for the study of Gram-positive bacteria in several applications, amongst them studying biofilm formation.38The spiking solution was prepared by placing a single colony of roughly 1–2 mm in diameter in a sterile Erlenmeyer flask containing 20 mL nutrient broth. The Erlenmeyer flask was shaken for 18 h at 100 rpm and 30 °C. The final spiking stock solution contained ∼1010 CFU per 100 mL. B. subtilis concentration was determined using the filter membrane method; samples were seeded on nutrient agar (HiMedia, India) Petri dishes and incubated for 24 h at 30 °C and colonies were counted.
2.2 Experimental setups
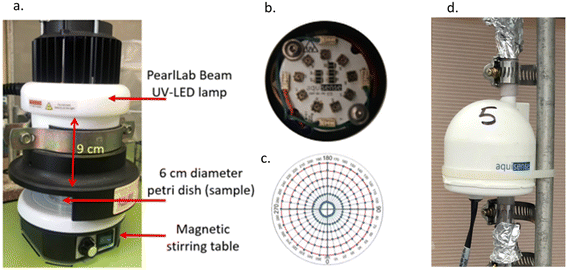 | ||
| Fig. 1 UV-LEDs: a) collimated beam setup; b) top view of the lamps; c) radial template for measuring irradiation intensity distribution; d) flow-through reactor. | ||
UV irradiance was measured using a spectrometer (USB2000 + UV-VIS-ES, Ocean Optics, USA) at different distances. The spectrometer probe was fastened below the lamp to ensure precise measurement at the center of the UV-LED lamp, while the collimated beam was adjusted to measure at a 6 cm diameter radial template, at 10° and 5 mm intervals Fig. 1c. Absolute irradiance was measured and used for calculating the Petri factor.40
Average UV fluence obtained on the surface of the irradiated solution sample was measured with iodide–iodate chemical actinometry, based on Rahn et al. (2003).41 The actinometry solution was photolyzed into triiodide, the concentration of which was directly related to the radiation dose the solution had experienced. Aliquots of 10 mL of iodide solution were placed in a 6 cm Petri dish, 9 cm from the UV-LED source and then irradiated between 10 s and 3 min with continuous stirring. The UV-LED irradiation fluence was calculated using 0.37, iodide–iodate quantum yield at 285 nm,42 and the intensity was calculated according to Rahn et al. (2003).41
The examined flow-through UV-LED reactor is patent protected, and its internal geometry and structure were unknown to us. Therefore, indirect approaches for characterizing the UV-LED flow-through reactor were required, using three methods: tracer experiments, chemical actinometry and biodosimetry (bacteria inactivation experiments).
Tracer experiments were conducted using the flow-through UV-LED reactor to understand and quantify flow regime elements based on Friedler and Gilboa (2010).43 Briefly, the NaCl solution served as a tracer, and its flow rate, varying between 0.1 and 0.6 L min−1, was controlled by a step feed peristaltic pump. The solution electrical conductivity was recorded at 1 s intervals at the outlet of the reactor (Metrohm 912 Conductometer, Switzerland). The flow regime was analyzed using time distribution curves, and the reactor hydraulic efficiency was estimated by flow characterization parameters (obtained from the distribution curves): average residence time (tave), the time of peak tracer concentration appearance (modal; tp), and the time when 10% of the final concentration reached the outlet (t10). The ratios between these parameters and the theoretical residence time (T – reactor volume divided by the flow rate) were calculated (for more details, see Friedler and Gilboa, 2010 (ref. 43)). The flow regime in the UV-LED reactor was further assessed using the Rebhun–Argaman model (1965) which calculates the proportions of the plug flow, dead spaces, and degree of mixing.44
In the actinometry experiments, prior to feeding the actinometric solution, the UV-LED reactor was rinsed with distilled water and the examined flow rates were adjusted. The feed was then instantly switched to the iodide–iodate solution. For calculating the irradiance intensity of the UV-LED reactor, the iodide–iodate solution was fed at flow rates identical to the ones used in the tracer experiments (0.1–0.6 L min−1). As aforementioned, the inner structure of the PearlAqua reactor is patent protected and unknown to us, and specifically the area exposed to the radiation (cm2) is not explicitly defined. Therefore, to quantify UV irradiation intensity, an assumption had to be made, and the area exposed to the radiation was calculated by multiplying the irradiation chamber volume by the absorption ratio of the iodide–iodate solution at 285 nm (1 cm−1).
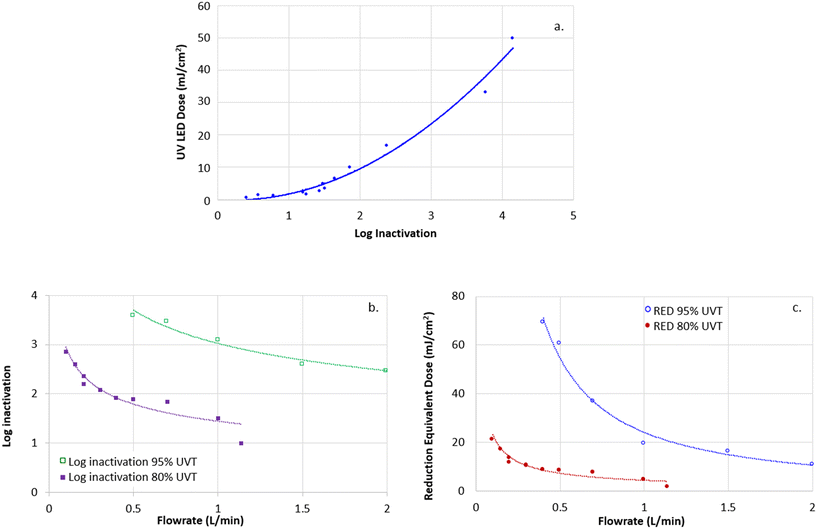
Biodosimetry was used for evaluating the UV-LED efficacy applied to the water using the flow-through UV-LED reactor.45 In biodosimetry, the unknown UV dose of the flow-through reactor is compared to a well-known UV dose of the collimated beam (as fundamentally characterized in section 2.2.1). The dose–response curve (i.e., log inactivation of the examined bacterium vs. UV dose), obtained using the collimated beam, serves as a standard curve for back-calculation of the UV dose of the UV-LED at the flow-through reactor at each flow rate. The latter is defined as the RED (reduction equivalent dose) of the flow-through reactor. The RED was later adjusted for uncertainties and biases to produce the validated dose of the reactor for the operating conditions examined.
Two types of solutions were examined by biodosimetry: phosphate buffered saline (PBS) and synthetic treated wastewater (STWW; for the procedure, see ESI† data, S1) with a transmittance of 95 and 80%, respectively. 20 L of each water matrix was prepared daily and spiked with the target bacteria (B. subtilis) to achieve an initial concentration of ∼106 CFU per 100 mL (measured at the beginning of the experiment). The water matrices were then exposed to UV irradiation in the UV-LED flow-through reactor or the collimated beam, and the RED of the flow-through reactor was calculated from the dose–response of the collimated beam. At the collimated beam, a water matrix (PBS or STWW) of 10 mL was placed in a 6 cm Petri dish, 9 cm from the UV-LED source and then irradiated between 10 s and 30 min with continuous stirring. For the UV-LED flow-through reactor experiments, 20 L of the examined water matrices were pumped through the reactor at flow rates of 0.1–2.0 L min−1. The B. subtilis concentration (inflow and outflow) was measured on nutrient agar using the filter membrane method (method 9215 (ref. 46)).
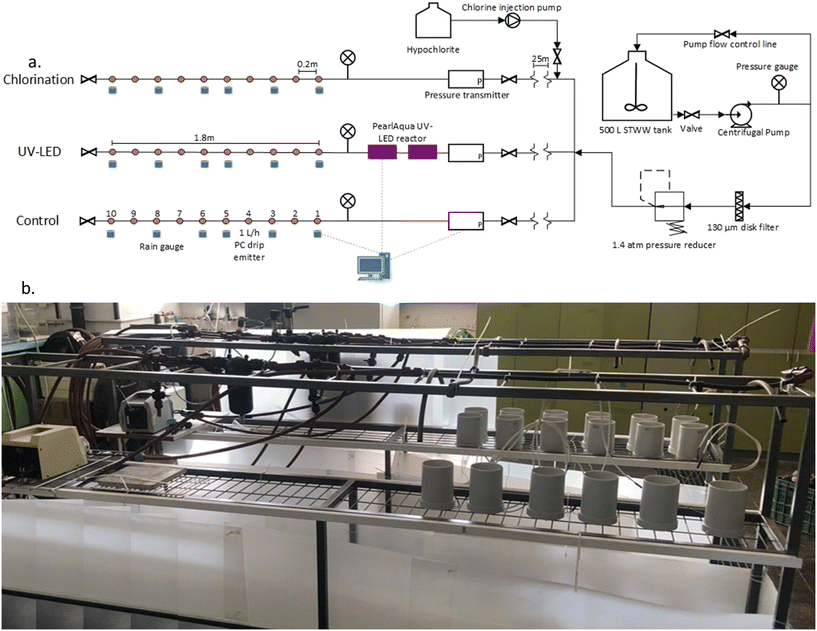 | ||
| Fig. 2 a. Schematic of the laboratory pilot-scale drip irrigation rig; b. the laboratory pilot-scale drip irrigation rig. | ||
STWW was prepared daily in a 500 L tank, stirred, and spiked with B. subtilis at a concentration of ∼106 CFU per 100 mL. Mixed STWW was then pumped (PV55 50 Hz, Pedrollo, Italy) through a 130 μm disk filter (Arkal 1′′, Amiad, Israel), and the pressure was reduced to 1.4 atm (¾′′ PRV 1.4 atm, Bermad, Israel) and diverted to the three treatment lines. Each line consisted of a 25 m long 16 mm (external) diameter tube (to ensure the 30 min residence time needed for the chlorination treatment, see below) followed by a drip line with 10 integral pressure compensating 1 L h−1 drippers (UniRam™ AS, Netafim, Israel), spaced 0.2 m apart. The UniRam drippers contain an internal diaphragm that constantly vibrates according to the pressure changes to prevent sedimentation of organic matter and other pollutants (self-cleaning). Irrigation was performed 5 d per week for 6 h d−1 and was operated for 12 weeks, representing the irrigation cycle of a typical field crop.
At the head of each line, a disinfection treatment was executed, either chlorination or UV-LED irradiation. The third line was not disinfected (control). Chlorination was achieved by pumping hypochlorite (as sodium hypochlorite) with an injection pump (gamma per L, ProMinent, USA) at the treatment line head ensuring 30 min contact time (see above). To ensure residual chlorine of 0.5–1.0 mg L−1 as Cl2, chlorine demand was measured using the DPD colorimetric method, according to APHA (2017).46 At the head of the UV-LED line, 2 flow-through UV-LED reactors were placed in series and were wired to a computer for internal heat measurements to ensure that the reactors do not overheat.
Chlorination was performed as a proactive measure, which was conducted when the relative emitter discharge along any of the two treatment lines dropped below 80% (residual chlorine at the dripper outlet of 0.5–1 mg L−1 as Cl2 for 3 and 2 h for chlorine and UV-LED lines, respectively). Further, once a week the flow-through UV-LED reactors were detached from the treatment line and washed with freshwater to reduce the potential of biofouling inside the reactors.
The B. subtilis (the target bacteria) concentration was measured twice a week at the three drippers' outlet of each line and was compared to its initial concentration measured at the STWW tank. Finally, log inactivation was calculated (log (B. subtilis concentration at the tank/B. subtilis at the outlet of the dripper)).
2.3 Biofouling clogging analysis
For biofouling clogging analysis at the full-scale pilot drip irrigation rig, we used non-destructive methods, which were continuously employed for 12 weeks, in parallel to extraction and destruction methods, performed at the end of the experiment. To assess which treatment provides better dripper functionality, statistical analyses were performed for all non-destructive (flow rate analysis; section 2.3.1) and destructive methods (chemical and microbial analysis and extracellular polymeric substances; section 2.3.2), using Student's t-test and ANOVA (analysis of variance), calculated using the statistical software JMP Pro. | (1) |
q i t Flow rate of dripper i at time t using STWW [L h−1]
q i 0 Initial flow rate of dripper i using distilled water (t = 0) [L h−1].
The relative dripper discharge along a treatment drip line was calculated as follows:
 | (2) |
n Number of drippers measuring the flow rate.
The uniformity of drip emitter flow rate presents a second key indicator to the drip line flow efficiency:
 | (3) |
 | (4) |
Chemical analysis. The chemical analysis procedure included cutting open the drippers, placing the drippers, including the internal diaphragm, in 20 mL glass vials with distilled water, ultrasonication for 15 min at 37 kHz and 100% strength (DC-250H digital ultrasonic cleaner, MRC, Israel) pouring solution through 1.2 μm glass-fiber filters (GFA, Whatman, UK) and washing the drippers by airbrush spraying distilled water. Drippers were filtered in pairs to ensure enough fouling material for measurement. Filtered rinse water was used for measuring total suspended solids (TSS) and volatile suspended solids (VSS),46 the filtrate was analyzed for TOC and TN using a TOC-TN analyzer (TOC-V CPH, equipped with a total nitrogen measuring unit, TNM-1; Shimadzu, Japan), positive ions (Mg2+, Na+, Fe3+, K+, Ca2+) using a high-resolution array ICP emission spectrometer (PLASMAQUANT® PQ 9000 ELITE; Analytik Jena AG, Germany), and negative ions (F−, Cl−, NO2−, Br−, NO3−, PO43−, SO42−) using an 881 Compact IC pro-Anion-MCS with chemical suppression by the Metrohm Suppressor Module, equipped with an 836 Compact Autosampler (Metrohm AG, Switzerland). Anion separation was performed on a Shodex column IC-SI-52 4E (4.0 mmID × 250 mmL). A 3.6 mM sodium carbonate (Na2CO3) solution was applied as an eluent.
Microbial analysis. Microbial analysis was achieved by rinsing the cut open drippers (including the internal diaphragm) with 20 mL PBS into sterile 50 mL Falcon tubes. The tubes were then vortexed and shaken (TS-400 orbital shaker, MRC, Israel) for 0.5 h to break/release the fouling structure. Using the filter membrane method, samples were seeded as mentioned in section 2.1.
Extracellular polymeric substances (EPS). The dripper inner side (including the internal diaphragm) was rinsed with 20 mL of PBS and the solute was collected in a tube. Tubes were vortexed and shaken. The EPS protocol was based on the Liu and Fang (2002) method which included biofilm extraction using the addition of sodium chloride (0.9%) and sodium carbonate (0.5%) for breaking the EPS bonds, followed by heating (0.5 h, 80 °C) and centrifugation (20 min at 6000 rpm; Biofuge Primo Heraeus Centrifuge; Kendro Laboratory Products, Germany).47 The supernatant extracted substance was filtered through a 0.45 μm filter (Merck Millipore, Germany) and dialyzed through a membrane with a molecular weight cutoff of 3.5 kDa (SnakeSkin®; Thermo Fisher Scientific, Inc., USA) to remove undesired ions and retain the EPS. The EPS protein and carbohydrate were separately assessed by following the procedure of two assay kits (Pierce™ BCA Protein Assay Kit, Thermo Fisher Scientific, Inc., USA and total carbohydrate assay kit, Abcam, Zotal, Israel, respectively) and measured using a plate reader (infinite 200Pro, Tecon Trading, Switzerland) at 562 nm and 490 nm,respectively.
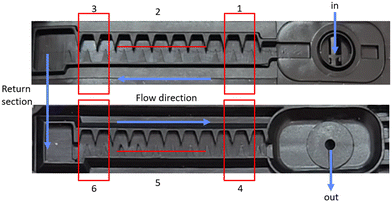
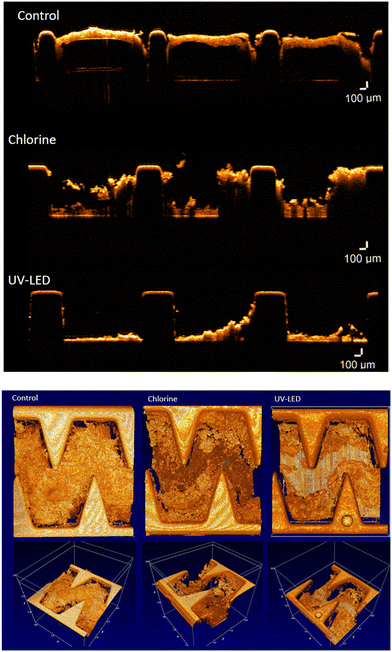
Optical coherence tomography (OCT). Optical coherence tomography (OCT) is a noninvasive imaging technique enabling high-resolution, cross-sectional imaging of a wide range of highly scattering media, such as biological tissues. OCT was used to study the biofilm structure inside the drippers of the three treatment lines (UV-LED, chlorine, and control), at the end of the experimental period (12 weeks). Dripper system valves were closed at both ends to keep the drippers wet and then the dripper system was disconnected from the irrigation line. The inside regions of interest of the cut-open drippers were scanned and snapshotted in 2D and 3D images using OCT apparatus (Thorlabs GmbH, Dachau, Germany) combined with high-performance data acquisition software (Software ThorImage OCT 4.4). The winding internal channel was divided into six sections (Fig. 3) to study biofouling in different parts of the channels. Three drippers were cut-open for each treatment line, each area was snapshotted three times and the obtained images were analyzed by image processing analysis. Based on Lequette et al. (2021), the OCT images were converted into the 8-bit gray-scale6 and an image processing code was developed to detect pixels associated with the plastic tube of the emitter and pixels associated with the biofilm clogging using MATLAB R2021b (MathWorks®, version 2021b). The total intensity of pixel matrix was calculated and signified the biofilm thickness. The data of each position (x, y) were binarized and the developed script was used for estimating the ratio of pixels associated with biofilm clogging to the total image pixels, meaning the biofilm percentage obtained for each treatment.
3. Results and discussion
3.1 UV-LED collimated beam characteristics
The irradiance of the UV-LED collimated beam was quantified by spectrophotometry and actinometry. The spectral emission measured by spectrophotometry revealed that the peak wavelength was slightly different from the nominal one given by the manufacturer (283.1 nm vs. 285 nm), and the full width at half-maximum was about 15 nm. The maximum irradiance flux, 9 cm from the UV-LED source, measured at the center of the water sample, was 50.2 μW cm−2 and the total irradiance flux was 1.9 mW cm−2. The total irradiance flux observed by actinometry was 0.55 mW cm−2, 3.45 times lower than the value obtained by the spectrophotometry method (the same phenomenon was observed for 255 and 265 nm irradiance, data not shown). The irradiance uniformity of the collimated beam (Fig. 4) yielded a Petri factor of 0.835 (6 cm dish at 9 cm distance from the UV-LED source), which is slightly lower than reported ones (∼0.9).24,40 Bolton and Linden (2003) stated that the Petri factor is affected by the design of the collimated beam apparatus, where high petri factors are obtained when the collimated beam apparatus is well designed.40 Moreover, if the light source was further from the reactor, the petri factor would likely improve.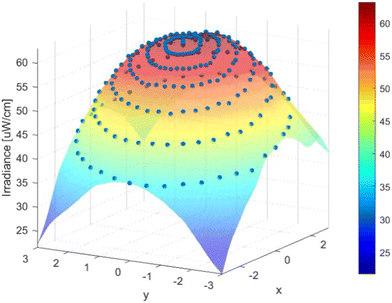 | ||
| Fig. 4 Irradiance profile of UV-LED radiation of the batch collimated beam (285 nm, measured 9 cm from the UV-LED source). | ||
3.2 Characterization of the flow-through UV-LED reactor
As stated above, to determine the residence time distribution and the flow regime in the UV-LED reactor a step-feed injection was applied at various theoretical residence times. Flow characterization parameters were determined by using the cumulative residence time distribution function and the residence time distribution function obtained from the tracer experiment, for each examined flow rate. tave/T and tp/T ratios, for all flow rates, were higher than 1.0, indicating that the flow distribution in the reactor was not uniform and that there were dead spaces. In addition, the t10/T ratio increased with the flow rate from 0.4 (flow rate: 0.1 L min−1) to 0.7 (0.6 L min−1), meaning that the first 10% of the tracer reached the outlet after 40–70% of the theoretical time. The results suggest that at the examined flow rates, some mixing occurred in the reactor. The use of Rebhun and Argaman's model confirmed this assumption since the model generated 60–70% degree of perfect mixing of the effective reactor volume.The UV-LED flow-through reactor radiation intensity was calculated experimentally by actinometry for all examined flow rates and the lamp intensity was calculated to be 5.1 ± 1.2 mW cm−2. Thus, the UV-LED flow-through reactor radiation intensity was one order of magnitude higher than the irradiance flux of the collimated beam, due to the internal structure of the flow-through reactor and number of LEDs within it. Each LED is an individual source of radiation; hence the number of LEDs and their position inside the reactor affect the total intensity.
The RED of the flow-through reactor was calculated by biodosimetry using the dose–response curve obtained from the thoroughly characterized collimated beam (section 3.1; Fig. 5a). The RED curve of the UV-LED reactor matches expectations, with higher inactivation for greater doses and lower flow rates (longer exposure time Fig. 5b and c). The UV transmittance (UVT) of the examined solutions affected the results of dose–response curves and the RED per flow rate. STWW exhibited a lower dose–response curve and RED per flow rate due to absorption and shading effects (UVT ∼80%) resulting from the presence of dissolved and particulate matter, as compared with the PBS solution (UVT ∼95%), which was clear from the dissolved and particulate matter.
3.3 Full-scale pilot drip irrigation rig
As mentioned, the pilot-scale drip irrigation rig was constructed to comparatively study the effectiveness of three treatments (UV-LEDs, chlorine, and control; no treatment) in the reduction of biofilm formation using direct non-destructive methods (flow rate measurement and analysis) and extraction and destruction of the clogging samples.Characterizing the flow-through UV-LED reactor provided data for determining the required UV-LED dose in the full-scale pilot drip irrigation rig. The “UV-LED-treated” line contained 10 integral pressure compensating drippers of 1.0 L h−1 flow rate each, meaning that the UV-LED reactor disinfected a total flow of 10 L h−1 (0.167 L min−1). According to Fig. 5, the UV-LED reduction equivalent dose (RED) delivered to STWW (UVT ∼80%) by adjusting the flow-through UV-LED reactor to 0.167 L min−1 was 17 mJ cm−2, based on a 2.5 log inactivation. Connecting two UV-LED reactors in series would result in an additive dose of about 34 mJ cm−2.
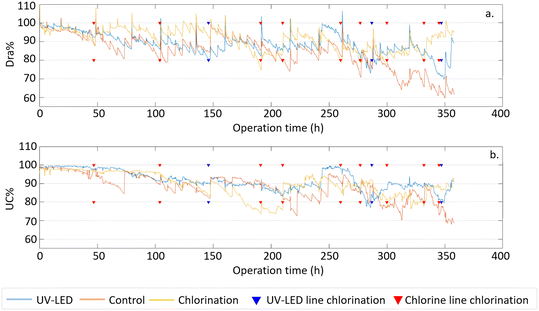
Differences between the three treatments were proven to be statistically significant (ANOVA, p < 0.05, measured throughout the study), meaning that although a small difference between chlorine and UV-LED lines was observed, it was statistically significant. Similar results (also statistically significant) were obtained for the uniformity coefficient (UC; Fig. 6b) with the UC of the control line being lower (70%) than the UC of chlorine and UV-LED lines (>90%).
Flow rate measurement and temporal recording help to understand the clogging development along the dripper lines. This estimates the presence of clogging and does not require extraction of samples and thus the destruction of drippers, and therefore can be used continuously in the field. However, flow measurement provides an indirect estimation and does not necessarily reflect the early stages of clogging as extraction methods may be able to do.
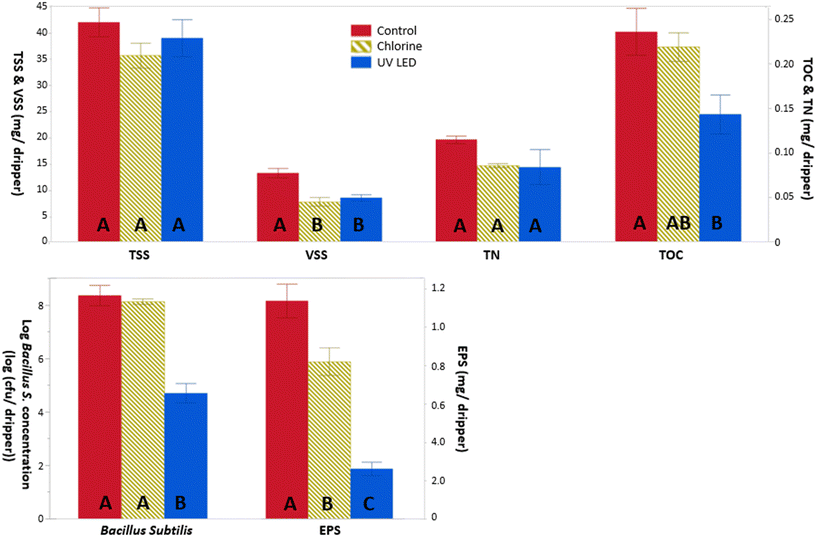 | ||
| Fig. 7 Chemical (top) and biological (bottom) biofilm analysis extracted from the three drippers lines. Different letters signify significantly different averages (p < 0.05). | ||
No clear trend was observed in the concentrations of the examined positive and negative ions at the tree lines (data not shown).
The B. subtilis concentration at the biofilm of the UV-LED line was 3 orders of magnitude lower than in the biofilm of the chlorine and control lines (Fig. 7, bottom). Interestingly, the chemical chlorination effect on the B. subtilis concentration was not significant. Following chlorination, the B. subtilis concentration in the clogging substances was similar to the concentration measured within the emitters of the control line. Hence, the B. subtilis concentration was much more affected by UV-LED disinfection than by chlorination.
EPSs, which are essential to ensure the maintenance and stability of the biofilm on any surface, such as emitters, were affected by the three different treatments (Fig. 7, bottom). The disinfection treatments (chlorination and UV-LED) could inhibit the secretion of EPSs within the clogging substances. The content of EPSs in the clogging substances was slightly lower for the chlorine emitter line compared to the control line, with a reduction of 30% (t-test, p < 0.01). These results are in line with Chen et al. (2022) who studied the effects of disinfection methods, including chlorine, on microbial EPS production and on membrane fouling.48 The authors reported that EPSs might benefit disinfection residual bacteria which are typically biofilm-forming bacteria, such as B. subtilis, by adhering the bacteria to the solid surface, leading to bacteria regrowth and EPS accumulation on the surface of the system. Increasing chlorine dose might have improved these results, as stated by Song et al. (2017), who indicated that the EPS content gradually decreased as chlorination and chlorine duration increased.4 However, high chlorine doses might damage the dripper internal structure.5
The impact of the UV-LED line on EPSs within the clogging substances was significantly higher, generating 80% and 68% reduction (t-test, p < 0.01) in the EPS clogging substances compared to the control and chlorine lines, respectively, thereby substantially minimizing the risk of emitter clogging. It should be noted that in this study we used synthetic treated wastewater to reduce unknown parameters. Real treated wastewater effluent would contain significant amounts of dissolved organic matter, including EPSs that were not simulated with the examined synthetic effluent.
An in-house image processing code was developed to quantitatively estimate the biofilm thickness and the proportion of the emitter cross sectional area covered by biofilm. The proportion of biofilm at the chlorine and control line were found to be similar, 43%, while at the UV-LED line the percentage of biofilm cover was lower, 32%. The biofilm thickness (estimated by the intensity function of the gray-scale pixels) was 7% and 37% lower at the chlorine and UV-LED lines compared to the control line, respectively, meaning that the chlorine dose used in this study was insufficient to reduce the level of clogging. Higher doses might improve the chlorination performance. On the other hand, the percentage of biofilm cover and biofilm thickness was significantly influenced by the UV-LED disinfection, where OCT images show that both the biofouling thickness and percentage of biofilm cover decreased, as compared to the control line.
4. Conclusions
To improve the efficiency of drip irrigation emitters fed with treated wastewater, it is desired to minimize biofouling clogging. In the present study, the potential of using UV-LED irradiation as a treatment to decrease biofouling formation was investigated as a measure to inactivate biofilm-forming bacteria present in treated wastewater effluent. To demonstrate the fundamental principles of UV-LED disinfection and to evaluate the UV-LED inactivation efficacy, bench-scale experiments were conducted, and UV-LED irradiation was characterized using a collimated-beam apparatus and a flow-through UV-LED reactor. Using the characterization data obtained by the bench-scale experiments, a full-scale pilot drip irrigation rig imitating a drip irrigation emitter line was designed and constructed, where biofilm formation was investigated.The pilot-scale irrigation rig was fed with STWW and consisted of three parallel drip-irrigation lines, each for specific treatment: UV-LEDs, chlorine, and control (no treatment), where the effectiveness to reduce biofilm formation due to the three treatments was compared. The direct non-destructive method of accurate-automatic discharge monitoring at a single dripper scale indicated that the relative drip emitter discharge and the uniformity coefficient along the control line significantly decreased after 12 weeks of operation, while the discharge and uniformity coefficient of the chlorine and UV-LED lines remained quite high, meaning that the drip line flow efficiency remained high for the UV-LED and chlorine lines and decreased for the control line.
After 12 weeks, the drippers were cut open and the biofilm developed within the examined pipeline drippers was analyzed. Concentrations of the chemical parameters indicate that the biofilms were lower in the chlorine and the UV-LED line drippers than in the control emitters. Microbial analysis revealed however that only the UV-LED treatment affected the biofilm development, with B. subtilis concentrations at the chlorine and control lines being similar and much higher than the B. subtilis concentration at the UV-LED line. EPS secretion within the clogging substances was inhibited by both disinfection treatments (chlorination and UV-LED irradiation) compared to the control line, with the UV-LED disinfection having a significant advantage, which had a meaningful impact on the EPS within the clogging substances. Image processing of the OCT analysis supports these results; a lower percentage of biofilm cover and lower biofilm thickness was obtained at the UV-LED line compared to the chlorine and control, meaning that high clogging potential was observed for the control and chlorine lines and limited clogging at the UV-LED line, though a higher chlorine dose might improve its performance.
The overall results indicate that UV-LEDs can play a critical role in reducing biofouling of drip irrigation fed with treated effluent compared to no treatment and chlorination. UV-LEDs may be advantageous further in that they can be located along the irrigation line as an integral part of the system and do not require any chemical addition, they are more environmentally friendly and are likely to reduce operation complexity (making a disinfectant storage tank and dosing equipment redundant), and therefore may serve as a suitable replacement to chlorine. However, there is a lack of information regarding the economic feasibility of using UV-LED irradiation as a treatment to decrease biofouling in emitters, such as initial capital investment, operation cost, energy demand, etc. Thus, future studies should focus on economic aspects of UV-LED irradiation for agriculture use.
The present study is a proof-of-concept of a new approach of using UV-LED irradiation for limiting biofouling formation in emitters fed with treated wastewater. The emerging UV-LED technology has great potential to become an attractive and feasible alternative to chlorine disinfection, and specifically, for minimizing biofouling in emitters fed with treated wastewater.
Data availability
Data for this article, including all experimental results, are available on OneDrive-Technion.Conflicts of interest
There are no conflicts to declare.Acknowledgements
This research was funded by the US-Israeli Binational Agricultural Research and Development Fund (BARD) Project IS-5130-18. The authors would like to express their gratitude to Professor Ori Lahav from Technion – Israel Institute of Technology, for assisting in the last stages of the paper preparation.References
-
N. Ait-Mouheb, P. L. Mayaux, J. Mateo-Sagasta, T. Hartani and B. Molle, Water reuse: a resource for Mediterranean agriculture, Water Resources in the mediterranean region, Elsevier Inc., 2020, pp. 107–136, DOI:10.1016/b978-0-12-818086-0.00005-4
.
- S. Ofori, A. Puškáčová, I. Růžičková and J. Wanner, Treated wastewater reuse for irrigation: Pros and cons, Sci. Total Environ., 2021, 760, 144026 CrossRef CAS PubMed
.
- H. Younas and F. Younas, Wastewater Application in Agriculture-A Review, Water, Air, Soil Pollut., 2022, 233(8), 1–28 CrossRef
.
- P. Song, Y. Li, B. Zhou, C. Zhou, Z. Zhang and J. Li, Controlling mechanism of chlorination on emitter bio-clogging for drip irrigation using reclaimed water, Agric. Water Manag., 2017, 184, 36–45 CrossRef
.
- O. Green, S. Katz, J. Tarchitzky and Y. Chen, Formation and prevention of biofilm and mineral precipitate clogging in drip irrigation systems applying treated wastewater, Irrig. Sci., 2018, 36(4), 257–270 CrossRef
.
- K. Lequette, N. Ait-Mouheb, N. Adam, M. Muffat-Jeandet, V. Bru-Adan and N. Wery, Effects of the chlorination and pressure flushing of drippers fed by reclaimed wastewater on biofouling, Sci. Total Environ., 2021, 758, 143598 CrossRef CAS PubMed
.
- K. Lequette, N. Ait-Mouheb and N. Wéry, Hydrodynamic effect on biofouling of milli-labyrinth channel and bacterial communities in drip irrigation systems fed with reclaimed wastewater, Sci. Total Environ., 2020, 738, 139778 CrossRef CAS PubMed
.
- J. Petit, S. M. García, B. Molle, R. Bendoula and N. Ait-Mouheb, Methods for drip irrigation clogging detection, analysis and understanding: State of the art and perspectives, Agric. Water Manag., 2022, 272, 107873 CrossRef
.
- J. Petit, S. M. García, B. Molle, D. Héran, N. Ait-Mouheb and R. Bendoula, Detection and monitoring of drip irrigation clogging using absorbance spectroscopy coupled with multivariate analysis, Biosyst. Eng., 2023, 235, 1–14 CrossRef CAS
.
- V. K. Tripathi, T. B. S. Rajput and N. Patel, Performance of different filter combinations with surface and subsurface drip irrigation systems for utilizing municipal wastewater, Irrig. Sci., 2014, 32(5), 379–391 CrossRef
.
- C. Solé-Torres, J. Puig-Bargués, M. Duran-Ros, G. Arbat, J. Pujol and F. R. De Cartagena, Effect of different sand filter underdrain designs on emitter clogging using reclaimed effluents, Agric. Water Manag., 2019, 223, 105683 CrossRef
.
- J. Puig-Bargues, G. Arbat, M. Elbana, M. Duran-Ros, J. Barragán, F. R. De Cartagena and F. R. Lamm, Effect of flushing frequency on emitter clogging in microirrigation with effluents, Agric. Water Manag., 2010, 97(6), 883–891 CrossRef
.
- S. Katz, C. Dosoretz, Y. Chen and J. Tarchitzky, Fouling formation and chemical control in drip irrigation systems using treated wastewater, Irrig. Sci., 2014, 32(6), 459–469 CrossRef
.
- T. A. P. Ribeiro, J. E. S. Paterniani and C. Coletti, Chemical treatment to unclogg dripper irrigation systems due to biological problems, Sci. Agric., 2008, 65, 1–9 CrossRef CAS
.
- P. Song, G. Feng, J. Brooks, B. Zhou, H. Zhou, Z. Zhao and Y. Li, Environmental risk of chlorine-controlled clogging in drip irrigation system using reclaimed water: the perspective of soil health, J. Cleaner Prod., 2019, 232, 1452–1464 CrossRef CAS
.
- F. Hao, J. Li, Z. Wang and Y. Li, Influence of chlorine injection on soil enzyme activities and maize growth under drip irrigation with secondary sewage effluent, Irrig. Sci., 2018, 36(6), 363–379 CrossRef
.
- Y. Du, X. T. Lv, Q. Y. Wu, D. Y. Zhang, Y. T. Zhou, L. Peng and H. Y. Hu, Formation and control of disinfection byproducts and toxicity during reclaimed water chlorination: A review, J. Environ. Sci., 2017, 58, 51–63 CrossRef CAS PubMed
.
- C. Marconnet, A. Houari, D. Seyer, M. Djafer, G. Coriton, V. Heim and P. Di Martino, Membrane biofouling control by UV irradiation, Desalination, 2011, 276(1–3), 75–81 CrossRef CAS
.
- F. C. Costa, B. C. Ricci, B. Teodoro, K. Koch, J. E. Drewes and M. C. Amaral, Biofouling in membrane distillation applications-a review, Desalination, 2021, 516, 115241 CrossRef CAS
.
- K. Song, M. Mohseni and F. Taghipour, Application of ultraviolet light-emitting diodes (UV-LEDs) for water disinfection: A review, Water Res., 2016, 94, 341–349 CrossRef CAS PubMed
.
- M. Mori, A. Hamamoto, A. Takahashi, M. Nakano, N. Wakikawa, S. Tachibana, T. Ikehara, Y. Nakaya, M. Akutagawa and Y. Kinouchi, Development of a new water sterilization device with a 365 nm UV-LED, Med. Biol. Eng. Comput., 2007, 45, 1237–1241 CrossRef PubMed
.
- A. C. Chevremont, J. L. Boudenne, B. Coulomb and A. M. Farnet, Impact of watering with UV-LED-treated wastewater on microbial and physico-chemical parameters of soil, Water Res., 2013, 47(6), 1971–1982 CrossRef CAS PubMed
.
- N. B. Silva, L. P. Leonel and A. L. Tonetti, UV-LED for safe effluent reuse in agriculture, Water, Air, Soil Pollut., 2020, 231, 1–10 CrossRef
.
- T. E. Randall, Y. S. Linden, J. Gamboa, B. Real, E. Friedler and K. G. Linden, Bacterial repair and recovery after UV LED disinfection: implications for water reuse, Environ. Sci.: Water Res. Technol., 2022, 8(8), 1700–1708 RSC
.
- J. Chen, S. Loeb and J. H. Kim, LED revolution: fundamentals and prospects for UV disinfection applications, Environ. Sci.: Water Res. Technol., 2017, 3(2), 188–202 RSC
.
- C. P. Wang, C. S. Chang and W. C. Lin, Efficiency improvement of a flow-through water disinfection reactor using UV-C light emitting diodes, J. Water Process Eng., 2021, 40, 101819 CrossRef
.
- A. H. Malayeri, M. Mohseni, B. Cairns and J. R. Bolton, Fluence (UV dose) required to achieve incremental log inactivation of bacteria, protozoa, viruses and algae, Interational Ultraviolet Association News, 2016, 18(3), 4–6 Search PubMed
.
- S. E. Beck, H. Ryu, L. A. Boczek, J. L. Cashdollar, K. M. Jeanis, J. S. Rosenblum, O. R. Lawal and K. G. Linden, Evaluating UV-C LED disinfection performance and investigating potential dual-wavelength synergy, Water Res., 2017, 109, 207–216 CrossRef CAS PubMed
.
- P. Jarvis, O. Autin, E. H. Goslan and F. Hassard, Application of ultraviolet light-emitting diodes (UV-LED) to full-scale drinking-water disinfection, Water, 2019, 11(9), 1894 CrossRef CAS
.
- K. Song, F. Taghipour and M. Mohseni, Microorganisms inactivation by wavelength combinations of ultraviolet light-emitting diodes (UV-LEDs), Sci. Total Environ., 2019, 665, 1103–1110 CrossRef CAS PubMed
.
- L. P. Leonel and A. L. Tonetti, Wastewater reuse for crop irrigation: Crop yield, soil and human health implications based on giardiasis epidemiology, Sci. Total Environ., 2021, 775, 145833 CrossRef CAS
.
- A. Kamel, M. Fuentes, A. M. Palacios, M. J. Rodrigo and M. Vivar, Deactivating environmental strains of Escherichia coli, Enterococcus faecalis and Clostridium perfringens from a real wastewater effluent using UV-LEDs, Heliyon, 2022, 8(12), 1–10 CrossRef PubMed
.
- L. Romero-Martínez, J. Moreno-Andrés, A. Acevedo-Merino and E. Nebot, Development of a geometrical model for the determination of the average intensity in a flow-through UV-LED reactor and validation with biodosimetry and actinometry, J. Water Process Eng., 2022, 49, 103137 CrossRef
.
- L. Romero-Martínez, P. Duque-Sarango, C. González-Martín, J. Moreno-Andrés, A. Acevedo-Merino and E. Nebot, Inactivation efficacy and reactivation of fecal bacteria with a flow-through LED ultraviolet reactor: Intraspecific response prevails over interspecific differences, J. Water Process Eng., 2023, 52, 103497 CrossRef
.
- T. M. H. Nguyen, P. Suwan, T. Koottatep and S. E. Beck, Application of a novel, continuous-feeding ultraviolet light emitting diode (UV-LED) system to disinfect domestic wastewater for discharge or agricultural reuse, Water Res., 2019, 153, 53–62 CrossRef CAS PubMed
.
- M. M. H. Oliver, G. A. Hewa and D. Pezzaniti, Bio-fouling of subsurface type drip emitters applying reclaimed water under medium soil thermal variation, Agric. Water Manag., 2014, 133, 12–23 CrossRef
.
- N. Ait-Mouheb, J. Schillings, J. Al-Muhammad, R. Bendoula, S. Tomas, M. Amielh and F. Anselmet, Impact of hydrodynamics on clay particle deposition and biofilm development in a labyrinth-channel dripper, Irrig. Sci., 2019, 37, 1–10 CrossRef
.
- S. Arnaouteli, N. C. Bamford, N. R. Stanley-Wall and Á. T. Kovács, Bacillus subtilis biofilm formation and social interactions, Nat. Rev. Microbiol., 2021, 19(9), 600–614 CrossRef CAS PubMed
.
- K. Sholtes and K. G. Linden, Pulsed and continuous light UV LED: microbial inactivation, electrical, and time efficiency, Water Res., 2019, 165, 114965 CrossRef CAS PubMed
.
- J. R. Bolton and K. G. Linden, Standardization of methods for fluence (UV dose) determination in bench-scale UV experiments, J. Environ. Eng., 2003, 129(3), 209–215 CrossRef CAS
.
- R. O. Rahn, M. I. Stefan, J. R. Bolton, E. Goren, P. S. Shaw and K. R. Lykke, Quantum yield of the iodide–iodate chemical actinometer: dependence on wavelength and concentration, Photochem. Photobiol., 2003, 78(2), 146–152 CrossRef CAS PubMed
.
- J. R. Bolton, M. I. Stefan, P. S. Shaw and K. R. Lykke, Determination of the quantum yields of the potassium ferrioxalate and potassium iodide–iodate actinometers and a method for the calibration of radiometer detectors, J. Photochem. Photobiol., A, 2011, 222(1), 166–169 CrossRef CAS
.
- E. Friedler and Y. Gilboa, Performance of UV disinfection and the microbial quality of greywater effluent along a reuse system for toilet flushing, Sci. Total Environ., 2010, 408(9), 2109–2117 CrossRef CAS PubMed
.
- M. Rebhun and Y. Argaman, Evaluation of hydraulic efficiency of sedimentation basins, J. Sanit. Eng. Div., 1965, 91(5), 37–48 CrossRef
.
- USEPA, Ultraviolet disinfection guidance manual for the final long term 2 enhanced surface water treatment rule, EPA report no. 815-R-06-007, Office of Water (Ed), 2006.
-
APHA/AWWA/WEF, Standard methods for the examination of water and wastewater, American Public Health Association, American Water Works Association, Water Environment Federation, 23rd edn, 2017 Search PubMed
.
- H. Liu and H. H. Fang, Extraction of extracellular polymeric substances (EPS) of sludges, J. Biotechnol., 2002, 95(3), 249–256 CrossRef CAS PubMed
.
- G. Q. Chen, Y. H. Wu, Z. Chen, L. W. Luo, Y. H. Wang, X. Tomg, Y. Bai, H. B. Wang, Y. Q. Xu, Z. W. Zhang, N. Ikuno and H. Y. Hu, Enhanced extracellular polymeric substances production and aggravated membrane fouling potential caused by different disinfection treatment, J. Membr. Sci., 2022, 642, 120007 CrossRef CAS
.
Footnotes |
| † Electronic supplementary information (ESI) available. See DOI: https://doi.org/10.1039/d4ew00271g |
| ‡ In memory of Barak White who sadly passed away in May 2022, before completing his research. |
| This journal is © The Royal Society of Chemistry 2024 |


