DOI:
10.1039/D3EY00264K
(Paper)
EES. Catal., 2024,
2, 675-686
Novel double-layer core–shell photocatalyst CdS–TiO2@NH2-MIL-101: enhanced conversion of CO2 and CH4 at ambient temperature†
Received
8th November 2023
, Accepted 3rd January 2024
First published on 4th January 2024
Abstract
The conversion of CO2 and CH4 into high value-added chemical products by chemical means is regarded as an emerging industrial technology to solve the increasingly serious climate and energy crises. The solar-powered conversion of CO2 and CH4 to syngas is one such technology that holds promise for the production of renewable fuels. Here, ternary core–shell CdS–TiO2@NH2-MIL-101 composites were prepared using mild experimental methods and their physical and chemical properties were studied using a series of characterization methods. In addition, the interaction between the coupling of different mass fractions of MOF, TiO2, and CdS and the performance of photocatalytic, photothermal, and thermocatalytic CH4 reforming were investigated. The results show that the yields of CO and H2 of the CdS–TiO2@NH2-MIL-101 catalyst at room temperature are 364.46 μmol g−1 and 100.43 μmol g−1, respectively, which are 1200–1500% of the catalytic performance of TiO2. Moreover, the yields of CO and H2 of the CdS–TiO2@NH2-MIL-101 material at 150 °C are 2831.55 μmol g−1 and 1448.20 μmol g−1, respectively. Based on isotope tracer experiments and CO2 adsorption experiments, a possible comprehensive mechanism for CdS–TiO2@NH2-MIL-101 photocatalytic CH4 reforming is proposed. In addition to presenting a fresh research concept for achieving carbon neutrality, this work offers a new technical pathway for the quick conversion of CO2 and CH4 at room temperature.
Broader context
The traditional thermal catalytic CH4 reforming process, as we know, has some drawbacks, such as high energy consumption and harsh reaction conditions. It is urgent to develop green and energy-saving CO2 and CH4 conversion technologies in light of the world's worsening energy crisis and environmental issues. In this study, the use solar energy to rapidly transform CO2 and CH4 at room temperature is proposed in order to reduce the energy consumption cost and break through the thermodynamic limitations of the CH4 reforming reaction. Here, we designed a novel two-core–shell structure catalyst CdS–TiO2@NH2-MIL-101, which could achieve rapid conversion of CO2 and CH4. The experimental method of this study provides a new idea for the realization of carbon neutrality and the development of binuclear shell catalysts.
|
1. Introduction
Significantly, the atmospheric concentration of CO2, which accounts for more than 50% of the greenhouse effect, has increased from 280 parts per million (ppm) before the advent of the industrial revolution to approximately 415 ppm now, with an average yearly increase of 2.1 ppm over the previous ten years.1 As is common knowledge, the effects of global warming include frequent extreme weather events, land desertification, rising sea levels, extinction of wildlife, significant increases in population health and health system risks, and destruction of biodiversity.2–4 These effects seriously endanger human well-being and the ability to sustainably develop economies. Thus, it is crucial to implement energy conservation and emission reduction in traditional fossil fuel-based industries in order to lower atmospheric CO2 concentrations and halt the trend of global warming.5–7
Nowadays, CO2 capture, utilization, and storage technology (CCUS) is one of the essential technologies for greenhouse gas emission reduction and global low-carbon development.8–10 It has the potential to achieve the efficient exploitation of fossil energy. As one of the active components of greenhouse gases, CH4 is second only to CO2 in the damage it causes to the global climate. The conversion of CO2 and CH4 into high value-added chemical raw materials could thus simultaneously solve the problems caused by the energy crisis and by the greenhouse effect,11,12 presenting a feasible solution and the best of both worlds. However, the traditional thermal catalytic conversion of CO2 and CH4 has shortcomings, such as a tendency for coking and deactivation of the catalyst, as well as requiring extremely high reaction temperatures, which severely limit its industrial applicability on a broad scale.13,14 The technology of photocatalytic methane reforming using solar energy had the advantages of a lower reaction temperature, energy saving, and environmental protection, and is regarded as a sustainable emerging method.15,16 In recent years, numerous researchers have made extremely satisfying scientific progress in the dry reforming of CO2 and CH4 with solar energy.
Recently, Laszlo et al.17 investigated the catalytic performance of titanate nanotube (TNT) catalysts loaded with Au and Rh for the photocatalytic conversion of CO2–CH4 at 403 K. It was reported that the yields of H2 and CO for Au/TNT were increased to 107.25 and 11.9 μmol h−1 g−1, respectively, compared with the blank catalyst TNT. In addition, Tahir et al.18 pointed out that 3% Ag–5% La/PCNNT could convert CH4 and CO2 into CO and H2 at 373 K, with formation rates of CO and H2 at 312.5 and 62.5 μmol h−1 g−1, respectively. Similarly, Li et al.19 successfully realized the catalytic oxidative coupling reaction of CO2 and CH4 under relatively mild experimental conditions using a Ag-supported TiO2 catalyst, and the yields of CO and C2H4 were 1149 and 686 μmol h−1 g−1, respectively. The number of active sites on catalysts can be significantly increased by grafting precious metals onto semiconductors. However, the use of this technology on a wide scale in industry is severely hampered by the rising cost of raw materials.20,21 Therefore, some researchers are now focusing on non-precious and metal-free semiconductor materials.
A novel all-solid-state Z-type heterojunction TiO2–TiC/g-C3N4 catalyst was investigated by Li et al.,22 and the results revealed that the yields of CO and H2 under optimal conditions were 11.3 and 2.15 μmol h−1 g−1, respectively. Moreover, Azmat et al.23 investigated the efficiency of the TiO2–C3N4/Ti3C2TA/R catalyst in the catalytic conversion of CH4 and CO2 with the assistance of a concentrator. The results showed that the yields of CO and H2 reached 87.34 and 51.24 μmol h−1 g−1, respectively. Similarly, Tahir et al.24 reported that the CO and H2 yields of 2D/2D porous C3N4–GO composite were 99.75 and 19.52 μmol h−1 g−1, respectively. The C3N4-modified composite material enhances the transport capacity of photogenerated electrons and hole pairs. Nonetheless, it cannot be denied that this catalyst suffers from issues including low stability and a high recombination rate of photogenerated electrons and hole pairs.25,26
NH2-MIL-101(Fe), a porous coordination polymer consisting of transition metal ions and organic ligands, has been extensively exploited in the field of photoreduction and CO2 capture due to its low preparation cost, strong visible light response, porous structure, and other advantages.27,28 Nevertheless, NH2-MIL-101(Fe) still needs to solve the problems of poor stability and the low transport efficiency of photogenerated electron and hole pairs. As an illustration, Dao et al.29 explored the catalytic performance of NH2-MIL-101(Fe)/C3N4 composites for CO2 reduction in solvent-free reactions. Coincidentally, Yuan et al.30 noted that TiO2@NH2-MIL-88 may effectively convert Cr(VI) in sewage to Cr(III), achieving the purpose of environmental management. Yet, there are very few reports of binary and ternary modified NH2-MIL-101 complexes in the field of photocatalytic CH4 dry reforming.
Herein, different MOF materials were prepared, and the interaction between the coupling of MOFs with different mass fractions of TiO2 and the photocatalytic CH4 reforming was explored. Based on this, the photocatalytic performance of the CdS–TiO2@MOF ternary hybrid material for the photocatalytic conversion of CO2 and CH4 was also investigated. Additionally, the catalytic performance of CdS–TiO2@MOF for CH4 reforming was compared under the experimental conditions of pure light, pure heat, and the photothermal combination. Then, using a variety of characterization techniques, the physicochemical and optoelectronic characteristics of the MOF and its modified composites were investigated. Finally, the possible mechanism of the CdS–TiO2@MOF photocatalytic CH4 reforming reaction is presented in conjunction with the physicochemical characteristics and performance test findings of the catalysts.
2. Experimental
2.1. Materials and reagents
Detailed information regarding the chemical reagents and related equipment involved in this study is presented in the ESI† S1 Material, and all reagents have not been further purified.
2.2. Preparation of the photocatalyst
(1) Preparation of NH2-MIL-101.
The metal–organic framework (MOF) material NH2-MIL-101 was prepared by the traditional hydrothermal synthesis reported by Bauer et al.31 Typically, 1.24 mmol of 2-aminoterephthalic acid was placed in beaker A containing 7.5 mL of N,N dimethylformamide (DMF) solution, and stirred uniformly for 10 min at room temperature. Similarly, 7.5 mL of DMF solution was added to beaker B, which also contained 2.497 mmol of FeCl3·6H2O. The mixed solution was stirred at room temperature for 10 min. Then, the liquid in beaker A was added dropwise to beaker B, and the mixture was transferred to a 50 mL hydrothermal reactor. The hydrothermal reactor was then heated for 24 h at 110 °C in the air. The resulting reddish-brown suspension was filtered with a centrifuge and washed three times with DMF solution. Moreover, the washed filter cake was dried in the air at 30 °C and then dried in a vacuum environment at 80 °C for 12 h. Finally, it was sufficiently ground into a powder solid to obtain NH2-MIL-101 (MOF).
(2) Preparation of TiO2@NH2-MIL-101.
TiO2 quantum dots were prepared by a wet chemical method,32 and the process is shown in S2 Methods (ESI†). Here, the preparation process of 60-TiO2@MOF is taken as an example. First, 60 mg of TiO2 and 100 mg of MOF were placed in a beaker containing 10 mL of ethanol solution, and sonicated in a water bath for 6–7 h. Next, the mixture was dried under vacuum at 80 °C for 12 h and ground into a solid powder to obtain 60-TiO2@MOF (NFT-60). The preparation processes for the other TiO2@MOF composites containing different mass fractions of TiO2 were similar to that of NFT-60, and the specific steps are shown in S2 Methods (ESI†).
(3) Preparation of CdS–TiO2@NH2-MIL-101.
CdS quantum dots were prepared by a hydrothermal synthesis, according to the literature with slight modifications,33 and the process can be found in S2 Methods (ESI†). Additionally, the CdS–TiO2@MOF ternary hybrid material was prepared by an ultrasonic drying method (Scheme 1a), and the specific preparation steps are similar to those for NFT-60.
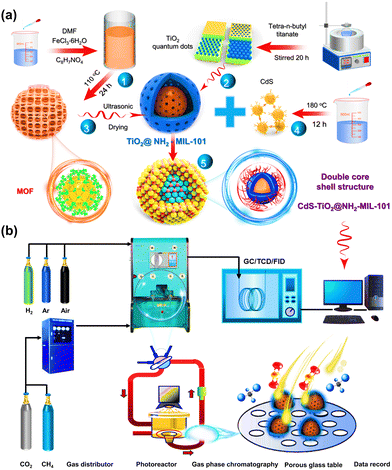 |
| | Scheme 1 (a) Schematic diagram of the process for preparing the ternary composites; (b) process flow equipment diagram for photocatalytic CH4 dry reforming. | |
2.3. Photocatalytic activity measurements
The photocatalytic performance of the catalyst was evaluated in terms of the CO and H2 yields at room temperature, and a schematic diagram of the experimental device is shown in Scheme 1b. Typically, CO2 and CH4 feed gases were passed through a gas mixer unit. The ultrafine glass fiber membrane, which served as the interface between the photocatalyst and the gas, was then covered with 50 mg of solid catalyst. After that, the photocatalytic performance measurements were carried out for 4 h under exposure to a high-pressure xenon lamp (300 W) to simulate sunlight. Notably, there was no external heat source used in any of the tests, and the feed pressure in the reactor was 40 kPa, controlled by the vacuum pump and the intake valve. Finally, in order to assess the experimental data more precisely and minimize errors, the reaction products were transported online to a gas chromatograph every 0.5 h, which was equipped with FID and TCD detection systems.
2.4. Characterization
The structure, morphology, physicochemical properties, and optoelectronic properties of the catalysts were studied by a series of characterization means. Relevant experimental methods and equipment information are presented in S3 Characterization of Catalysts (ESI†).
2.5. Computational details
In this work, all the theoretical computational models were based on density functional theory and were carried out on the Vienna Ab initio Software Package (VASP). The detailed calculation details can be could be found in S5 and Fig. S7–S13 (ESI†).
3. Results and discussion
3.1. Structure and morphology analysis
Powder X-ray diffraction (XRD) patterns of TiO2, NH2-MIL-101, TiO2@NH2-MIL-101, and CdS–TiO2@NH2-MIL-101 are displayed in Fig. 1a. It could be found that NH2-MIL-101 exhibited characteristic peaks at 8.9°, 10.3°, 16.4°, 20.2°, and 24.5°, which were consistent with the data reported in the literature,29,34,35 indicating that the pure phase NH2-MIL-101 material was successfully prepared. Furthermore, the characteristic peaks of TiO2 at 25.34° and 48.04° could also be observed.36–38 It is worth noting that the TiO2@NH2-MIL-101 catalyst displayed the characteristic peaks of both NH2-mil-101 and TiO2. The intensity of the MOF-specific characteristic peaks in the NFT material diminished as the mass fraction of TiO2 increased, which was the opposite of what happened with TiO2. This indicated the successful introduction of TiO2 into the skeleton architecture of MOF. Moreover, CdS–TiO2@NH2-MIL-101 showed new characteristic peaks at 26.2° and 43.9°,39,40 compared with NFT-60. These resulted from the interaction of CdS with TiO2@NH2-MIL-101, indicating that CdS was uniformly dispersed on the surface of TiO2@NH2-MIL-101.
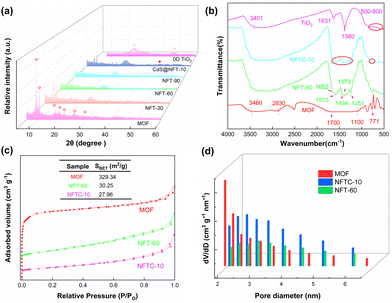 |
| | Fig. 1 (a) XRD patterns of the samples, (b) FT-IR spectra of the catalysts, (c) N2 adsorption–desorption isotherms of the MOF and hybrid materials; (d) particle-size distributions of the catalysts. | |
The functional group structure on the photocatalyst's surface was investigated by Fourier-transform infrared (FT-IR) spectroscopy experiments, and the outcomes are depicted in Fig. 1b and Fig. S1 (ESI†). For the MOF, it could be observed that absorption bands appeared at 771 and 1700 cm−1, which were attributed to the vibration of the carboxylic acid group.41 The peaks at 1100 and 2830 cm−1 might be related to the stretching vibrations of C–O and C–H.31 In addition, the absorption peak at 3460 cm−1 corresponded to the asymmetric stretching vibration of C–N in the amino group. The absorption band of pure TiO2 between 500–800 cm−1 was caused by the stretching vibrations of Ti–O and Ti–O–Ti.42 The symmetric stretching vibration mode of the carboxyl group was thought to be responsible for the peak at 1380 cm−1. The characteristic peaks of TiO2 at 1631 and 3401 cm−1 were related to the stretching vibration of O–H in lattice water. It is worth noting that the absorption peaks of NFT-60 at 1251 and 1575 cm−1 were ascribed to the stretching vibration of C–N and the asymmetric stretching vibration of O–C![[double bond, length as m-dash]](https://www.rsc.org/images/entities/char_e001.gif) O, respectively.43 Additionally, the characteristic peaks located at 771, 1373, and 1652 cm−1 were assigned to the vibration of the carboxylic acid group. However, the characteristic peak intensity of NFT between 1200 and 1700 cm−1 decreased as the mass fraction of TiO2 in the hybrid material increased (Fig. S1, ESI†). A similar situation emerged with the introduction of CdS into the backbone structure of NFT-60. Here, it may be that a new chemical bond was formed between the metal oxide and the MOF, breaking the original structure of MOF.
O, respectively.43 Additionally, the characteristic peaks located at 771, 1373, and 1652 cm−1 were assigned to the vibration of the carboxylic acid group. However, the characteristic peak intensity of NFT between 1200 and 1700 cm−1 decreased as the mass fraction of TiO2 in the hybrid material increased (Fig. S1, ESI†). A similar situation emerged with the introduction of CdS into the backbone structure of NFT-60. Here, it may be that a new chemical bond was formed between the metal oxide and the MOF, breaking the original structure of MOF.
The microstructural properties of the catalysts, such as the specific surface area, particle size, and micro-mesoporous volume, were investigated by carrying out N2 adsorption and desorption experiments, and the results are presented in Fig. 1c. All of the adsorption isotherms of the prepared materials were found to contain hysteresis loop structures,44,45 which were typical IV isotherms, indicating that the materials had mesoporous and microporous structures. Here, the specific surface areas of the MOF, NFT-60, and NFTC-10 were 329.34, 30.25, and 27.96 m2 g−1, respectively. The sharp reduction of the specific surface area of the binary or ternary hybrid materials may be related to the dispersion of TiO2 and CdS onto the surface or into the pores of the MOF.
This speculation was further supported by the catalyst's pore volume and particle size. Fig. 1d and Fig. S2 (ESI†) show that the pure MOF had an average particle size and pore capacity of 2.11 nm and 0.23 cm3 g−1, respectively. Nevertheless, the average particle sizes and pore volumes of NFT-60 and NFTC-10 were 0.10 and 0.09 cm3 g−1 and 3.15 and 4.17 nm, respectively. Moreover, the MOF itself contained microporous particle sizes, while NFT-60 and NFTC-10 catalysts had virtually no microporous particle sizes. The above data indicate that TiO2 and CdS had been uniformly dispersed on the surface or in the pores of MOF.
Scanning electron microscopy (SEM) experiments were carried out to investigate the morphologies of NH2-mil-101, TiO2@NH2-MIL-101, and CdS–TiO2@NH2-MIL-101, and the corresponding results are presented in Fig. 2 and Fig. S3 (ESI†). It could be distinctly observed that a single MOF had a regular octahedral structure,46,47 as displayed in Fig. 2a, b and Fig. S3a (ESI†). The morphology of the MOF was greatly changed after the introduction of TiO2 into the framework of the MOF. Additionally, NFT-60 had a morphology similar to that of an asymmetric ellipse or sphere with a layer of tiny solid particles on top. The consistent TiO2 coating on the surface of the MOF was to blame for this. Yet, the irregularity of the morphology of NFT increased with the mass fraction of TiO2 in NFT, which was related to the complete wrapping of TiO2 on the surface of the MOF (Fig. S3, ESI†). After the further grafting of CdS on to NFT-60, it was found that the morphology of CdS–TiO2@NH2-MIL-101 resembled a solid doughnut structure, filled with different solid small particles on the outermost and in the middle. In addition, the elemental distribution on the surface of the NFTC-10 catalyst was assessed by EXD mapping (Fig. S4, ESI†). The results show that three metal elements, namely Cd, Ti, and Fe, could be detected on the surface of the NFTC-10 material, demonstrating the successful introduction of TiO2 and CdS into the framework structure of the MOF.
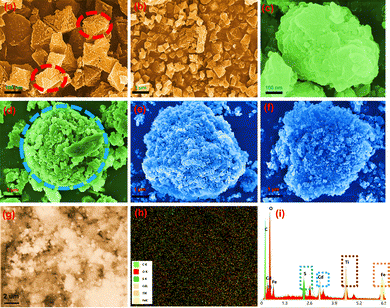 |
| | Fig. 2 (a)–(f) SEM images of catalysts; (g)–(i) EDX mapping images of NFTC-10. | |
The transmission electron microscopy (TEM) images of the MOF and the composite materials are displayed in Fig. 3 and Fig. S5 (ESI†). The MOF was found to possess an octahedral structure, which was confirmed by SEM. Fig. 3b and c show that TiO2 was uniformly wrapped around the surface of the MOF, forming irregular ellipsoidal spheres. The CdS was further loaded on the composite NFT-60, and it was observed that NFTC-10 formed concentric circular patterns with three layers of different shades of color. The SEM characterization results were identical to this, demonstrating that CdS was effectively grafted onto the composite. The boundary interfaces of MOF with TiO2 and CdS could be seen in the HR-TEM micrographs of NFTC-10, and the crystal plane spacings of TiO2 and CdS were calculated, as shown in Fig. 3e, f, and Fig. S5d (ESI†). The spacing of the lattice stripes of CdS and TiO2 were 0.32 and 0.35 nm, which fitted well with the (002) crystal plane of CdS and the (101) crystal plane of TiO2,48,49 respectively.
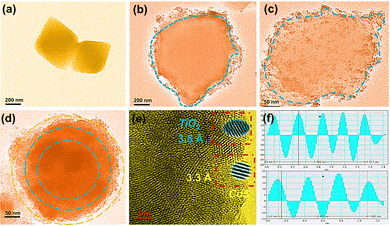 |
| | Fig. 3 TEM images of core–shell-structured catalysts: ((a) MOF; (b) NFT-30; (c) NFT-60; (d) NFTC-10; (e) HR-TEM image of NFTC-10; (f) crystal plane spacing diagram of NFTC-10). | |
The elemental composition and valence of the surface of the photocatalyst were studied by X-ray photoelectron spectroscopy (XPS), and the results are presented in Fig. 4. As shown in Fig. 4a, the elements C, N, O, and Fe were found in the full spectra of MOF, NFT-60, and NFTC-10. Apart from these, the Ti element was detected in the NFT-60 sample, and Ti, Cd, and S elements were detected in NFTC-10, indicating that the metal semiconductor was successfully grafted on the surface or in the pores of the MOF. In the high-resolution Fe 2p spectrum (Fig. 4b), the characteristic peaks of the MOF observed at 711.6 and 726.4 eV corresponded to Fe 2p3/2 and Fe 2p1/2,50,51 respectively. The characteristic peaks at 714.0, 718.5, 723.5, and 730.1 eV were the satellite peaks of Fe 2p3/2 and Fe 2p1/2, attributed to the high spin of the Fe (Fe3+) compound.52 The introduction of TiO2 and CdS into the structure of the MOF revealed a slight negative shift in the high-resolution spectral peaks of NFT-60 and NFTC-10 compared with that in the Fe 2p spectrum of MOF. This shift was related to the increase in electron cloud density of Fe3+ ions, whereupon the semiconductor forms a chemical bond with the NH2 group, causing the lone electron pair on the N atom to shift toward the Fe3+ ions.53 The Ti 2p map of TiO2@NH2-MIL-101 showed characteristic peaks at 458.9 and 464.7 eV (Fig. 4c), which were related to the spin–orbit splitting photoelectronic activity of the Ti 2p1/2 and Ti 2p3/2 chemical states of Ti4+.54–56 However, the peak of the characteristic energy spectrum of CdS–TiO2@NH2-MIL-101 showed a slight shift to the right, which may be related to the interaction of Cd with the NH2 group.
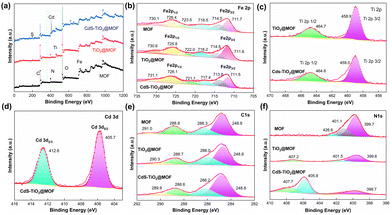 |
| | Fig. 4 XPS spectra of the MOF, TiO2@NH2-MIL-101, and CdS–TiO2@NH2-MIL-101 materials: (a) survey scan, Fe 2p (b), Ti 2p (c), Cd 3d (d), C 1s (e), and N 1s (f). | |
Additionally, the Cd 3d spectrum displayed two different spectral peaks located at 405.7 and 412.6 eV (Fig. 4d), which were assigned to the Cd 3d5/2 and Cd 3d3/2 orbitals of Cd,57,58 respectively. Four peaks at 248.8, 286.3, 288.9, and 291.0 eV were visible in the MOF C1 XPS patterns, indicating the existence of C–C, C–N, and C![[double bond, length as m-dash]](https://www.rsc.org/images/entities/char_e001.gif) O bonds in the MOF51,59 (Fig. 4e). Yet, the characteristic peak energy band values of the composite were slightly shifted to the right. As shown in Fig. 4f, the N1s XPS spectrum indicated the presence of –NH2 (399.7 eV), N–C
O bonds in the MOF51,59 (Fig. 4e). Yet, the characteristic peak energy band values of the composite were slightly shifted to the right. As shown in Fig. 4f, the N1s XPS spectrum indicated the presence of –NH2 (399.7 eV), N–C![[double bond, length as m-dash]](https://www.rsc.org/images/entities/char_e001.gif) O (401.1 eV), and –N–H+ (426.6 eV) chemical bonds in the MOF.60,61 However, the N1s characteristic peaks of TiO2@MOF and CdS–TiO2@MOF exhibited a slight negative shift, and a different satellite peak appeared in the 404–410 eV region. Here, it is possible that the grafted metal formed a chemical bond with N and the interaction between the organic ligands formed an π–π* bond, resulting in a shift of the main nitrogen peak to the left by a few eV.62
O (401.1 eV), and –N–H+ (426.6 eV) chemical bonds in the MOF.60,61 However, the N1s characteristic peaks of TiO2@MOF and CdS–TiO2@MOF exhibited a slight negative shift, and a different satellite peak appeared in the 404–410 eV region. Here, it is possible that the grafted metal formed a chemical bond with N and the interaction between the organic ligands formed an π–π* bond, resulting in a shift of the main nitrogen peak to the left by a few eV.62
3.2. Photocatalytic activities analysis
Electrochemical studies were used to explore the photoelectric characteristics of the catalysts, including the absorbance and photoresponse of the materials.63,64 The results are displayed in Fig. 5. Generally, for semiconductor materials, the greater the photocurrent response intensity, the stronger the separation ability of photogenerated electrons. It was noted that here that the MOF material alone had a weaker photocurrent response. Fortunately, grafting TiO2 on the MOF could significantly improve the photocurrent response intensity of the composites. Among the MOFs, NFT-60 had the highest photocurrent response intensity among all the binary composites. Also, the ternary hybrid material produced from combining CNT-60 and a small amount of CdS exhibited a significant change in the light-response intensity, and it was almost four times that of CNT-60. The above data indicate that the introduction of CdS and TiO2 could significantly enhance the separation rate of photogenerated electrons and hole pairs in the CdS–TiO2@NH2-MIL-101 composites.
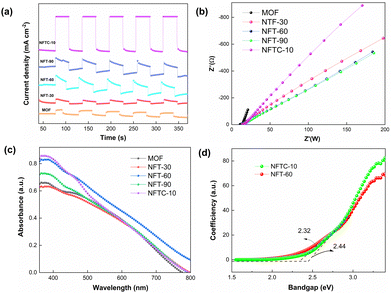 |
| | Fig. 5 (a) Transient photocurrent of the catalysts; (b) EIS spectra of the MOF and composite materials; (c) UV-vis diffuse reflection spectra of the samples; (d) band gap energies of the hybrid materials. | |
Moreover, in the impedance pattern, the radius of the arc of the Nyquist curve is related to the resistance of the charge transfer, and a smaller radius corresponds to a lower transfer resistance.65,66 From Fig. 5b, it is evident that the arc radius of the MOF was the largest, followed by those of NFTC-10 and NFT-30. It is worth noting that NFT-60 and NFT-90 had the smallest arc radii. This indicates that TiO2 supported on the MOF materials could improve the transmission rate of TiO2@NH2-MIL-101 electrons, while CdS grafting had a negative effect.
The UV-vis diffuse-reflectance experiments were conducted to investigate the light-absorption capacity of the catalysts, and the results are presented in Fig. 5(c and d) and Fig. S6 (ESI†). The MOF had a strong absorbance in the wavelength range of 380–500 nm. When a tiny amount of TiO2 was loaded on the MOF, it was found that the absorption intensity of NFT-30 in the ultraviolet region decreased, but the absorption capacity of NFT-30 in the visible region increased. By further increasing the mass fraction of TiO2 in the MOF, the absorbance of the hybrid material at 380–800 nm was significantly enhanced. Among the binary hybrids, NFT-60 exhibited the best light-absorption ability, followed by that of NFT-90. Interestingly, when introducing a slight amount of CdS into the structure of NFT-60, it was observed that the absorbance of CdS–TiO2@NH2-MIL-101 was diminished at 380–430 nm, but significantly increased at 430–800 nm. It could be observed from Fig. 5d and Fig. S6 (ESI†) that the band gaps of MOF, NFT-60, and NFTC-10 were 2.52, 2.32, and 2.44 eV, respectively, suggesting the interaction between TiO2, CdS, and MOF may change the band gap width of the composite. Also, the reason is that the light-absorption ability of the different hybrid materials was different.
3.3. Catalytic performances of the catalysts
3.3.1. Photocatalytic performance.
The photocatalytic CH4 reforming performance of the MOF, TiO2, and TiO2@MOF catalysts was evaluated by the yields of CO and H2, and the results are shown in Fig. 6. From Fig. 6a, it could be seen that the CO yield of TiO2 within 4 h was 31.16 μmol g−1. The CO yields of NH2-MIL-Al and NH2-MIL-101(Fe) were 54.60 and 126.72 μmol g−1, respectively, which were 175% and 407% higher than the catalytic performance of TiO2. On this basis, the photocatalytic performance of the composite of TiO2 and HN2-MIL-101 with different masses of TiO2 was studied, as shown in Fig. 6b. Here, the CO yield of NFT-30 was 291.76 μmol g−1. Importantly, the catalytic performance of the MOF could be greatly enhanced by the addition of TiO2. The photocatalytic performance of the TiO2@NH2-MIL-101 hybrid material was greatly enhanced as the mass fraction of TiO2 increased. When the mass of TiO2 was 60%, NFT-60 achieved the optimal catalytic performance, and the yield of CO was 468.24 μmol g−1. Then, the catalytic performance of NFT-90 followed closely, and the CO yield was 376.45 μmol g−1.
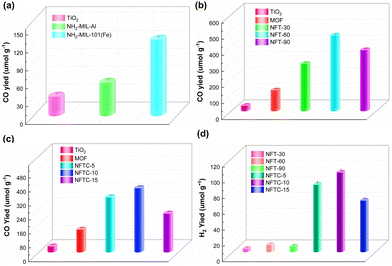 |
| | Fig. 6 CO and H2 yield rates of various samples (4 h). | |
Impressively, the H2 yields of NFT-30, NFT-60, and NFT-90 were 3.88, 8.77, and 6.82 μmol g−1, respectively. The H2 yields of TiO2@NH2-MIL-101, however, fell short of expectations. This might be associated with the water–gas shift reaction and the kind of active sites that the catalyst's exposure revealed. Nevertheless, it could still be proven that NFT-60 had the best catalytic efficiency among the five catalysts, and it was 1500% and 370% higher than that of TiO2 and MOF, respectively. A small quantity of CdS was next supported on the surface of the binary hybrid material NFT-60 to address this weakness and boost the effectiveness of the composite catalyst for the catalytic conversion of CH4. Fig. 6d demonstrates that a small amount of CdS could considerably boost the H2 production in the composite catalyst. Here, the H2 yield of 5%-CdS/TiO2@NH2-MIL-101 was 84.92 μmol g−1. Fortunately, the hydrogen yield of 10%-CdS/TiO2@NH2-MIL-101 was as high as 100.43 μmol g−1, which was almost 1200% more than that of TiO2@NH2-MIL-101. However, as the mass of the CdS increased, the catalytic efficacy of the CdS/TiO2@NH2-MIL-101 catalyst declined. The most obvious sign of this was that the hydrogen yield of 15%-CdS/TiO2@NH2-MIL-101 was 64.78 μmol g−1.
Additionally, it could be seen that the CO yields of NFTC-5, NFTC-10, and NFTC-5 were 312.88, 364.46, and 218.98 μmol g−1, respectively (Fig. 6c). Nevertheless, the CO yield of the ternary hybrid material was slightly decreased compared with the catalytic performance of TiO2@NH2-MIL-101. Based on the above data, it is clear that the introduction of CdS could enhance the activation of the C–H bond in CH4 and increase the production of H2. Meanwhile, the process of CdS and TiO2 compounding with the MOF enhanced the light-response intensity of the semiconductor. The recombination rate of electrons and holes in the composite material was also improved, which was not conducive to the reduction of CO2, resulting in a decrease in the yield of CO.
3.3.2. Photothermal catalysis.
The effect of temperature on the performance of NFTC-10 in photocatalytic CH4 reforming was investigated using a fixed-bed reactor under continuous feed conditions, and the results are shown in Fig. 7. From Fig. 7(a and b), it could be observed that the yields of H2 were 55.71 and 57.15 μmol g−1 for NFTC-10 under intermittent and continuous feeding conditions, respectively, while the yields of CO were 298.65 and 119.7 μmol g−1, respectively. The difference in catalytic performance may be related to the amounts of reactants adsorbed on the catalyst surface and the concentration of CO2 and CH4 in the system. Here, the catalytic performance of NFTC-10 was significantly improved when the temperature of the fixed-bed reactor was raised to 150 °C (Fig. 7(c and d)), and the yields of H2 and CO were 1448.20 and 2831.55 μmol g−1, respectively, which were 25.34 and 23.66 times higher than the catalytic performance of NFT-10 at room temperature. Here, the interaction between light and heat reduces the activation energy barrier of the reaction between CH4 and CO2, and significantly improves the catalytic efficiency of NFTC-10.
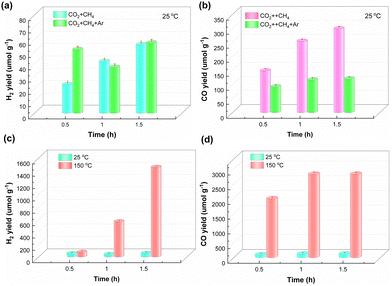 |
| | Fig. 7 Performance of NFTC-10 in photothermal catalytic methane reforming. | |
Therefore, the catalytic performance of NFTC-10 for CH4 dry reforming at different temperatures was also investigated in this work, as displayed in Fig. 8. The CO yield of NFTC-10 was 28 mmol g−1 at 600 °C. Its catalytic performance though improved with the increase in temperature. At 750 °C, the yield of CO of NFTC-10 reached a maximum of 471.62 mmol g−1. The catalytic performance of NFTC-10 initially increased but subsequently declined with the temperature in terms of the production of H2; whereby the H2 yield of NFTC-10 was 82.92 mmol g−1 at 600 °C, reaching a maximum value of 127.93 mmol g−1 at 670 °C, but then decreasing to 94.34 mmol g−1 with further increasing the temperature. It may be the case here that the higher temperature increased the rate of the side reaction of water–gas conversion, thus reducing the production of H2. The large energy input facilitated the activation of CH4 with CO2 and increased the reaction rate for dry reforming of methane. In addition, the ternary hybrid materials designed in this work achieved excellent catalytic performance in photocatalytic methane reforming and thermocatalytic methane reforming.
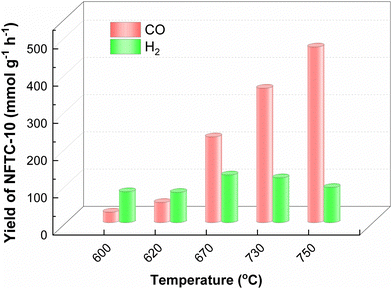 |
| | Fig. 8 Effect of temperature on the conversion of CO2 and CH4 catalyzed by NFTC-10. | |
3.3.3. Stability analysis.
The NFTC-10 photocatalytic CH4 reforming experiment was carried out continuously for 24 h to investigate the stability of the catalyst, and the results are presented in Fig. 9. Remarkably, the catalytic performance of NFTC-10 decreased significantly after three cycles of experiments. Thereafter, the yield of CO increased slowly with the increment in the reaction time. The catalytic activity of NFTC-10 essentially disappeared after the sixth cycle. The yield of H2 per unit time declined as the reaction time increased. After 24 h of continuous operation, the CO and H2 yields of NFTC-10 were 500 and 139 μmol g−1, respectively. The above data indicate that the catalytic performance of NFTC-10 seriously degraded after six cycles of experiments. Therefore, it was necessary to explore the cause of this deactivation.
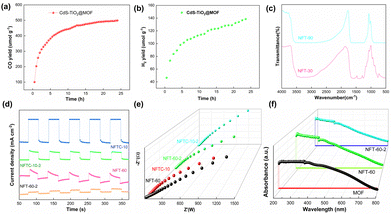 |
| | Fig. 9 Cyclic performance test of the NFTC-10 catalyst (a) and (b), yields of CO and H2; (c) FT-IR spectra; (d) I-T; (e) and (f), EIS and UV-vis diffuse reflection spectra; respectively). | |
The structure and photoelectrochemical properties of the cycled catalysts were investigated with four characterization methods (Fig. 9(c–f)). As can be observed in Fig. 9c, the FT-IR patterns of the fresh and cycled catalysts had slightly different peaks at 1200–1700 cm−1. The cycled catalyst displayed a new characteristic peak at 1200–1700 cm−1, which may be the result of the carboxylic acid group and O–C![[double bond, length as m-dash]](https://www.rsc.org/images/entities/char_e001.gif) O vibration. The results show that some intermediates were adsorbed on the active site of the catalyst during the dry reforming of methane, which resulted in the deactivation of the catalyst. In addition, the light-response intensity of both cycled catalysts NFT-60 and NFTC-10 decreased, compared to the fresh catalysts (Fig. 9d). The EIS experiments demonstrated that the impedance value of the circulating catalyst became smaller, indicating a faster compounding rate of photogenerated electrons and holes (Fig. 9e). It could also be observed from Fig. 9f that the light-absorption capacity of the NFT-60 catalyst also decreased after light exposure. From the above experimental data, it is shown that the carbon accumulation of the catalyst, the decrease in light-absorption capacity, and the acceleration of the photogenerated electron–hole complexation rate are critical causes of photocatalytic deactivation.67
O vibration. The results show that some intermediates were adsorbed on the active site of the catalyst during the dry reforming of methane, which resulted in the deactivation of the catalyst. In addition, the light-response intensity of both cycled catalysts NFT-60 and NFTC-10 decreased, compared to the fresh catalysts (Fig. 9d). The EIS experiments demonstrated that the impedance value of the circulating catalyst became smaller, indicating a faster compounding rate of photogenerated electrons and holes (Fig. 9e). It could also be observed from Fig. 9f that the light-absorption capacity of the NFT-60 catalyst also decreased after light exposure. From the above experimental data, it is shown that the carbon accumulation of the catalyst, the decrease in light-absorption capacity, and the acceleration of the photogenerated electron–hole complexation rate are critical causes of photocatalytic deactivation.67
3.4. Investigating the structure–functional relationships
Here, in order to better explore the interaction between the coupling between TiO2 and CdS distributed on the surface of the MOF and the renormalization performance of CH4, the energy barrier changes of some intermediates during the reaction of CO2 and CH4 were calculated by DFT. The CO2 adsorption and activation models of TiO2@NH2-MIL-101 and CdS/TiO2@NH2-MIL-101 are shown in Fig. 10a. It can be observed from Fig. 10b that the TiO2@NH2-MIL-101 catalyst could significantly reduce the activation energy of CO2 to the intermediates HOCO−* and *CO (˙CO2*− → ˙HOCO−*; −0.28 eV; ˙HOCO−* → *CO; −0.27 eV). When CdS was introduced to the surface of TiO2@NH2-MIL-101, it was found that the activation energy of CO2 to the intermediates ˙HOCO−* and CO* increased significantly (˙CO2*− → ˙HOCO−*; 0.29 eV; ˙HOCO−* → *CO; 0.23 eV). This indicated that the synergistic effect of TiO2 and NH2-MIL-101 can actively promote the activation of the C![[double bond, length as m-dash]](https://www.rsc.org/images/entities/char_e001.gif) O double bond in CO2. However, CdS will weaken the activation of TiO2 and NH2-MIL-101 on CO2 to a certain extent. The results show that the active site exposed by TiO2 is conducive to the conversion of CO2. The introduction of CdS covered part of the TiO2 active sites, resulting in a decrease in CO production.
O double bond in CO2. However, CdS will weaken the activation of TiO2 and NH2-MIL-101 on CO2 to a certain extent. The results show that the active site exposed by TiO2 is conducive to the conversion of CO2. The introduction of CdS covered part of the TiO2 active sites, resulting in a decrease in CO production.
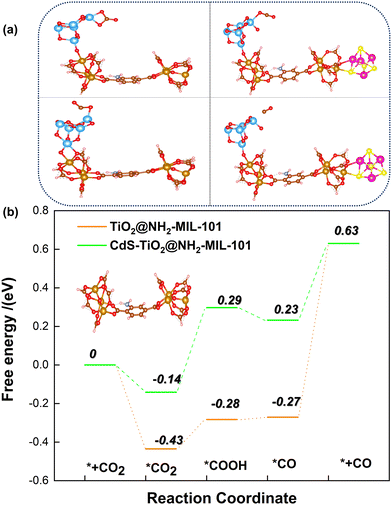 |
| | Fig. 10 Energy barrier change diagram of CO2 to CO photocatalyzed by the MOF-based composite catalysts. | |
Additionally, the influence of different catalysts on the reaction energy barrier of the C–H bonds in the CH4 dehydrogenation process was investigated (Fig. 11). It can be observed from Fig. 11b that as the deep dehydrogenation of CH4 increased, more energy was required during the reaction. The reaction energy barrier for the complete dehydrogenation of CH4 on the MOF was 19.40 eV ( ). Introducing TiO2 into the MOF could reduce the reaction energy barrier of CH4 to *C (
 ). The synergistic catalysis of CdS with TiO2 and the MOF could significantly reduce the total reaction energy barrier of CH4 to *C (
 ). The above calculations show that CdS plays a crucial role in C–H activation during CH4 dehydrogenation. The theoretical calculations were in high agreement with the experimental results.
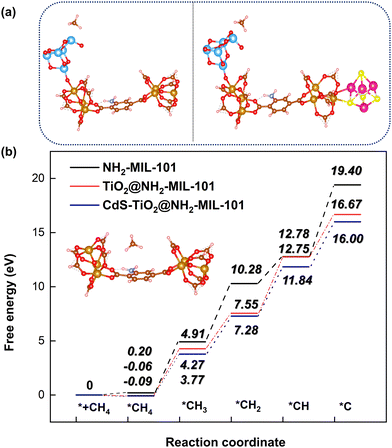 |
| | Fig. 11 Energy barrier change diagram for the photocatalytic dehydrogenation of CH4 reforming with the MOF-based composite catalysts. | |
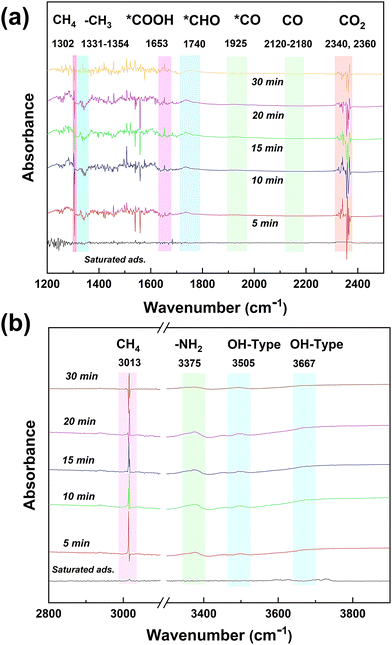
The changes of the functional groups on the surface of the NFTC-10 catalyst during the photocatalytic CH4 reforming process were studied by in situ DRIFTS characterization experiments (Fig. 12), which provided a theoretical basis for the possible catalytic mechanism. It can be observed from Fig. 12 that the absorption peaks of CO2 (2340 and 2360 cm−1) and CH4 (1302 and 3013 cm−1) on the catalyst surface gradually decreased with the increment in the reaction time. The absorption peak at 1330 cm−1 was attributed to the asymmetric stretching vibration of *CH3. The absorption peaks at 1653 and 1740 cm−1 were related to the asymmetric tensile vibrations of *COOH and *CHO, respectively. The weaker absorption peaks at 1925 and 2155 cm−1 were attributed to the asymmetric stretching vibrations of *CO and C![[double bond, length as m-dash]](https://www.rsc.org/images/entities/char_e001.gif) O in CO. It is worth noting that the peaks intensity of *CO and CO were relatively low, which may be related to the reaction time. Moreover, the strength of the absorption peaks at 3505 and 3667 cm−1 increased with time, which was caused by the stretching vibration of –OH.
O in CO. It is worth noting that the peaks intensity of *CO and CO were relatively low, which may be related to the reaction time. Moreover, the strength of the absorption peaks at 3505 and 3667 cm−1 increased with time, which was caused by the stretching vibration of –OH.
 |
| | Fig. 12
In situ DRIFTS spectra of chemical substances and intermediates in the photocatalytic CH4 reforming process by CdS/TiO2@NH2-MIL-101 catalysts. | |
3.5. Possible catalytic mechanism
Fig. 13 illustrates the results of isotopic tracer studies using 13C-labeled CO2 to investigate the origin of C in the product CO and to provide evidence for the investigation of a potential catalytic CH4 dry reforming mechanism. As observed in the mass spectra of Fig. 13a, the product CO showed only one peak at the mass-to-charge ratio m/z = 28 with 12CO2 as the reactant. The CO2 reduction studies used 13CO2 that had been 13C-labeled, and CO showed separate characteristic peaks at m/z = 28 and m/z = 29, which were attributed to 12CO and 13CO, respectively. The isotope tracing experiments demonstrated that C in the reaction product CO was derived from CO2 and CH4, respectively.
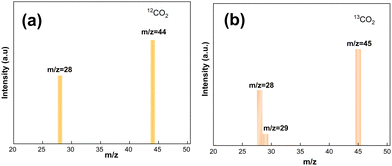 |
| | Fig. 13 Isotopic mass spectrometry analysis of the carbon products. | |
The CO2 adsorption of the composite catalyst was investigated by thermogravimetry, and the results are shown in Fig. 14. The CO2 adsorption amount of MOF after 40 min was 0.43 mmol g−1. However, the CO2 adsorption amount of NFT-30 was 0.33 mmol g−1. The CO2 adsorption amount of the NFT composites decreased with the increase in TiO2 loading. It could also be found that the adsorption amounts of NFT-60 and NFT-90 were 0.28 and 0.24 mmol g−1, respectively. It is known that the amino group and porous physical structure of the MOF was conducive to the adsorption of CO2 and CH4 small molecule gases. The introduction of TiO2 into the skeleton structure of the MOF may destroy the porous structure of the MOF, which is not conducive to the adsorption of CO2.
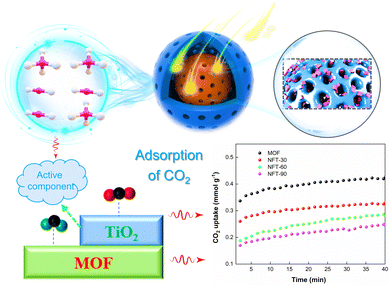 |
| | Fig. 14 CO2 adsorption schematic and performance curves for TiO2@NH2-MIL-101. | |
A possible catalytic mechanism for the dry reforming of CH4 by NFTC is postulated, as illustrated in Fig. 15, by combining the characterization, performance test studies, and isotope tracing investigations results. First, the reactants are fixed in the pore or on the surface of the catalyst under the action of van der Waals force and physical adsorption. The specific adsorption process is shown in eqn (1)–(6) and Fig. 14.
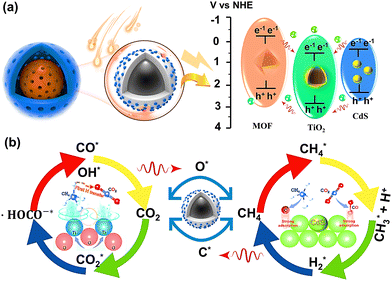 |
| | Fig. 15 Schematic diagram of possible catalytic mechanisms. | |
a. Adsorption on the catalysts:.
| | |
TiO2 + CH4 → TiO2 + CH4*
| (1) |
| | |
TiO2 + CO2 → TiO2 + CO2*
| (2) |
| | |
NH2-MiL-125 + CO2 → CO2* + NH2-MiL-125
| (3) |
| | |
NH2-MiL-125 + CH4 → CH4* + NH2-MiL-125
| (4) |
| | |
CdS + CH4 → CdS + CH4*
| (5) |
| | |
CdS + CO2 → CdS + CO2*
| (6) |
When the energy of the incident light is greater than the band gap (Eg) of the semiconductor, the electrons located in the valence band of the semiconductor can transition to the conduction band of the semiconductor after absorbing the energy of the photon (steps 7–9). Here, electrons are excited and transferred from the organic ligand of the MOF to the Fe–O cluster, leaving behind holes. Some of the photogenerated electrons on the MOF surface are compounded with holes on the TiO2 conduction band by the built-in electric field and diffusion, forming a specific heterojunction structure, which in turn accelerates the directional electron motion (Fig. 15a). Since the energy bands of CdS match each other with the energy bands of NH2-MIL-101, a modest amount of CdS quantum dots dispersed on the surface of TiO2@NH2-MIL-101 with a core–shell structure can further enhance the photoresponse intensity of the composite and accelerate the transport rate of photogenerated electrons and holes.
b. Photoexcitation:.
| | |
TiO2 + hν (UV) → TiO2 + e− + h+
| (7) |
| | |
NH2-MiL-125 + hν (UV) → NH2-MiL-125 + e− + h
| (8) |
| | |
CdS + hν (UV) → CdS + e− + h+
| (9) |
The electrons and holes on the surface of the composite can undergo redox reactions with CO2 and CH4 (Fig. 15b). The deep oxidation of CH4 can produce the intermediate products C* and H+*, and C* combines with O* from the reduction of CO2 to form CO* (steps 10–12). Moreover, CH4* can also be combined with O* to generate CHO* and H* (step 13). Then, CHO* can further generate CO* and H* (step 14). Two H+* can produce hydrogen with the help of electrons. CO can be directly generated by CO2 interacting with the photogenerated electrons. In addition, CO2 can produce intermediate products, such as ˙CO2*−, O*, ˙HOCO−*, after several reductions (steps 17–19). The structure of ˙HOCO−* is unstable and easily decomposes into CO* and OH− (step 20). OH− can bind to H+ on the surface of the catalyst to form H2O (step 21). Finally, the generated products are desorbed from the surface of the material or from the pores (steps 22–24).
c. Reaction and desorption:.
(1) Oxidation of CH4:.
| | |
CH4* + h+ → ˙CH3* + H+*
| (10) |
| |

| (11) |
| | |
CH4*+ O* → CHO* + 3H*
| (13) |
(2) Reduction of CO2:.
| | |
˙CO2*− + H+* + e− → ˙HOCO−*
| (19) |
(3) Desorption:.
4. Conclusion
The binary and ternary composites TiO2@NH2-MIL-101 and CdS–TiO2@NH2-MIL-101 were prepared by an ultrasonic drying method, and their physical and chemical properties were investigated by characterization with XRD, FT-IR, SEM, TEM, I-T, and UV/vis techniques. Then, the performances of 10 different catalysts in the dry reforming of CH4 (TiO2, NH2-MIL-Al, NH2-MIL-101, TiO2@NH2-MIL-101, and CdS–TiO2@NH2-MIL-101) were investigated. It is worth noting that the CO and H2 yields of 60-TiO2@NH2-MIL-10 were 468.24 and 8.77 μmol g−1, respectively. Impressively, the yields of CO and H2 of 10-CdS–TiO2@NH2-MIL-101 at 25 °C and 150 °C were 364.46, 100.43, 2831.55, and 1448.20 μmol g−1, respectively. The cyclic stability of the 10-CdS–TiO2@NH2-MIL-101 catalyst was investigated and the causes of its photocatalyst deactivation were explored. Finally, based on the material characterization, performance testing experiments, CO2 adsorption experiments, and isotope tracer experiments, a possible mechanism of photocatalytic CH4 reforming of ternary heterojunction composites was proposed.
Author contributions
Z. Liang and Y.-Q. Hung directed and supervised the study. X. Luo proposed innovative research methods, guided the specific implementation plan of this research, and modified the overall writing of the paper. Y. Huang carried out experiments, analyzing experimental data, and completed the writing of the paper. X. Wang and J.-P. Yin established the calculation model, completed all the theoretical calculation simulation experiments. H.-Y. Ma and L. Tan revised and polished the language of the paper.
Conflicts of interest
The authors declare that they have no known competing financial interests or personal relationships that could have appeared to influence the work reported in this paper.
Acknowledgements
The financial support from the National Natural Science Foundation of China (No. 22178089).
Notes and references
- J. Ren, A. Yu, P. Peng, M. Lefler, F.-F. Li and S. J. Licht, Acc. Chem. Res., 2019, 52, 3177–3187 CrossRef CAS PubMed
 .
.
- R. Rickaby, Nature, 2010, 465, 849 CrossRef CAS PubMed
 .
.
- S. J. Davis, K. Caldeira and H. D. Matthews, Science, 2010, 329, 1330–1333 CrossRef CAS PubMed
 .
.
- W. Wang, K. Zhang, T. Xu and Y. Yao, Energy Environ. Sci., 2022, 51, 17081–17088 CAS
 .
.
- A. M. Appel, J. E. Bercaw, A. B. Bocarsly, H. Dobbek, D. L. DuBois, M. Dupuis, J. G. Ferry, E. Fujita, R. Hille and P. J. Kenis, Chem. Rev., 2013, 113, 6621–6658 CrossRef CAS PubMed
 .
.
- S. I. Seneviratne, M. G. Donat, A. J. Pitman, R. Knutti and R. L. Wilby, Nature, 2016, 529, 477–483 CrossRef CAS PubMed
 .
.
- T. Zurrer, E. Lovell, Z. Han, K. Liang, J. Scott and R. Amal, Energy Environ. Sci., 2022, 14, 15669–15678 CAS
 .
.
- M. Aresta, A. Dibenedetto and A. Angelini, Chem. Soc. Rev., 2014, 114, 1709–1742 CrossRef CAS PubMed
 .
.
- W. Gao, S. Liang, R. Wang, Q. Jiang, Y. Zhang, Q. Zheng, B. Xie, C. Y. Toe, X. Zhu, J. Wang, L. Huang, Y. Gao, Z. Wang, C. Jo, Q. Wang, L. Wang, Y. Liu, B. Louis, J. Scott, A. C. Roger, R. Amal, H. He and S. E. Park, Chem. Soc. Rev., 2020, 49, 8584–8686 RSC
 .
.
- Y. Yan, T. N. Borhani, S. G. Subraveti, K. N. Pai, V. Prasad, A. Rajendran, P. Nkulikiyinka, J. O. Asibor, Z. Zhang, D. Shao and E. Science, Energy Environ. Sci., 2021, 14, 6122–6157 RSC
 .
.
- L. C. Buelens, V. V. Galvita, H. Poelman, C. Detavernier and G. B. Marin, Science, 2016, 354, 449–452 CrossRef CAS PubMed
 .
.
- Control methane to slow global warming — fast, Nature, 2021, 596, 461 DOI:10.1038/d41586-021-02287-y.
- S. M. Kim, P. M. Abdala, T. Margossian, D. Hosseini, L. Foppa, A. Armutlulu, W. van Beek, A. Comas-Vives, C. Copéret and C. Müller, J. Am. Chem. Soc., 2017, 139, 1937–1949 CrossRef CAS PubMed
 .
.
- M. Akri, S. Zhao, X. Li, K. Zang, A. F. Lee, M. A. Isaacs, W. Xi, Y. Gangarajula, J. Luo, Y. Ren, Y. T. Cui, L. Li, Y. Su, X. Pan, W. Wen, Y. Pan, K. Wilson, L. Li, B. Qiao, H. Ishii, Y. F. Liao, A. Wang, X. Wang and T. Zhang, Nat. Commun., 2019, 10, 5181 CrossRef PubMed
 .
.
- A. A. Khan and M. Tahir, Appl. Catal., B, 2021, 285, 119777 CrossRef CAS
 .
.
- A. V. Tavasoli, M. Preston and G. Ozin, Energy Environ. Sci., 2021, 14, 3098–3109 RSC
 .
.
- L. Balazs and K. Janos, Photoreactions in CO2-CH4 system on metal modified titanate nanotubes, LAP-Lambert Academic Publishing, 2016 Search PubMed
 .
.
- B. Tahir, M. Tahir and N. Amin, Appl. Catal., B, 2019, 248, 167–183 CrossRef CAS
 .
.
- N. Li, R. Jiang, Y. Li, J. Zhou and M. Liu, ACS Sustainable Chem. Eng., 2019, 7 Search PubMed
 .
.
- L. Foppa, T. Margossian, S. M. Kim, C. Müller, C. Coperet, K. Larmier and A. Comas-Vives, J. Am. Chem. Soc., 2017, 139, 17128–17139 CrossRef CAS PubMed
 .
.
- D. Li, Y. Nakagawa and K. Tomishige, Appl. Catal., A, 2011, 408, 1–24 CrossRef CAS
 .
.
- Z. Li, Y. Mao, Y. Huang, D. Wei, M. Chen, Y. Huang, B. Jin, X. Luo and Z. Liang, Catal. Sci. Technol., 2022, 12, 2804–2818 RSC
 .
.
- B. Aaka and A. Mt, Appl. Catal., B, 2020, 285 Search PubMed
 .
.
- B. Rria and A. Mt, Fuel, 2021, 305, 121558 CrossRef
 .
.
- H. Li, S. Gan, H. Wang, D. Han and L. Niu, Adv. Mater., 2015, 27, 6906–6913 CrossRef CAS PubMed
 .
.
- W. J. Ong, L. L. Tan, Y. H. Ng, S. T. Yong and S. P. Chai, Chem. Rev., 2016, 116, 7159–7329 CrossRef CAS PubMed
 .
.
- Y. Wang, H. Fang, S. Liang, X. Sheng, Y. Huang, Y. Zhang and Y. Zhou, Appl. Surf. Sci., 2022, 606, 154872 CrossRef CAS
 .
.
- Y. Wan, H. Yang, Q. Shang, Q. Cheng, H. Zhou and Z. Pan, Environ. Sci.: Nano, 2022, 9, 3081–3093 RSC
 .
.
- X. Y. Dao, X. F. Xie, X. Y. Zhang, Y. S. Kang and W. Y. Sun, ACS Appl. Energy Mater., 2020, 3, 3946–3954 CrossRef CAS
 .
.
- R. Yuan, C. Yue, J. Qiu, F. Liu and A. Li, Appl. Catal., B, 2019, 251, 229–239 CrossRef CAS
 .
.
- S. Bauer, C. Serre, T. Devic, P. Horcajada, J. Marrot, G. R. Ferey and N. Stock, Inorg. Chem., 2008, 47, 7568–7576 CrossRef CAS PubMed
 .
.
- Z. Jiang, X. Xu, Y. Ma, H. S. Cho and H. Deng, Nature, 2021, 590, E16 CrossRef CAS PubMed
 .
.
- H. Yang, C. Yang, N. Zhang, K. Mo and L. Wen, Appl. Catal., B, 2020, 285, 119801 CrossRef
 .
.
- X. Li, W. Guo, Z. Liu, R. Wang and H. Liu, J. Hazard. Mater., 2016, 324, 665–672 CrossRef PubMed
 .
.
- J. Liu, W. Cheng, K. Zhang, H. Liu, J. Li, J. Tressel and S. Chen, ACS Appl. Bio Mater., 2022, 5, 3912–3922 CrossRef CAS PubMed
 .
.
- J. Wang, Y. Shen, S. Liu and Y. Zhang, Appl. Catal., B, 2020, 270, 118885 CrossRef CAS
 .
.
- Y. Yu, X. Dong, P. Chen, Q. Geng, H. Wang, J. Li, Y. Zhou and F. Dong, ACS Nano, 2021, 15, 14453–14464 CrossRef CAS PubMed
 .
.
- Z. Cui, Q. Zhang, H. Fu, Q. Liu, X. Liu, Y. Wu, P. Gao, Z. Wang, Z. Zheng and H. Cheng, Appl. Catal., B, 2023, 333, 122812 CrossRef CAS
 .
.
- X. Zheng, Y. Li, J. Yang and S. Cui, Chem. Eng. J., 2021, 422, 130105 CrossRef CAS
 .
.
- H. Yang, C. Yang, N. Zhang, K. Mo, Q. Li, K. Lv, J. Fan and L. Wen, Appl. Catal., B, 2021, 285, 119801 CrossRef CAS
 .
.
- B. Mha, A. Wp, Y. A. Yang, S. A. Lang, A. Jc, C. Ak, A. Zz, A. Qf, D. Yt and L. Wei, J. Colloid Interf. Sci., 2021, 599, 484–496 CrossRef PubMed
 .
.
- A. Yz, A. Jx, A. Jm, A. Ss, B. Zwa, B. Tl, Y. B. Cheng and A. Zs, J. Hazard. Mater., 2020, 394, 122529 CrossRef PubMed
 .
.
- Y. Ma, D. G. Atinafu, G. Hai, W. Dong and G. Wang, Sci. Bull., 2020, 65 Search PubMed
 .
.
- S. Zhao, J. Xu, M. Mao, L. Li and X. Li, J. Colloid Interface Sci., 2021, 583, 435–447 CrossRef CAS PubMed
 .
.
- Y. H. Zou, Y. B. Huang, D. H. Si, Q. Yin, Q. J. Wu, Z. Weng and R. Cao, Angew. Chem., Int. Ed., 2021, 133, 21083–21088 CrossRef
 .
.
- S. Su, Z. Xing, S. Zhang, M. Du, Y. Wang, Z. Li, P. Chen, Q. Zhu and W. Zhou, Appl. Surf. Sci., 2021, 537, 147890 CrossRef CAS
 .
.
- K. E. Dekrafft, C. Wang and W. Lin, Adv. Mater., 2012, 24, 2014–2018 CrossRef CAS PubMed
 .
.
- D. Jiang, L. Zhu, R. M. Irfan, L. Zhang and P. Du, Chinese J. Catal., 2017, 38, 2102–2109 CrossRef CAS
 .
.
- J. Chen, M. Wang, J. Han and R. Guo, J. Colloid Interface Sci., 2020, 562, 313–321 CrossRef CAS PubMed
 .
.
- J. Xu, Y. Qi, C. Wang and L. Wang, Appl. Catal., B, 2019, 241, 178–186 CrossRef CAS
 .
.
- J. Fu, X. Wang, T. Wang, J. Zhang, S. Guo, S. Wu and F. Zhu, ACS Appl. Mater. Interfaces, 2019, 11, 33238–33244 CrossRef CAS PubMed
 .
.
- C. Y. Hu, Z. W. Jiang, C. P. Yang, X. Y. Wang, X. Wang, S. J. Zhen, D. M. Wang, L. Zhan, C. Z. Huang and Y. F. Li, Chem. Eur. J., 2022, e202201437 CrossRef CAS PubMed
 .
.
- X.-Y. Dao, X.-F. Xie, J.-H. Guo, X.-Y. Zhang, Y.-S. Kang and W.-Y. Sun, ACS Appl. Energy Mater., 2020, 3, 3946–3954 CrossRef CAS
 .
.
- H. Wang, X. Yuan, Y. Wu, G. Zeng, X. Chen, L. Leng and H. Li, Appl. Catal., B, 2015, 174, 445–454 CrossRef
 .
.
- K. Lan, Y. Liu, W. Zhang, Y. Liu, A. Elzatahry, R. Wang, Y. Xia, D. Al-Dhayan, N. Zheng and D. Zhao, J. Am. Chem. Soc., 2018, 140, 4135–4143 CrossRef CAS PubMed
 .
.
- M. Kim, J. Choi, W. Lee, Y.-Y. Ahn, H. Lee, K. Cho and J. Lee, Appl. Catal., B, 2023, 122993 CrossRef CAS
 .
.
- P. Wang, Y. Mao, L. Li, Z. Shen, X. Luo, K. Wu, P. An, H. Wang, L. Su and Y. Li, Angew. Chem. Int. Ed., 2019, 58, 11329–11334 CrossRef CAS PubMed
 .
.
- J. Li, L. Wang, W. Wang, X. Jia, Y. Zhang, H. Yang, Y. Li and Q. Zhou, Appl. Catal., B, 2023, 334, 122833 CrossRef CAS
 .
.
- M. Humayun, W. Pi, Y. Yuan, L. Shu, J. Cao, A. Khan, Z. Zheng, Q. Fu, Y. Tian and W. Luo, J. Colloid Interface Sci., 2021, 599, 484–496 CrossRef CAS PubMed
 .
.
- S. Qiu, Y. Zhou, X. Ren, B. Zou, W. Guo, L. Song and Y. Hu, Chem. Eng. J., 2020, 402, 126212 CrossRef CAS
 .
.
- S. Wang, Y. Xia, G. Yan, M. Chen, X. Wang, L. Wu and R. Liang, Appl. Catal., B, 2022, 317, 121798 CrossRef CAS
 .
.
- G.-M. Rignanese, A. Pasquarello, J.-C. Charlier, X. Gonze and R. Car, Phys. Rev. Lett., 1997, 79, 5174 CrossRef CAS
 .
.
- G. Tang, X. Zeng, L. Hou, T. Song, S. Yin, B. Long, A. Ali and G.-J. Deng, Appl. Catal., B, 2022, 306, 121090 CrossRef CAS
 .
.
- X. Liu, L. Yang, M. Huang, Q. Li, L. Zhao, Y. Sang, X. Zhang, Z. Zhao, H. Liu and W. Zhou, Appl. Catal., B, 2022, 319, 121887 CrossRef CAS
 .
.
- D. Long, J. Liu, H. Chen, P. Liu, K. Zheng, Y. Zeng, X. Chen, S. Li and M. Lu, Appl. Catal., B, 2023, 330, 122625 CrossRef CAS
 .
.
- H. Zhang, S. Si, G. Zhai, Y. Li, Y. Liu, H. Cheng, Z. Wang, P. Wang, Z. Zheng and Y. Dai, Appl. Catal., B, 2023, 122909 CrossRef CAS
 .
.
- G. E. Schukraft, B. Moss, A. G. Kafizas and C. Petit, ACS Appl. Mater. Interfaces, 2022, 14, 19342–19352 CrossRef CAS PubMed
 .
.
|
| This journal is © The Royal Society of Chemistry 2024 |
Click here to see how this site uses Cookies. View our privacy policy here.  Open Access Article
 *a and
Xiao
Luo
 *a
*a

![[double bond, length as m-dash]](https://www.rsc.org/images/entities/char_e001.gif) O, respectively.43 Additionally, the characteristic peaks located at 771, 1373, and 1652 cm−1 were assigned to the vibration of the carboxylic acid group. However, the characteristic peak intensity of NFT between 1200 and 1700 cm−1 decreased as the mass fraction of TiO2 in the hybrid material increased (Fig. S1, ESI†). A similar situation emerged with the introduction of CdS into the backbone structure of NFT-60. Here, it may be that a new chemical bond was formed between the metal oxide and the MOF, breaking the original structure of MOF.
O, respectively.43 Additionally, the characteristic peaks located at 771, 1373, and 1652 cm−1 were assigned to the vibration of the carboxylic acid group. However, the characteristic peak intensity of NFT between 1200 and 1700 cm−1 decreased as the mass fraction of TiO2 in the hybrid material increased (Fig. S1, ESI†). A similar situation emerged with the introduction of CdS into the backbone structure of NFT-60. Here, it may be that a new chemical bond was formed between the metal oxide and the MOF, breaking the original structure of MOF.

![[double bond, length as m-dash]](https://www.rsc.org/images/entities/char_e001.gif) O bonds in the MOF51,59 (Fig. 4e). Yet, the characteristic peak energy band values of the composite were slightly shifted to the right. As shown in Fig. 4f, the N1s XPS spectrum indicated the presence of –NH2 (399.7 eV), N–C
O bonds in the MOF51,59 (Fig. 4e). Yet, the characteristic peak energy band values of the composite were slightly shifted to the right. As shown in Fig. 4f, the N1s XPS spectrum indicated the presence of –NH2 (399.7 eV), N–C![[double bond, length as m-dash]](https://www.rsc.org/images/entities/char_e001.gif) O (401.1 eV), and –N–H+ (426.6 eV) chemical bonds in the MOF.60,61 However, the N1s characteristic peaks of TiO2@MOF and CdS–TiO2@MOF exhibited a slight negative shift, and a different satellite peak appeared in the 404–410 eV region. Here, it is possible that the grafted metal formed a chemical bond with N and the interaction between the organic ligands formed an π–π* bond, resulting in a shift of the main nitrogen peak to the left by a few eV.62
O (401.1 eV), and –N–H+ (426.6 eV) chemical bonds in the MOF.60,61 However, the N1s characteristic peaks of TiO2@MOF and CdS–TiO2@MOF exhibited a slight negative shift, and a different satellite peak appeared in the 404–410 eV region. Here, it is possible that the grafted metal formed a chemical bond with N and the interaction between the organic ligands formed an π–π* bond, resulting in a shift of the main nitrogen peak to the left by a few eV.62
![[double bond, length as m-dash]](https://www.rsc.org/images/entities/char_e001.gif) O vibration. The results show that some intermediates were adsorbed on the active site of the catalyst during the dry reforming of methane, which resulted in the deactivation of the catalyst. In addition, the light-response intensity of both cycled catalysts NFT-60 and NFTC-10 decreased, compared to the fresh catalysts (Fig. 9d). The EIS experiments demonstrated that the impedance value of the circulating catalyst became smaller, indicating a faster compounding rate of photogenerated electrons and holes (Fig. 9e). It could also be observed from Fig. 9f that the light-absorption capacity of the NFT-60 catalyst also decreased after light exposure. From the above experimental data, it is shown that the carbon accumulation of the catalyst, the decrease in light-absorption capacity, and the acceleration of the photogenerated electron–hole complexation rate are critical causes of photocatalytic deactivation.67
O vibration. The results show that some intermediates were adsorbed on the active site of the catalyst during the dry reforming of methane, which resulted in the deactivation of the catalyst. In addition, the light-response intensity of both cycled catalysts NFT-60 and NFTC-10 decreased, compared to the fresh catalysts (Fig. 9d). The EIS experiments demonstrated that the impedance value of the circulating catalyst became smaller, indicating a faster compounding rate of photogenerated electrons and holes (Fig. 9e). It could also be observed from Fig. 9f that the light-absorption capacity of the NFT-60 catalyst also decreased after light exposure. From the above experimental data, it is shown that the carbon accumulation of the catalyst, the decrease in light-absorption capacity, and the acceleration of the photogenerated electron–hole complexation rate are critical causes of photocatalytic deactivation.67![[double bond, length as m-dash]](https://www.rsc.org/images/entities/char_e001.gif) O double bond in CO2. However, CdS will weaken the activation of TiO2 and NH2-MIL-101 on CO2 to a certain extent. The results show that the active site exposed by TiO2 is conducive to the conversion of CO2. The introduction of CdS covered part of the TiO2 active sites, resulting in a decrease in CO production.
O double bond in CO2. However, CdS will weaken the activation of TiO2 and NH2-MIL-101 on CO2 to a certain extent. The results show that the active site exposed by TiO2 is conducive to the conversion of CO2. The introduction of CdS covered part of the TiO2 active sites, resulting in a decrease in CO production.

 ). Introducing TiO2 into the MOF could reduce the reaction energy barrier of CH4 to *C (
 ). The synergistic catalysis of CdS with TiO2 and the MOF could significantly reduce the total reaction energy barrier of CH4 to *C (
 ). The above calculations show that CdS plays a crucial role in C–H activation during CH4 dehydrogenation. The theoretical calculations were in high agreement with the experimental results.
![[double bond, length as m-dash]](https://www.rsc.org/images/entities/char_e001.gif) O in CO. It is worth noting that the peaks intensity of *CO and CO were relatively low, which may be related to the reaction time. Moreover, the strength of the absorption peaks at 3505 and 3667 cm−1 increased with time, which was caused by the stretching vibration of –OH.
O in CO. It is worth noting that the peaks intensity of *CO and CO were relatively low, which may be related to the reaction time. Moreover, the strength of the absorption peaks at 3505 and 3667 cm−1 increased with time, which was caused by the stretching vibration of –OH.

.
.
.
.
.
.
.
.
.
.
.
.
.
.
.
.
.
.
.
.
.
.
.
.
.
.
.
.
.
.
.
.
.
.
.
.
.
.
.
.
.
.
.
.
.
.
.
.
.
.
.
.
.
.
.
.
.
.
.
.
.
.
.
.
.
.


