 Open Access Article
Synthesis of a MOF-derived magnetite quantum dots on surface modulated reduced graphene oxide composite for high-rate lithium-ion storage
Ruixin
Jia
,
Longbiao
Yu
,
Zhenqi
Han
,
Shuo
Liu
,
Panpan
Shang
,
Siqi
Deng
,
Xuehua
Liu
and
Binghui
Xu
 *
*
Institute of Materials for Energy and Environment, College of Materials Science and Engineering, Qingdao University, Qingdao 266071, China. E-mail: xubinghuiqdu@qdu.edu.cn; xubinghuicsu@163.com
First published on 3rd October 2023
Abstract
As an anodic candidate material for lithium-ion batteries (LIBs), magnetite (Fe3O4) has the advantages of high theoretical capacity (926 mA h g−1), environmental friendliness, and natural abundance. The critical problems of inferior rate capability and cycling stability for Fe3O4 anodes need to be urgently solved. In this work, a composite anode material with Fe3O4 quantum dots immobilized by pyrolytic carbon and reduced graphene oxide skeleton (Fe3O4 QDs@C/RGO) is rationally engineered from a metal–organic framework (MOF) domain on surface-modulated RGO precursor. The involved raw materials are 1,3,5-benzenetricarboxylic acid (C9H6O6, trimesic acid, H3BTC), tea polyphenol (TP), few-layered graphene oxide (GO) and metal iron (Fe) foils, which react in mild hydrothermal condition in the synthesis of the Fe-BTC/TP-RGO precursor sample. The essence of the reactions has been uncovered, and the Fe3O4 QDs@C/RGO composite shows excellent lithium-ion storage capability with a reversible capacity of 1070.84 mA h g−1 after 150 cycles at 200 mA g−1, 738.03 mA h g−1 after 300 cycles at 1000 mA g−1 in half cells, and 717.29 mA h g−1 after 150 cycles at 200 mA g−1 in full cells. The sample synthesis protocol has the merits of simplicity and eco-friendliness, and the Fe3O4 QDs@C/RGO sample can be regarded as a promising anodic candidate for high-performance LIBs.
1. Introduction
Lithium-ion batteries (LIBs) currently have a dominant position in the portable electronics and new-energy automobile markets primarily from their higher energy density and superior cycling performance.1–3 To overcome the obstacle of the theoretical capacity limit of graphitic anodes (372 mA h g−1), both academia and industry are striving to develop advanced anode materials to satisfy the increasing demand from the rapid development of renewable energy utilization.4–12 Magnetite (Fe3O4) has been extensively studied as an alternative anode material for LIBs due to its high theoretical capacity (926 mA h g−1), environmental friendliness, and natural abundance. However, the sluggish electron conductivity and heavy volume change always lead to inferior cycling stability, particularly under higher current rate.13,14 In recent studies, quantum dots (QDs) with ultra-small size as the electrochemically active materials in LIBs have been proven to be able to shorten the ion diffusion distance, reduce the internal strain, and improve the reaction conversion efficiency.15–18 Meanwhile, to achieve satisfactory lithium-ion storage performances at high current densities, effectively immobilizing Fe3O4 QDs with a unique conductive supporting framework is a challenging task.Two-dimensional graphene oxide (GO) with a large specific surface area and abundant functional groups is dispersible in water phase, which facilitates the synthesis of reduced graphene oxide (RGO)-supported metal oxide nanocomposite materials.19,20 However, the excessive size growth of the nanocrystals and over-restacking of the RGO sheets impedes to a large extent the engineering of Fe3O4 QDs on RGO with optimized microstructure. On the other hand, porous metal–organic framework (MOF) materials are usually constituted of periodically arranged metal ion centers and organic ligands from a coordinating chelation reaction, which are also being employed as precursors for the synthesis of pyrolytic carbon-supported metal oxide nanocomposites.21–25 In our previous work, 1,3,5-benzenetricarboxylic acid (C9H6O6, H3BTC), a water-soluble small-molecule organic ligand, has been introduced in a redox coprecipitation reaction between metallic Fe and GO sheets to synthesize Fe-BTC MOF domains on a RGO sheets precursor sample, which is finally converted to Fe3O4 nanoparticles on carbon matrix after thermal treatment.26 Therefore, it is of great significance to further explore a simplified and eco-friendly method to synthesize a carbonaceous matrix-supported Fe3O4 QDs composite on the above foundation.
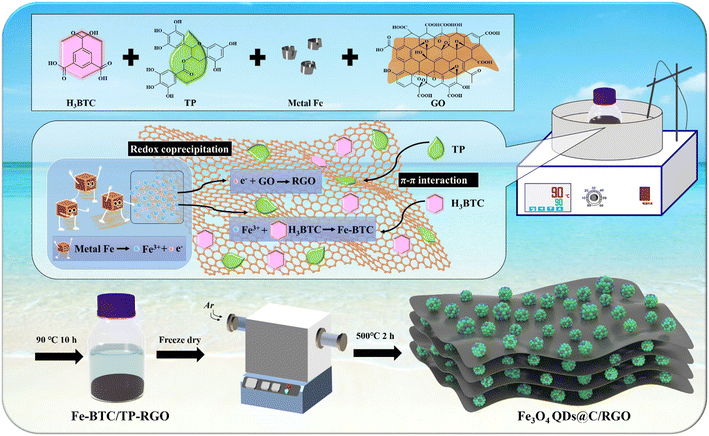
Tea polyphenol (TP) is an extract from green tea and a water-soluble mixture of condensed tannins with main-chain molecules consisting mainly of rigid aromatic rings. TP is effective in modifying the surface properties of RGO sheets, which can act as a reducing agent for partial removal of the functional groups on GO and directly decorate on RGO sheets.27–29 In this work, as illustrated in Scheme 1, under mild aqueous conditions, H3BTC, TP, GO, and iron foils are directly used as starting materials. Both H3BTC and TP molecules are decorated on the surface of the GO sheets via the π–π conjugation effect while a redox reaction between the Fe atoms and the oxidative functional groups of GO sheets takes place. Moreover, a chelating reaction between Fe3+ and the BTC3+ leads to the in situ crystallization of the Fe-BTC MOF domains on the TP-decorated RGO (TP-RGO) framework. Particularly, in the presence of TP, both the crystallization of the Fe-BTC MOF domains and the restacking of the TP-RGO sheets are significantly controlled. In other words, the as-formed small-sized Fe-BTC domains and abundant TP molecules are jointly dispersed on RGO sheets without severe restacking in the Fe-BTC/TP-RGO precursor. After thermal treatment, the composite sample with Fe3O4 QDs immobilized by pyrolytic carbon and RGO skeleton (Fe3O4 QDs@C/RGO) is finally synthesized, in which the homogeneously distributed small-sized Fe-BTC domains are converted to pyrolytic carbon-immobilized Fe3O4 QD clusters on RGO sheets. The unique microstructure of the Fe3O4 QDs@C/RGO sample contributes to improved electronic and ionic transportation efficiency and suppressed volume change; thus, significantly enhanced electrochemical performances for this sample have been witnessed.
2. Experimental section
2.1 Reagents and materials
H3BTC (98%) was supplied by Accela Chembio. TP (97%) was obtained from Macklin. Metal Fe foil (0.15 mm thick, 99.99%) was purchased from Hunan Metal Materials, China. GO was synthesized from natural graphite flake (Sigma Aldrich, 325 mesh) according to our previously published method.302.2 Sample synthesis
Fe3O4 QDs@C/RGO: in a typical experiment, H3BTC (1.0 g), TP (1.0 g), GO (0.1 g) and several polished iron foils were dissolved in 150 mL of deionized water and kept magnetically stirred in an oil bath at 90 °C for 10 h. After freeze-drying, the intermediate Fe-BTC/TP-RGO powder with black color was obtained. Finally, the Fe-BTC/TP-RGO sample underwent a thermal treatment at 500 °C for 2 h in Ar condition, and the final black Fe3O4 QDs@C/RGO sample was thus fabricated.2.3 Sample characterization and electrochemical measurement
![[thin space (1/6-em)]](https://www.rsc.org/images/entities/char_2009.gif) :
:![[thin space (1/6-em)]](https://www.rsc.org/images/entities/char_2009.gif) 1
1![[thin space (1/6-em)]](https://www.rsc.org/images/entities/char_2009.gif) :
:![[thin space (1/6-em)]](https://www.rsc.org/images/entities/char_2009.gif) 1
1![[thin space (1/6-em)]](https://www.rsc.org/images/entities/char_2009.gif) :
:![[thin space (1/6-em)]](https://www.rsc.org/images/entities/char_2009.gif) 1. An appropriate amount of 1-methyl-2-pyrrolidone (NMP) was added to form a homogeneous slurry, which was coated on copper foil by the doctor blade technique. For the LiFePO4 cathode, LiFePO4, Super P and PVDF were mixed in a weight ratio of 8
1. An appropriate amount of 1-methyl-2-pyrrolidone (NMP) was added to form a homogeneous slurry, which was coated on copper foil by the doctor blade technique. For the LiFePO4 cathode, LiFePO4, Super P and PVDF were mixed in a weight ratio of 8![[thin space (1/6-em)]](https://www.rsc.org/images/entities/char_2009.gif) :
:![[thin space (1/6-em)]](https://www.rsc.org/images/entities/char_2009.gif) 1
1![[thin space (1/6-em)]](https://www.rsc.org/images/entities/char_2009.gif) :
:![[thin space (1/6-em)]](https://www.rsc.org/images/entities/char_2009.gif) 1, then NMP was added to form a homogeneous slurry, which was coated on an aluminum foil. CR2016 half cells were assembled with metal lithium foil as counter/reference electrode. Celgard 2600 film was used as a separator between the two electrodes. The electrolyte was composed of 1.0 M lithium hexafluorophosphate (LiPF6) in a solvent of ethylene carbonate (EC), dimethyl carbonate (DMC), and ethylene methyl carbonate (EMC) in a volumetric ratio of 1
1, then NMP was added to form a homogeneous slurry, which was coated on an aluminum foil. CR2016 half cells were assembled with metal lithium foil as counter/reference electrode. Celgard 2600 film was used as a separator between the two electrodes. The electrolyte was composed of 1.0 M lithium hexafluorophosphate (LiPF6) in a solvent of ethylene carbonate (EC), dimethyl carbonate (DMC), and ethylene methyl carbonate (EMC) in a volumetric ratio of 1![[thin space (1/6-em)]](https://www.rsc.org/images/entities/char_2009.gif) :
:![[thin space (1/6-em)]](https://www.rsc.org/images/entities/char_2009.gif) 1
1![[thin space (1/6-em)]](https://www.rsc.org/images/entities/char_2009.gif) :
:![[thin space (1/6-em)]](https://www.rsc.org/images/entities/char_2009.gif) 1, in which 1.0% vinylene carbonate (VC) was added. For the coin-type full cells, CR2025 cells were assembled using a LiFePO4 cathode and an Fe3O4 QDs@C/RGO anode, in which the anode was pre-lithiated for 6 cycles in a half cell.
1, in which 1.0% vinylene carbonate (VC) was added. For the coin-type full cells, CR2025 cells were assembled using a LiFePO4 cathode and an Fe3O4 QDs@C/RGO anode, in which the anode was pre-lithiated for 6 cycles in a half cell.
Cyclic voltammetry (CV) measurements were performed with a CHI 660E electrochemical workstation. Galvanostatic charge and discharge tests were carried out with a Neware battery test instrument and the specific capacity was calculated based on the mass of the synthesized composite samples. Electrochemical impedance spectroscopy (EIS) tests were also carried out using the CHI 660E electrochemical workstation.
3. Results and discussion
3.1 Structure and morphology
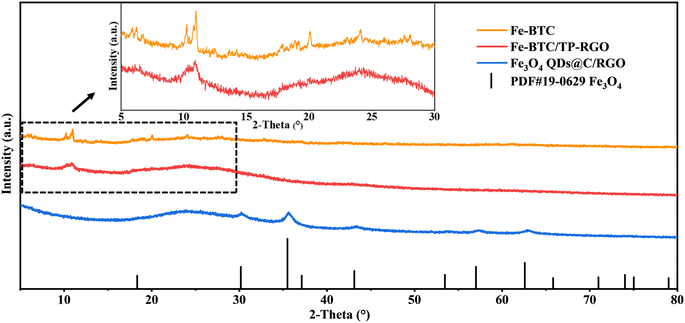
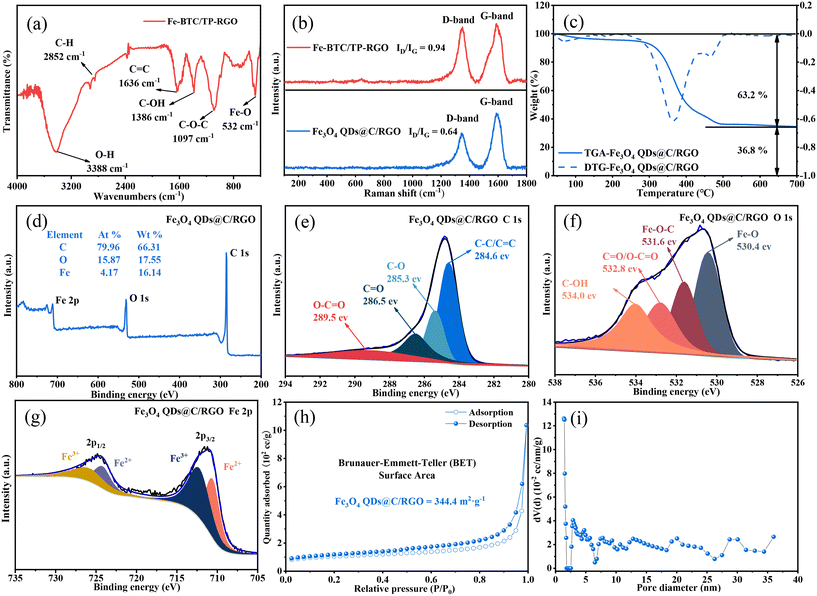
In the first mild aqueous condition, the color of the reaction system gradually turns black, and the Fe-BTC/TP-RGO sample can be collected as a sediment. After freeze-drying and thermal treatment, the final Fe3O4 QDs@C/RGO sample can be synthesized from the Fe-BTC/TP-RGO precursor. From the XRD pattern of the Fe-BTC sample in Fig. 1, several weak diffraction peaks located at 2θ = 10.16, 10.90, 20.06, and 23.98 degrees are in general agreement with Fe-BTC MOF.31–33 The XRD pattern of Fe-BTC/TP-RGO displays a broad diffraction peak at 2θ = 24.50 degrees indicating the formation of the RGO supporting skeleton.34 Moreover, from the locally magnified XRD patterns for the above two samples, the characterization peaks are in good agreement, indicating the successful engineering of the Fe-BTC MOF domains in the Fe-BTC/TP-RGO sample. However, the significantly weakened intensity of the XRD peaks for the Fe-BTC MOF species is highly attributed to its limited crystallization on the surface of the TP-modulated RGO sheets. For the Fe3O4 QDs@C/RGO sample, the apparent diffraction peaks situated at 2θ of 30.10, 35.42, 43.05, 53.39, 56.94, and 62.52 degrees correspond to the Fe3O4 (JCPDS card number 19-0629) crystallographic planes of (2 2 0), (3 1 1), (4 0 0), (4 2 2), (5 1 1), and (4 4 0), respectively. The characterization peak of RGO can also be seen without any diffraction peaks of other possible impurities.The FTIR analysis result of the Fe-BTC/TP-RGO sample is shown in Fig. 2a. The sharp peak at about 3388 cm−1 is attributed to free O–H bonds in the structure. The bands at 2852 cm−1, 1097 cm−1 and 1636 cm−1 are attributed to the stretching vibrational peaks of C–H, C–O–C and C![[double bond, length as m-dash]](https://www.rsc.org/images/entities/char_e001.gif) C, while the peaks at 1636 and 1386 cm−1 belong to aromatic C
C, while the peaks at 1636 and 1386 cm−1 belong to aromatic C![[double bond, length as m-dash]](https://www.rsc.org/images/entities/char_e001.gif) C bonds and C–OH bonds, respectively.35,36 Moreover, the characteristic peak at 532 cm−1 is related to Fe–O stretching vibrations.
C bonds and C–OH bonds, respectively.35,36 Moreover, the characteristic peak at 532 cm−1 is related to Fe–O stretching vibrations.
In Fig. 2b, two main Raman peaks of the D-band (1325 cm−1) and G-band (1590 cm−1) can be seen for the Fe-BTC/TP-RGO and Fe3O4 QDs@C/RGO samples. The D-band corresponds to the defective and disordered part of the sp3 carbon, while the G-band is associated with the ordered sp2 carbon.37,38 The integral intensity ratio of the D-band and G-band is another feature of the Raman spectrum, which provides useful information about the degree of carbon disorder. The intensity ratios ID and IG are measured to be 0.94 and 0.64 for the two samples, indicating fewer defects and a high degree of carbon order after thermal treatment. It can be revealed that with the presence of the surface-decorated TP, the conjugated electronic structure of the RGO sheets is repaired during the thermal treatment. Moreover, the large amount of ligand BTC pyrolyzed carbon also accounts for the high graphitization degree of the Fe3O4 QDs@C/RGO sample.
Fig. 2c exhibits the TGA and DTG curves of the Fe3O4 QDs@C/RGO sample. From the TGA curve, the initial weight loss that occurred from 30 °C to 100 °C is ascribed to the evaporation of water. The subsequent weight loss mainly occurs between 300 °C and 600 °C, which can be attributed to the oxidation of Fe3O4 to Fe2O3 and the decomposition of pyrolytic carbon. The mass loss of the Fe3O4 QDs@C/RGO sample can be divided into two stages, probably originating from the decomposition of the organic pyrolyzed carbon and RGO sheets. From the corresponding DTG curve, the inflection points of the two stages are measured to be 369.2 °C and 469.2 °C, respectively. The Fe2O3 remnant is stabilized at 36.8%. Therefore, the corresponding Fe3O4 QDs can be calculated to be 35.6% by mass while the carbon content is 64.4% in the Fe3O4 QDs@C/RGO composite.
The chemical valence and composition can be determined using the XPS technique. Fig. 2d shows the survey spectrum of the Fe3O4 QDs@C/RGO composite, which consists of the three elements C, O, and Fe with corresponding weight percentages of 66.31%, 17.55%, and 16.14%, respectively. This result reveals the high purity of the Fe3O4 QDs@C/RGO composite. As shown in Fig. 2e, the high-resolution C 1s spectrum can be resolved into four fitted peaks at 284.6, 285.3, 286.5, and 289.5 eV, which are attributed to C–C/C![[double bond, length as m-dash]](https://www.rsc.org/images/entities/char_e001.gif) C, C–O, C
C, C–O, C![[double bond, length as m-dash]](https://www.rsc.org/images/entities/char_e001.gif) O, and O–C
O, and O–C![[double bond, length as m-dash]](https://www.rsc.org/images/entities/char_e001.gif) O bonds, respectively.39,40 From the magnified O 1s spectrum in Fig. 2f, the peaks at 530.4, 531.5, and 533.3 eV are ascribed to Fe–O, Fe–O–C, and C–O/C
O bonds, respectively.39,40 From the magnified O 1s spectrum in Fig. 2f, the peaks at 530.4, 531.5, and 533.3 eV are ascribed to Fe–O, Fe–O–C, and C–O/C![[double bond, length as m-dash]](https://www.rsc.org/images/entities/char_e001.gif) O bonds, respectively. The strong interaction between Fe3O4 and carbon matrix via the Fe–O–C linkage will be beneficial to maintain the structural stability of Fe3O4 QDs@C/RGO in the processes of discharging and charging as an anode material for LIBs.41,42Fig. 2g exhibits the high-resolution Fe 2p spectrum with two peaks located at 724.6 and 711.0 eV. For the fitting curves, two dominant peaks located at 726.0 and 712.4 eV are ascribed to the Fe 2p1/2 and Fe 2p3/2 states of Fe(III), while the other two peaks at 724.4 and 710.8 eV correspond to the Fe 2p1/2 and Fe 2p3/2 states of Fe(II), respectively.
O bonds, respectively. The strong interaction between Fe3O4 and carbon matrix via the Fe–O–C linkage will be beneficial to maintain the structural stability of Fe3O4 QDs@C/RGO in the processes of discharging and charging as an anode material for LIBs.41,42Fig. 2g exhibits the high-resolution Fe 2p spectrum with two peaks located at 724.6 and 711.0 eV. For the fitting curves, two dominant peaks located at 726.0 and 712.4 eV are ascribed to the Fe 2p1/2 and Fe 2p3/2 states of Fe(III), while the other two peaks at 724.4 and 710.8 eV correspond to the Fe 2p1/2 and Fe 2p3/2 states of Fe(II), respectively.
To obtain the pore size distribution information and specific surface area of Fe3O4 QDs@C/RGO samples, nitrogen adsorption and desorption isotherms have been recorded. As shown in Fig. 2h, the isotherms are of type IV with a hysteresis loop between 0.4 and 1.0 relative pressure, indicating the mesoporous nature of the sample.43,44 In addition, the BET specific surface area of the Fe3O4 QDs@C/RGO sample is estimated to be 344 m2 g−1. The larger specific surface area facilitates the contact between electrolyte and active material.45,46 As seen from BJH pore-size distribution curves in Fig. 2i, the overwhelming existence of mesopores with a wide range of pore diameters for the Fe3O4 QDs@C/RGO composite is verified.
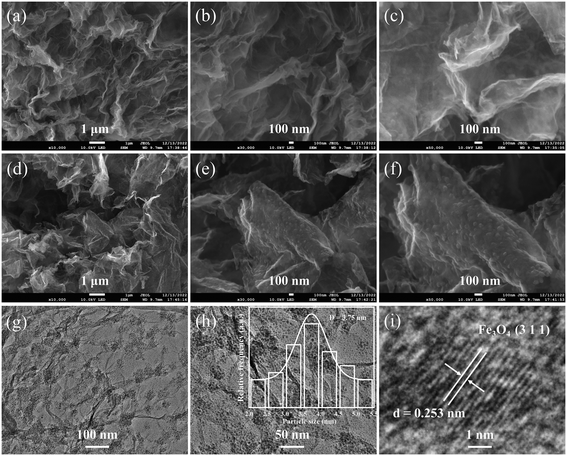
FESEM images at different magnifications are used to investigate the morphological changes from the Fe-BTC/TP-RGO precursor to the final Fe3O4 QDs@C/RGO sample. From the FESEM images of the Fe-BTC/TP-RGO precursor in Fig. 3a–c, continuous large-sized RGO framework with corrugated microstructures can be clearly seen. Moreover, no obvious restacking and the smooth surface of the RGO sheets can also be verified. These results confirm the significantly controlled crystallization of the Fe-BTC domains on the surface of the RGO sheets, which is favorable for the engineering of the Fe3O4 QDs@C/RGO composite. After thermal treatment, the thin and wrinkled RGO framework can also be seen in Fig. 3d. In Fig. 3e and f, well-distributed small clusters are uniformly dispersed and anchored on the RGO layer, which is highly related to the pyrolysis of the decorated Fe-BTC domains and induced size growth for the corresponding Fe3O4@C domains. From the TEM images of the Fe3O4 QDs@C/RGO sample in Fig. 3g and h, small Fe3O4 QDs locally assembled in a cluster configuration can be observed on the surface of the wrinkled RGO sheets. Most of the Fe3O4 QD-containing clusters are below 100 nm, and obvious space between the Fe3O4 QDs can also be verified. The particle size of Fe3O4 is accurately measured and the data nonlinearly fitted by the Gaussian algorithm, as shown in the inset image of Fig. 3h. The particle sizes are in the range of 2.0–5.5 nm, and the corresponding average particle size is calculated to be 3.75 nm. From the HRTEM image in Fig. 3i, the crystallographic spacing of an individual Fe3O4 QD is measured to be 0.253 nm, matching the (3 1 1) crystal plane of the Fe3O4 species.
3.2 Electrochemical characterization
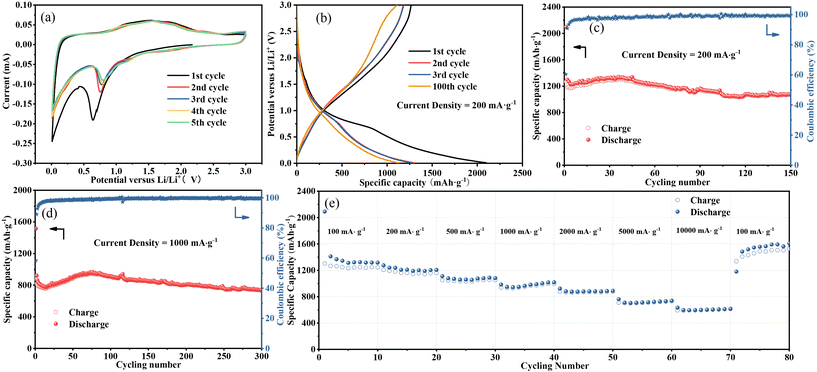
Fig. 4a exhibits the CV profiles of the Fe3O4 QDs@C/RGO composite electrode for an initial five cycles with a scan rate of 0.1 mV s−1 in the potential range of 0.01 to 3.0 V (vs. Li/Li+). In the curve of the initial cathodic scanning, a sharp peak at about 0.64 V can be observed, which corresponds to the reduction of Fe3O4 nanocrystals to metal Fe phase, accompanied by the generation of irreversible solid electrolyte interface (SEI) and the side reactions of electrolyte decomposition.47,48 The obvious peak at about 0.01 V can be ascribed to the Li+ insertion into the carbon matrix.49,50 In the subsequent curves, the cathodic peak shifts slightly to a higher voltage of about 0.81 V, which can be ascribed to the enhanced polarization and structural modification of electrode material caused by Li+ insertion-extraction during the initial cycle.51,52 Moreover, the two anodic peaks at 1.59 and 1.88 V may originate from the oxidation of the metallic Fe phase.53 It is noteworthy that the subsequent CV curves almost overlap, demonstrating the good reversibility of the Fe3O4 QDs@C/RGO composite electrode.Fig. 4b shows the profiles of the constant current charge and discharge tests of the Fe3O4 QDs@C/RGO composite at 200 mA g−1. The initial cycle provides charge and discharge capacities of about 1266.62 and 2098.59 mA h g−1, respectively. Thus, the initial coulombic efficiency can be calculated to be 60.36%. The reason for the low initial coulombic efficiency is most likely caused by the formation of SEI.54,55 The voltage plateaus for this electrode are in good agreement with the redox peaks in the CV curves. Fig. 4c shows the cycling performance of the Fe3O4 QDs@C/RGO electrode at a low-density current of 200 mA g−1. The specific capacity is maintained at 1070.84 mA h g−1 after 150 cycles. Fig. 4d shows the long-time lithium-ion storage capability of the Fe3O4 QDs@C/RGO electrode at a high-density current of 1000 mA g−1. At the 300th cycle, this electrode still provides a high reversible capacity of about 738.03 mA h g−1. These results indicate the good stability of the Fe3O4 QDs@C/RGO electrode. Due to the formation of metallic iron, this electrode exhibits a gradual capacity fading in the first few cycles. At low potentials, the in situ formed iron atoms promote the generation of a conducting polymer film, which contributes to the increase of lithium-ion storage via a pseudocapacitive behavior. Accompanying the improved reaction conditions, metallic iron atoms gradually participate in reversible electrochemical reactions.56,57 The above factors may account for a continuous capacity increase in the following cycles.
The rate capability performance of the Fe3O4 QDs@C/RGO electrode is shown in Fig. 4e. The average reversible capacities at current densities of 100, 200, 500, 1000, 2000, 5000, and 10![[thin space (1/6-em)]](https://www.rsc.org/images/entities/char_2009.gif) 000 mA g−1 are 1336.84, 1216.56, 1076.31, 980.17, 886.00, 723.83, and 607.12 mA h g−1, respectively. The electrode provides a high reversible capacity of about 1179.44 mA h g−1 when the current density is restored to the initial current density of 100 mA g−1, and the capacity is gradually increased in subsequent cycles. The unique structure with Fe3O4 QDs immobilized by pyrolytic carbon and RGO skeleton offers sufficient electric and ionic pathways at high current rate and maintains superior structural stability. Therefore, the extraordinary rate capability of the Fe3O4 QDs@C/RGO electrode can be achieved.
000 mA g−1 are 1336.84, 1216.56, 1076.31, 980.17, 886.00, 723.83, and 607.12 mA h g−1, respectively. The electrode provides a high reversible capacity of about 1179.44 mA h g−1 when the current density is restored to the initial current density of 100 mA g−1, and the capacity is gradually increased in subsequent cycles. The unique structure with Fe3O4 QDs immobilized by pyrolytic carbon and RGO skeleton offers sufficient electric and ionic pathways at high current rate and maintains superior structural stability. Therefore, the extraordinary rate capability of the Fe3O4 QDs@C/RGO electrode can be achieved.
A brief comparison of the synthesis method, reversible capacity, cycle life, and current density of Fe3O4-based anode materials is listed in Table 1.58–65 The Fe3O4 QDs@C/RGO composite electrode has the obvious merits of high reversible capacity, excellent long-time cycling stability as well as a facile synthesis method.
| Sample name | Synthesis method | Reversible capacity (mA h g−1) | Cycle life | Current density (mA g−1) | Year published |
|---|---|---|---|---|---|
| Fe3O4@C-500 (ref. 58) | Carbonization | 718 | 500 | 200 | 2023 |
| 190 | 2000 | 1000 | |||
| Fe3O4@HCS59 | Hydrothermal carbonization | 1050 | 250 | 100 | 2023 |
| Fe3O4/C (ref. 60) | Carbonization | 405.6 | 50 | 100 | 2023 |
| Si-QDs/Fe3O4/rGO61 | Self-assembly annealing | 1367.1 | 80 | 100 | 2023 |
| Fe3O4@void@N-doped C-5 (ref. 62) | Hydrothermal carbonization | 1222 | 100 | 200 | 2022 |
| Fe3O4@C (ref. 63) | Hydrothermal carbonization | 291.7 | 300 | 1000 | 2022 |
| PTA-700 (ref. 64) | Hydrothermal carbonization | 535 | 100 | 100 | 2022 |
| Fe3O4@CTP QDs65 | Coprecipitation | 810 | 200 | 100 | 2022 |
| Fe3O4 QDs@C/RGO | Hydrothermal calcination | 738.03 | 300 | 1000 | This work |
| 1070.84 | 150 | 200 |
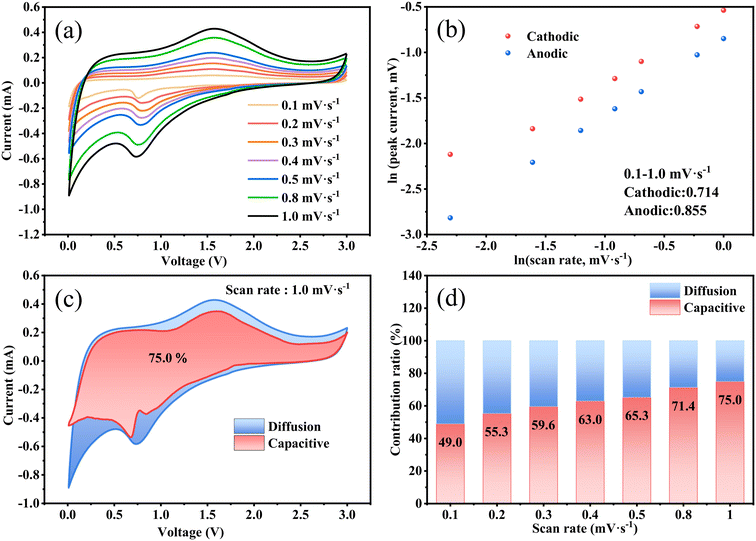
As presented in Fig. 5a, the dynamic behavior at different scan rates was tested to further investigate the lithium storage mechanism and diffusion kinetics of the Fe3O4 QDs@C/RGO electrode. The seven CV curves maintain similar properties and the peak current increases when experiencing a gradual increase in scan rate. These results indicate that the Fe3O4 QDs@C/RGO electrode has excellent electrochemical reversibility performance. The electrochemical reaction can be evaluated according to the relationship between peak current (i) and scanning rate (v), which follows the power-law relationship: i = avb, where a and b are fitting parameters. The value of b varies between 0.5 (diffusion-controlled process) and 1.0 (capacitive-controlled process), which is obtained from the slope of a ln(i)–ln(v) plot.66,67 As shown in Fig. 5b, the b values of the Fe3O4 QDs@C/RGO electrode can be calculated to be 0.714 and 0.855 for the cathode and anode peaks, which indicates the coexistence of diffusion-controlled processes and pseudocapacitive processes during the electrochemical reaction. The reversible capacity contribution can be calculated by the formula: i = k1v + k2v1/2, where k1v and k2v1/2 correspond to the pseudocapacitive contribution and diffusion-controlled contribution, respectively.68,69Fig. 5c shows the results of quantitatively analyzing the capacitive contribution of the Fe3O4 QDs@C/RGO electrode. At a scan rate of 1.0 mV s−1, the pseudocapacitive contribution rate illustrated by the pink region is about 75% of the total lithium-ion storage capacity. In Fig. 5d, with the increase of scan rate from 0.1 mV s−1 to 1.0 mV s−1, the pseudocapacitive contribution rate increases to 49.0%, 55.3%, 59.6%, 63.0%, 65.3%, 71.4%, and 75.0%, respectively. The pseudocapacitive behavior of the Fe3O4 QDs@C/RGO electrode is another factor for the inspiring rate performance.70,71
The galvanostatic intermittent titration technique (GITT) is regarded as an efficient method to explore the Li+ diffusion coefficients (DLi+) for the Fe3O4 QDs@C/RGO composite electrode. Fig. 6a presents the GITT curves during the first cycle (tested at 200 mA g−1, pulse time 20 min, relaxation time 30 min). According to Fick's second law of diffusion, DLi+ is calculated as follows:  , in which τ is relaxation time (min), mB, Vm, and MB stand for the mass, molar volume and molecular weight of the electrode material, respectively, A represents the area of the electrode plate, ΔES is the steady-state potential change via the current pulse, and ΔEτ is the potential change in the current pulse after subtracting the IR drop.72–74Fig. 6b illustrates a magnified single GITT curve, which is specifically marked with the parameters of τ, ΔES and ΔEτ. As shown in Fig. 6c and d, the average value of DLi+ reached 2.4 × 10⁻⁸ cm2 s−1 and 2.6 × 10⁻⁸ cm2 s−1 during the lithiation and delithiation processes, respectively. This result implies that an optimized Li+ diffusion condition has been created in the Fe3O4 QDs@C/RGO composite.
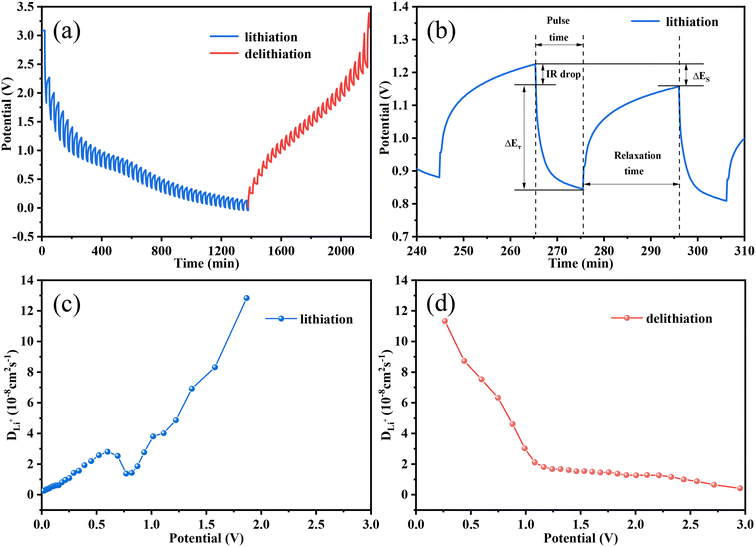 | ||
| Fig. 6 GITT curves (a) and a profile for a single GITT test (b), and variation of the DLi+ values during lithiation (c) and delithiation (d) processes of the Fe3O4 QDs@C/RGO electrode. | ||
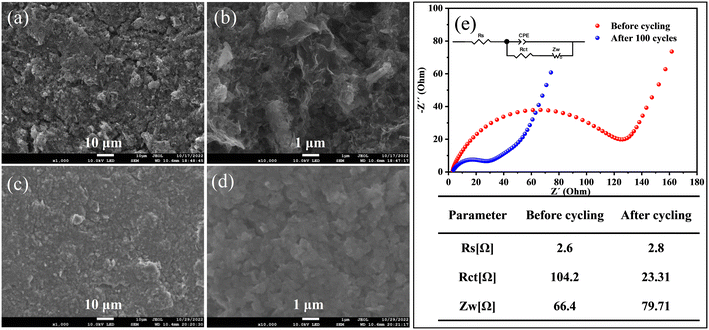
FESEM images of the Fe3O4 QDs@C/RGO electrode before and after 100 cycles are employed to investigate the morphological and structural evolution. From Fig. 7a and b, it can be seen that the overall microstructure of the Fe3O4 QDs@C/RGO composite has been largely maintained after electrode preparation, indicating the good mechanical strength of this composite sample. From Fig. 7c and d, an apparent smooth SEI film could be observed on the surface of the electrode after 100 cycles, while the electrode still maintains its integrity. These results well explain the good structural stability and excellent lithium storage properties of the Fe3O4 QDs@C/RGO electrode. EIS provides comprehensive interfacial electrochemical information, especially in the study of kinetic reaction mechanisms and the measurement of kinetic parameters of LIBs. The corresponding Nyquist plots of the Fe3O4 QDs@C/RGO electrode at different states are shown in Fig. 7e. In the equivalent circuit, constant phase angle element (CPE) is widely used in the equivalent circuit of alternating-current impedance to fit the experimental impedance data. The SEI film resistance (Rs) is the intersection of the curve starting point and the horizontal axis in the high-frequency region.75 The charge transfer resistance (Rct) is related to the diameter of the semicircle in the high-frequency and mid-frequency regions.76 Warburg impedance (Zw) corresponds to the slope of the line in the low-frequency region, reflecting the Li+ diffusion in the electrode material.77 According to the fitting results, it can be observed that the semicircle diameter obtained after 100 cycles for the Fe3O4 QDs@C/RGO composite electrode in the high- to medium-frequency region is significantly smaller than that before the cycling test, which illustrates the stable SEI formation at low potentials, better contact between the electrolyte and active material, and a significant reduction of charge transfer resistance after the activation of the Fe3O4 QDs@C/RGO composite.78
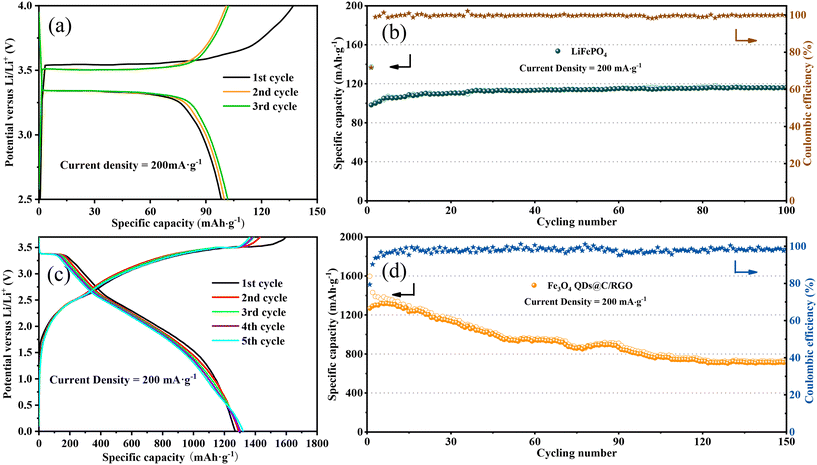
With a view to the practicality of the Fe3O4 QDs@C/RGO sample, full cells are configurated by integrating an Fe3O4 QDs@C/RGO anode and a commercial LiFePO4 cathode. To guarantee the excellent electrochemical performance of full cells, the Fe3O4 QDs@C/RGO anode is electrochemically pre-lithiated to compensate for Li+ consumption in the initial lithiation process before fabricating the full cells. Fig. 8a illustrates the charge/discharge profiles of the LiFePO4 cathode material under a low current density of 200 mA g−1, which exhibits a reversible plateau around 3.3 V. As shown in Fig. 8b, the reversible capacity reaches approximately 116.36 mA h g−1 after 100 cycles. Fig. 8c shows the galvanostatic charge/discharge voltage profiles of the Fe3O4 QDs@C/RGO//LiFePO4 full cell between 0.01 and 3.7 V at a current density at 200 mA g−1. The full cell exhibits initial lithiation and delithiation capacities of 1597.83 and 1268.54 mA h g−1, and the corresponding coulombic efficiency is calculated to be 79.39%. Moreover, the shape of the curves for the subsequent cycles is largely maintained compared with the first cycle, indicating excellent structural stability for the composite over long-time cycling. From Fig. 8d, the full cell still exhibits a high reversible capacity of about 717.29 mA h g−1 after 150 cycles under a current density of 200 mA g−1.
4. Conclusions
In a mild aqueous reaction system containing H3BTC, TP, GO, and iron foils, an Fe-BTC/TP-RGO precursor sample with improved microstructure is rationally engineered. Due to the modulation of the TP molecules, the spontaneous restacking of the RGO sheets has been effectively inhibited and the size growth of the Fe-BTC MOF domains has been significantly controlled. After a subsequent thermal treatment, the Fe3O4 QDs@C/RGO composite material is engineered, which has a unique structure with Fe3O4 QDs immobilized by pyrolytic carbon and RGO skeleton. The Fe3O4 QDs@C/RGO composite electrode exhibits a more attractive lithium-ion storage capacity with a reversible capacity of 1070.84 mA h g−1 for the electrode after 100 cycles at a low-density current of 200 mA g−1, and a high reversible capacity of about 738.03 mA h g−1 after the 300th cycle at a high-density current of 1000 mA g−1. Moreover, the Fe3O4 QDs@C/RGO sample could still have a high discharge capacity of 717.29 mA h g−1 after 150 cycles in Fe3O4 QDs@C/RGO//LiFePO4 full cells between 0.01 and 3.7 V at 200 mA g−1. The sample synthesis protocol is facile and eco-friendly, and the synthesized Fe3O4 QDs@C/RGO sample has good potential in wider fields.Conflicts of interest
There are no conflicts to declare.Acknowledgements
This work was financially supported by the Thousand Talents Plan, the World-Class University and Discipline, the Taishan Scholar's Advantageous and Distinctive Discipline Program and the World-Class Discipline Program of Shandong Province.References
- F. Wu, J. Maier and Y. Yu, Chem. Soc. Rev., 2020, 49, 1569–1614 RSC.
- J. Xu, X. Cai, S. Cai, Y. Shao, C. Hu, S. Lu and S. Ding, Energy Environ. Sci., 2023, 0, e12450 CAS.
- J. Li, J. Fleetwood, W. B. Hawley and W. Kays, Chem. Rev., 2022, 122, 903–956 CrossRef CAS.
- L. Zhang, C. Zhu, S. Yu, D. Ge and H. Zhou, J. Energy Chem., 2022, 66, 260–294 CrossRef CAS.
- H. Cheng, J. G. Shapter, Y. Li and G. Gao, J. Energy Chem., 2021, 57, 451–468 CrossRef CAS.
- C. Wang, C. Yang and Z. Zheng, Adv. Sci., 2022, 9, e2105213 CrossRef.
- C. Hu, Y. J. Hu, A. P. Chen, X. Z. Duan, H. Jiang and C. Z. Li, Engineering, 2022, 18, 154–160 CrossRef CAS.
- Y. Liu, C. Hu, L. Chen, Y. J. Hu, H. Jiang and C. Z. Li, J. Energy Chem., 2022, 69, 450–455 CrossRef CAS.
- C. Hu, L. Chen, Y. J. Hu, A. P. Chen, L. Chen, H. Jiang and C. Z. Li, Adv. Mater., 2021, 33, 2103558 CrossRef CAS.
- J. P. Xie, J. L. Li, X. D. Li, H. Lei, W. C. Zhuo, X. B. Li, G. Hong, K. N. Hui, L. K. Pan and W. J. Mai, CCS Chem., 2021, 3, 791–799 CrossRef CAS.
- Z. Yi, D. L. Fang, W. Q. Zhang, J. Tian, S. M. Chen, J. B. Liang, N. Lin and Y. T. Qian, CCS Chem., 2021, 3, 1306–1315 CrossRef CAS.
- N. Wang, Y. Y. Liu, Z. X. Shi, Z. L. Yu, H. Y. Duan, S. Fang, J. Y. Yang and X. M. Wang, Rare Met., 2021, 41, 438–447 CrossRef.
- S. Fang, D. Bresser and S. Passerini, Adv. Energy Mater., 2019, 10, 1902485 CrossRef.
- Y. Yang, W. Yuan, X. Zhang, C. Wang, Y. Yuan, Y. Huang, Y. Ye, Z. Qiu and Y. Tang, Renewable Sustainable Energy Rev., 2020, 127, 109884 CrossRef CAS.
- R. Puttaswamy, R. K. Pai and D. Ghosh, J. Mater. Chem. A, 2022, 10, 508–553 RSC.
- Y. Yu, T. Ma and H. Huang, Adv. Funct. Mater., 2023, 33, 2213770 CrossRef CAS.
- J. F. S. Fernando, C. Zhang, K. L. Firestein, J. Y. Nerkar and D. V. Golberg, J. Mater. Chem. A, 2019, 7, 8460–8471 RSC.
- C. X. Peng, B. D. Chen, Y. Qin, S. H. Yang, C. Z. Li, Y. H. Zuo, S. Y. Liu and J. H. Yang, ACS Nano, 2012, 6, 1074–1081 CrossRef CAS.
- J. Y. Wu, H. Lin, D. J. Moss, K. P. Loh and B. H. Jia, Nat. Rev. Chem., 2023, 7, 162–183 CrossRef.
- F. Wang, W. Fang, X. Ming, Y. Liu, Z. Xu and C. Gao, Appl. Phys. Rev., 2023, 10, 011311 CAS.
- R. C. K. Reddy, J. Lin, Y. Chen, C. Zeng, X. Lin, Y. Cai and C.-Y. Su, Coord. Chem. Rev., 2020, 420, 213434 CrossRef CAS.
- R. A. Bajwa, U. Farooq, S. Ullah, M. Salman, S. Haider and R. Hussain, J. Energy Storage, 2023, 72, 108708 CrossRef.
- M. H. Shen and H. L. Ma, Coord. Chem. Rev., 2022, 470, 214715 CrossRef CAS.
- Y. Zhang, Y. F. Liu, D. Wang, J. C. Liu, J. W. Zhao and L. J. Chen, Polyoxometalates, 2023, 2, 9140017 CrossRef.
- Y. An, L. L. Wang, W. Y. Jiang, X. L. Lv, G. Q. Yuan, X. X. Hang and H. Pang, Polyoxometalates, 2023, 2, 9140030 CrossRef.
- R. Jia, R. Zhang, L. Yu, X. Kong, S. Bao, M. Tu, X. Liu and B. Xu, J. Colloid Interface Sci., 2023, 630, 86–98 CrossRef CAS PubMed.
- Y. Wang, Z. Shi and J. Yin, ACS Appl. Mater. Interfaces, 2011, 3, 1127–1133 CrossRef CAS.
- O. Akhavan, M. Kalaee, Z. S. Alavi, S. M. A. Ghiasi and A. Esfandiar, Carbon, 2012, 50, 3015–3025 CrossRef CAS.
- X. Weng, J. Wu, L. Ma, G. Owens and Z. Chen, Chem. Eng. J., 2019, 359, 976–981 CrossRef CAS.
- B. Xu, J. Zhang, Y. Gu, Z. Zhang, W. Al Abdulla, N. A. Kumar and X. S. Zhao, Electrochim. Acta, 2016, 212, 473–480 CrossRef CAS.
- Y. Yang, Y. Bai, F. Zhao, E. Yao, J. Yi, C. Xuan and S. Chen, RSC Adv., 2016, 6, 67308–67314 RSC.
- T. A. Vu, G. H. Le, H. T. Vu, K. T. Nguyen, T. T. T. Quan, Q. K. Nguyen, H. T. K. Tran, P. T. Dang, L. D. Vu and G. D. Lee, Mater. Res. Express, 2017, 4, 035038 CrossRef.
- H. T. Vu, M. B. Nguyen, T. M. Vu, G. H. Le, T. T. T. Pham, T. D. Nguyen and T. A. Vu, Top. Catal., 2020, 63, 1046–1055 CrossRef CAS.
- B. Xu, L. Yu, X. Zhao, H. Wang, C. Wang, L. Y. Zhang and G. Wu, J. Colloid Interface Sci., 2021, 584, 827–837 CrossRef CAS.
- C. Xiao, H. Li, Y. Zhao, X. Zhang and X. Wang, J. Environ. Manage., 2020, 275, 111262 CrossRef CAS.
- X. Kong, L. Shan, R. Zhang, S. Bao, M. Tu, R. Jia, L. Yu, H. Li and B. Xu, J. Colloid Interface Sci., 2022, 628, 1–13 CrossRef CAS.
- P. Pachfule, D. Shinde, M. Majumder and Q. Xu, Nat. Chem., 2016, 8, 718–724 CrossRef CAS PubMed.
- D. Graf, F. Molitor, K. Ensslin, C. Stampfer, A. Jungen, C. Hierold and L. Wirtz, Nano Lett., 2007, 7, 238–242 CrossRef CAS PubMed.
- Z. Shen, H. Xing, Y. Zhu, X. Ji, Z. Liu and L. Wang, J. Mater. Sci.: Mater. Electron., 2017, 28, 13896–13904 CrossRef CAS.
- B. Xu, X. Guan, L. Y. Zhang, X. Liu, Z. Jiao, X. Liu, X. Hu and X. S. Zhao, J. Mater. Chem. A, 2018, 6, 4048–4054 RSC.
- Y. Cui, W. Feng, W. Liu, J. Li, Y. Zhang, Y. Du, M. Li, W. Huang, H. Wang and S. Liu, Nanoscale, 2020, 12, 10816–10826 RSC.
- Y. Liu, D. He, Q. Tan, Q. Wan, K. Han, Z. Liu, P. Li, F. An and X. Qu, J. Mater. Chem. A, 2019, 7, 19430–19441 RSC.
- Q. Wu, R. Yu, Z. Zhou, H. Liu and R. Jiang, Langmuir, 2021, 37, 785–792 CrossRef CAS PubMed.
- Y. Yuan, Z. Kong, L. Qiao, Z. Xu, Z. Wang, X. Teng, Y. Dong, X. Liu, A. Fu, Y. Li and H. Li, ChemElectroChem, 2021, 8, 4480–4489 CrossRef CAS.
- Y. Yin, C. Ma, W. D. Cai, W. M. Qiao, L. C. Ling and J. T. Wang, ChemNanoMat, 2022, 8, e202100490 CrossRef CAS.
- X. Meng, Y. Xu, X. Sun, J. Wang, L. Xiong, X. Du and S. Mao, J. Mater. Chem. A, 2015, 3, 12938–12946 RSC.
- Y. He, L. Huang, J.-S. Cai, X.-M. Zheng and S.-G. Sun, Electrochim. Acta, 2010, 55, 1140–1144 CrossRef CAS.
- Y. Wang, L. Chen, H. Liu, Z. Xiong, L. Zhao, S. Liu, C. Huang and Y. Zhao, Chem. Eng. J., 2019, 356, 746–755 CrossRef.
- Y. Cui, W. Liu, Y. Lyu, Y. Zhang, H. Wang, Y. Liu and D. Li, J. Mater. Chem. A, 2018, 6, 18276–18285 RSC.
- J. Song, Y. Ji, Y. Li, X. Lu, W. Ren, Q. Tian, J. Chen and L. Yang, Ceram. Int., 2021, 47, 26092–26099 CrossRef CAS.
- Y. Ma, J. Huang, L. Lin, Q. Xie, M. Yan, B. Qu, L. Wang, L. Mai and D. Peng, J. Power Sources, 2017, 365, 98–108 CrossRef CAS.
- J. Cheng, Y. Zhou, Y. Wu, Y. Pan, X. Luo, Y. Huang, Y. Zhou, L. Zhu and Z. Yuan, J. Alloys Compd., 2023, 930, 167429 CrossRef CAS.
- D. Yoon, J. Hwang, W. Chang and J. Kim, Chem. Eng. J., 2017, 317, 890–900 CrossRef CAS.
- R. Zhang, S. Bao, Q. Tan, B. Li, C. Wang, L. Shan, C. Wang and B. Xu, J. Colloid Interface Sci., 2021, 600, 602–612 CrossRef CAS.
- Y. Yan, X. Lu, Y. Li, J. Song, Q. Tian, L. Yang and Z. Sui, J. Alloys Compd., 2022, 899, 163342 CrossRef CAS.
- R. Zhang, C. Lv, S. Bao, J. Gao, Y. Xie, F. Zheng, X. Liu, Y. Wen and B. Xu, J. Colloid Interface Sci., 2022, 628, 154–165 CrossRef CAS.
- X. Meng, J. Huang, Y. Bian, H. Du, Y. Xu, S. Zhu, Q. Li, M. Chen and M.-C. Lin, J. Solid State Chem., 2021, 303, 122456 CrossRef CAS.
- M. Li, W. Ma, F. Tan, B. Yu, G. Cheng, H. Gao and Z. Zhang, J. Power Sources, 2023, 574, 233146 CrossRef CAS.
- L. Singer, W. Kukułka, E. Thauer, N. Gräßler, A. Asyuda, M. Zharnikov, E. Mijowska and R. Klingeler, Electrochim. Acta, 2023, 448, 142155 CrossRef CAS.
- W. Yodying, T. Sarakonsri, N. Ratsameetammajak, K. Khunpakdee, M. Haruta and T. Autthawong, Crystals, 2023, 13, 280 CrossRef CAS.
- W. Hu, K. He, S. Wu, T. Chen, X. Yu, Y. Liang, M. Zheng, Y. Xiao, H. Dong, Y. Liu and H. Hu, J. Alloys Compd., 2023, 943, 168947 CrossRef CAS.
- J. Wang, Q. Hu, W. Hu, W. Zhu, Y. Wei, K. Pan, M. Zheng and H. Pang, Molecules, 2022, 27, 396 CrossRef CAS PubMed.
- J. Huang, Q. Dai, C. Cui, H. Ren, X. Lu, Y. Hong and S. Woo Joo, J. Electroanal. Chem., 2022, 918, 116508 CrossRef CAS.
- Q. Wei, H. Zhu, S. Yu, G. Xu, J. Yin, J. Tong, T. Chen, X. He, P. Guo, H. Jiang, J. Li and Y. Wang, Appl. Surf. Sci., 2023, 608, 155093 CrossRef CAS.
- F. Shi, Q. Liu, Z. Jin, G. Huang, B. Xing, J. Jia and C. Zhang, J. Alloys Compd., 2022, 890, 161911 CrossRef CAS.
- V. Augustyn, J. Come, M. A. Lowe, J. W. Kim, P. L. Taberna, S. H. Tolbert, H. D. Abruna, P. Simon and B. Dunn, Nat. Mater., 2013, 12, 518–522 CrossRef CAS PubMed.
- Q. Chen, W. Zhong, J. Zhang, C. Gao, W. Liu, G. Li and M. Ren, J. Alloys Compd., 2019, 772, 557–564 CrossRef CAS.
- V. Augustyn, P. Simon and B. Dunn, Energy Environ. Sci., 2014, 7, 1597 RSC.
- Z. Liu, L. Liu, Z. Zhao, J. He, S. Wang and C. Xiong, Appl. Surf. Sci., 2020, 526, 146639 CrossRef CAS.
- J. Song, Y. Li, X. Lu, W. Zhang, Y. Xiang, J. Chen and Q. Tian, Appl. Surf. Sci., 2022, 604, 154502 CrossRef CAS.
- B. Yin, X. Cao, A. Pan, Z. Luo, S. Dinesh, J. Lin, Y. Tang, S. Liang and G. Cao, Adv. Sci., 2018, 5, 1800829 CrossRef PubMed.
- C. Lv, C. Lin and X. S. Zhao, Adv. Energy Mater., 2021, 12, 2102550 CrossRef.
- H. Zhang, P. Zong, M. Chen, H. Jin, Y. Bai, S. Li, F. Ma, H. Xu and K. Lian, ACS Nano, 2019, 13, 3054–3062 CrossRef CAS PubMed.
- Y. Cheng, S. Wang, L. Zhou, L. Chang, W. Liu, D. Yin, Z. Yi and L. Wang, Small, 2020, 16, e2000681 CrossRef PubMed.
- R. Ding, J. Zhang, J. Qi, Z. Li, C. Wang and M. Chen, ACS Appl. Mater. Interfaces, 2018, 10, 13470–13478 CrossRef CAS PubMed.
- Y. Xie, Y. Qiu, L. Tian, T. Liu and X. Su, J. Alloys Compd., 2022, 894, 162384 CrossRef CAS.
- H. Li, J. Wang, Y. Li, Y. Zhao, Y. Tian, I. Kurmanbayeva and Z. Bakenov, J. Electroanal. Chem., 2019, 847, 113240 CrossRef CAS.
- Y. Zhao, X. Zhai, D. Yan, C. Ding, N. Wu, D. Su, Y. Zhao, H. Zhou, X. Zhao, J. Li and H. Jin, Electrochim. Acta, 2017, 243, 18–25 CrossRef CAS.
| This journal is © The Royal Society of Chemistry 2024 |

